
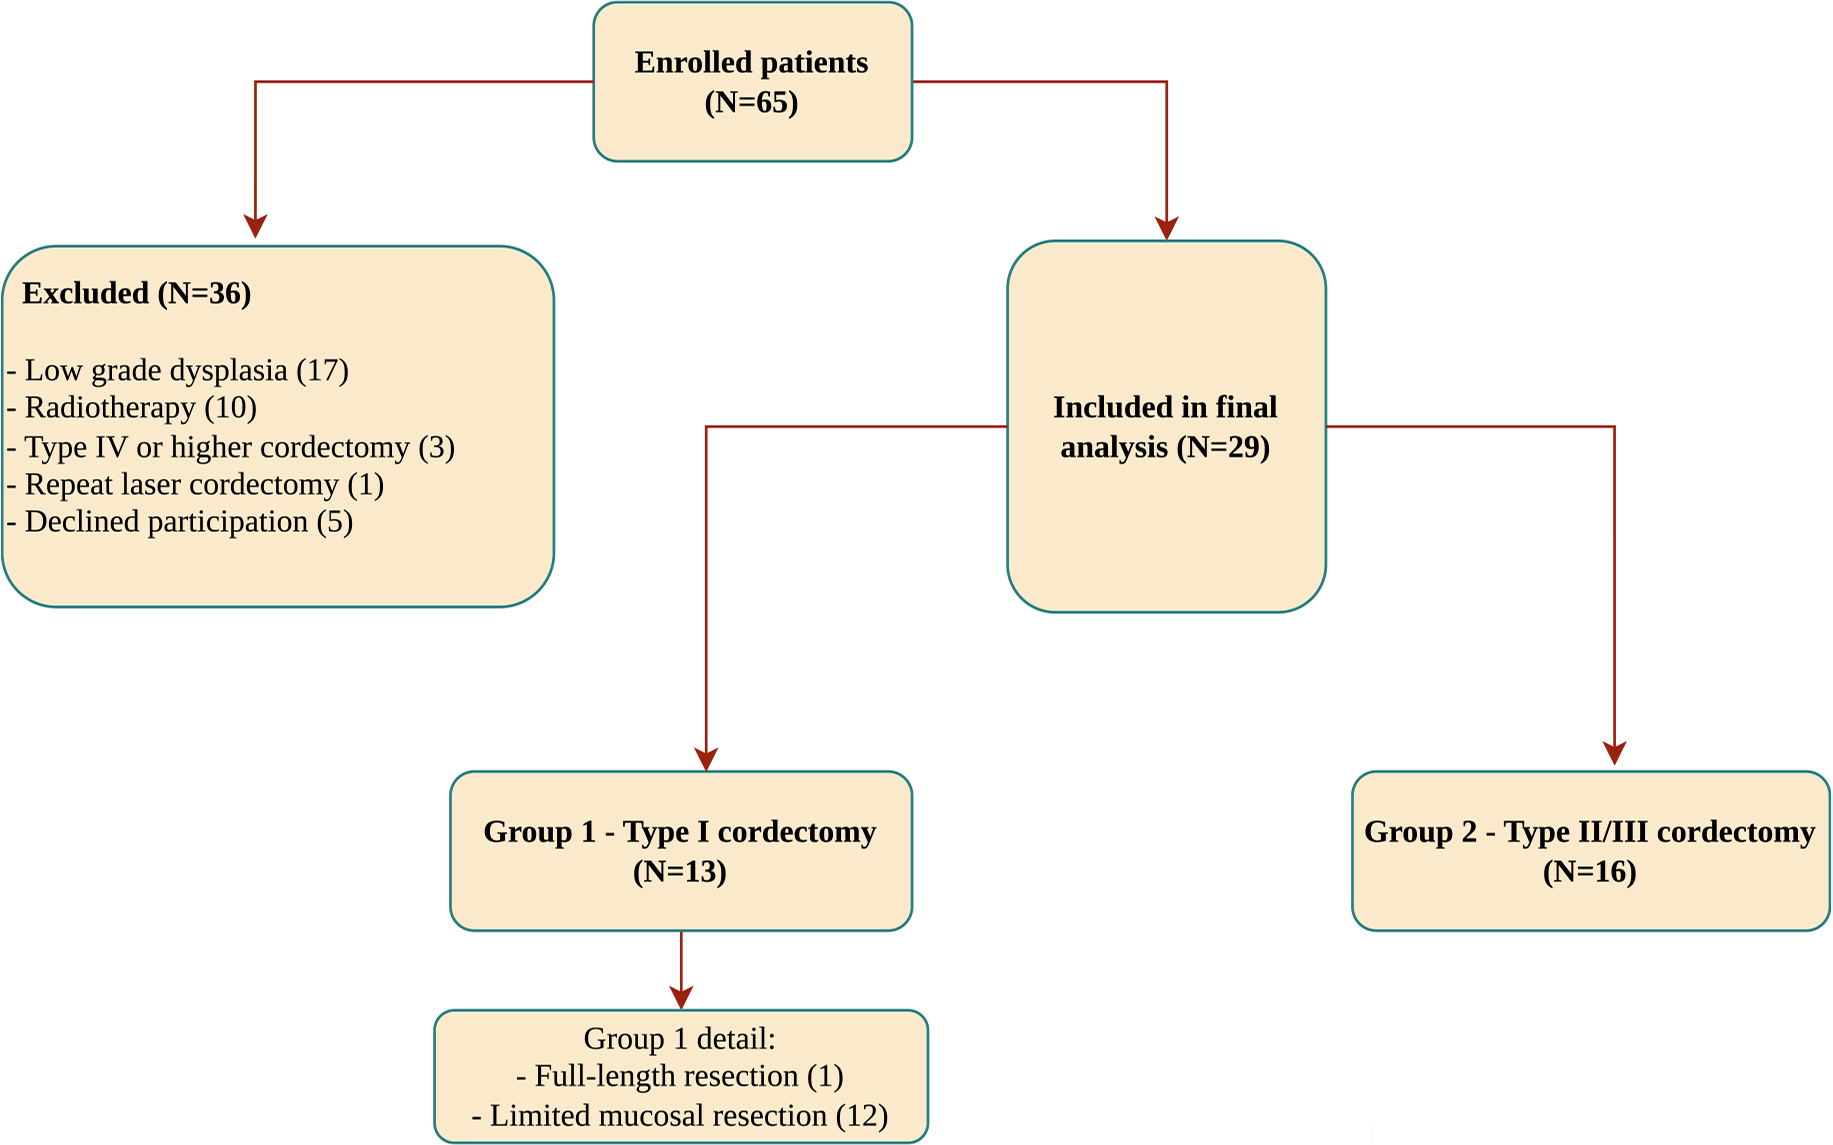
FIGURE 1.
Patient flow diagram.
TABLE 1.
Demographic and clinical characteristics of patients
| Laser cordectomy Type I; n = 13 | Laser cordectomy Type II/III; n = 16 | |
|---|---|---|
| Male, n (%) | 11 (84.6) | 15 (93.8) |
| Age at cordectomy, years, mean (SD) | 66.9 (5.3) | 68.0 (7.8) |
| Smoking before treatment, n (%) | 10 (76.9) | 11 (68.8) |
| Brinkman index, mean (SD) | 794.6 (700.9) | 593.8 (692.6) |
| Brinkman index, n (%) | ||
| Light (0–199) | 4 (30.8) | 5 (31.3) |
| Moderate (200–599) | 1 (7.7) | 4 (25.0) |
| Heavy (≥ 600) | 8 (61.5) | 7 (43.8) |
| GERD symptoms, n (%) | 6 (46.2) | 4 (25.0) |
| Allergy, n (%) | 2 (15.4) | 2 (12.5) |
| Thyroid disease, n (%) | 1 (7.7) | 1 (6.3) |
| Neck spine issues, n (%) | 6 (46.2) | 3 (18.8) |
| Loud speech, n (%) | 7 (53.8) | 9 (56.3) |
| Fast speech tempo, n (%) | 4 (30.8) | 4 (25.0) |
| Vocal strain, n (%) | ||
| Mild | 7 (53.8) | 7 (43.8) |
| Moderate | 4 (30.8) | 4 (25.0) |
| Severe | 2 (15.4) | 5 (31.3) |
| Hearing, n (%) | ||
| Good | 12 (92.3) | 15 (93.8) |
| Poor | 0 (0) | 1 (6.3) |
| Hearing aid | 1 (7.7) | 0 (0) |
TABLE 4.
Objective assessments of vocal fold function and voice quality; by study group and time of measurement
| Parameter / Patient group | Before treatment | 1 month after treatment | 3 months after treatment | 12 months after treatment | P-value 1 |
|---|---|---|---|---|---|
| Fundamental laryngeal frequency (F0), Hz | |||||
| Cordectomy Type I | 156.19 ± 11.40 (147) | 170.49 ± 12.95 (154) | 166.58 ± 11.55 (165) | 164.27 ± 10.26 (150) | 0.562 |
| Cordectomy Type II/III | 147.92 ± 10.29 (131) | 182.76 ± 16.12 (162) | 161.26 ± 10.56 (149) | 168.67 ± 11.61 (155) | 0.153 |
| P-value 2 | 0.595 | 0.571 | 0.737 | 0.784 | 0.652 |
| Jitter, % | |||||
| Cordectomy Type I | 2.18 ± 0.60 (1.5) | 2.10 ± 0.51 (1.7) | 2.22 ± 0.52 (1.4) | 2.19 ± 0.44 (1.6) | 0.996 |
| Cordectomy Type II/III | 3.73 ± 1.13 (1.8) | 5.04 ± 0.82 (4.2) | 3.84 ± 0.78 (2.9) | 4.06 ± 0.84 (3.1) | 0.519 |
| P-value 2 | 0.268 | 0.008 | 0.111 | 0.075 | 0.606 |
| Shimmer, % | |||||
| Cordectomy Type I | 5.83 ± 1.29 (3.9) | 5.87 ± 0.90 (4.3) | 5.66 ± 0.87 (4.3) | 6.17 ± 0.89 (6.0) | 0.975 |
| Cordectomy Type II/III | 8.53 ± 1.45 (6.4) | 12.76 ± 1.67 (11.0) | 7.68 ± 1.04 (7.7) | 9.06 ± 1.07 (7.9) | 0.010 |
| P-value 2 | 0.185 | 0.001 | 0.158 | 0.053 | 0.057 |
| Noise-to-harmonic ratio (NHR) | |||||
| Cordectomy Type I | 0.17 ± 0.02 (0.13) | 0.16 ± 0.02 (0.15) | 0.15 ± 0.02 (0.14) | 0.16 ± 0.02 (0.14) | 0.837 |
| Cordectomy Type II/III | 0.24 ± 0.05 (0.16) | 0.36 ± 0.06 (0.30) | 0.21 ± 0.04 (0.17) | 0.26 ± 0.04 (0.20) | 0.064 |
| P-value 2 | 0.192 | 0.004 | 0.202 | 0.070 | 0.133 |
| Soft phonation index (SPI) | |||||
| Cordectomy Type I | 17.38 ± 2.46 (15.8) | 16.90 ± 3.04 (13.6) | 18.05 ± 1.70 (17.4) | 13.71 ± 2.14 (10.2) | 0.482 |
| Cordectomy Type II/III | 18.65 ± 2.76 (17.8) | 12.20 ± 2.02 (10.8) | 21.40 ± 3.17 (18.1) | 14.59 ± 1.81 (13.6) | 0.005 |
| P-value 2 | 0.739 | 0.195 | 0.363 | 0.754 | 0.221 |
| Voice turbulence index (VTI) | |||||
| Cordectomy Type I | 0.06 ± 0.02 (0.05) | 0.06 ± 0.01 (0.04) | 0.05 ± 0.01 (0.04) | 0.06 ± 0.01 (0.06) | 0.693 |
| Cordectomy Type II/III | 0.08 ± 0.01 (0.06) | 0.14 ± 0.02 (0.11) | 0.10 ± 0.03 (0.06) | 0.11 ± 0.03 (0.07) | 0.099 |
| P-value 2 | 0.500 | 0.010 | 0.089 | 0.099 | 0.196 |
| Maximum phonation time (MPT), seconds | |||||
| Cordectomy Type I | 13.9 ± 0.9 (14) | 14.9 ± 1.5 (13.0) | 16.3 ± 1.9 (14.0) | 16.2 ± 1.1 (15.0) | 0.341 |
| Cordectomy Type II/III | 13.9 ± 1.2 (13.5) | 9.8 ± 1.0 (9.5) | 8.5 ± 0.8 (8.0) | 12.9 ± 1.4 (13.0) | 0.002 |
| P-value 2 | 0.955 | 0.006 | 0.002 | 0.100 | 0.001 |
| Mean loudness (ML), dB | |||||
| Cordectomy Type I | 57.40 ± 1.49 (56.4) | 58.33 ± 1.84 (58.2) | 60.46 ± 1.38 (58.4) | 57.07 ± 1.59 (58.0) | 0.191 |
| Cordectomy Type II/III | 54.76 ± 1.70 (55.1) | 55.48 ± 3.14 (53.9) | 59.05 ± 1.49 (58.2) | 60.05 ± 1.39 (60.6) | 0.087 |
| P-value 2 | 0.263 | 0.467 | 0.501 | 0.168 | 0.206 |
| S/Z Ratio | |||||
| Cordectomy Type I | 1.04 ± 0.06 (1.0) | 1.01 ± 0.02 (1.0) | 0.93 ± 0.04 (1.0) | 0.94 ± 0.05 (1.0) | 0.240 |
| Cordectomy Type II/III | 1.04 ± 0.04 (1.0) | 1.58 ± 0.24 (1.3) | 1.26 ± 0.13 (1.0) | 1.20 ± 0.11 (1.0) | 0.048 |
| P-value 2 | 0.981 | 0.029 | 0.026 | 0.037 | 0.071 |
| Reflux symptom index (RSI) | |||||
| Cordectomy Type I | 10.5 ± 2.3 (8.0) | 7.8 ± 1.5 (8.0) | 7.9 ± 1.4 (9.0) | 7.9 ± 1.7 (6.0) | 0.324 |
| Cordectomy Type II/III | 10.3 ± 1.9 (8.0) | 10.9 ± 1.8 (9.0) | 8.6 ± 1.6 (7.5) | 7.3 ± 1.4 (5.5) | 0.045 |
| P-value 2 | 0.923 | 0.202 | 0.774 | 0.782 | 0.278 |
| Reflux finding score (RFS) | |||||
| Cordectomy Type I | 7.1 ± 1.5 (5.0) | 6.5 ± 1.3 (5.0) | 6.5 ± 1.1 (5.0) | 4.2 ± 1.0 (4.0) | 0.014 |
| Cordectomy Type II/III | 5.5 ± 1.2 (7.0) | 6.2 ± 1.4 (6.5) | 6.5 ± 1.3 (6.0) | 5.6 ± 0.9 (5.5) | 0.664 |
| P-value 2 | 0.412 | 0.854 | 0.982 | 0.343 | 0.184 |
| Muscle tension dysphonia (MTD), n (%) | |||||
| Cordectomy Type I | 2/13 (15.4) | 3/13 (23.1) | 3/13 (23.1) | 2/13 (15.4) | 1 |
| Cordectomy Type II/III | 3/16 (18.8) | 7/16 (43.8) | 7/16 (43.8) | 8/16 (50.0) | 0.068 |
| P-value 2 | 0.981 | 0.029 | 0.026 | 0.037 | 0.071 |
| Reflux symptom index (RSI) | |||||
| Cordectomy Type I | 10.5 ± 2.3 (8.0) | 7.8 ± 1.5 (8.0) | 7.9 ± 1.4 (9.0) | 7.9 ± 1.7 (6.0) | 0.324 |
| Cordectomy Type II/III | 10.3 ± 1.9 (8.0) | 10.9 ± 1.8 (9.0) | 8.6 ± 1.6 (7.5) | 7.3 ± 1.4 (5.5) | 0.045 |
| P-value 2 | 0.923 | 0.202 | 0.774 | 0.782 | 0.278 |
| Reflux finding score (RFS) | |||||
| Cordectomy Type I | 7.1 ± 1.5 (5.0) | 6.5 ± 1.3 (5.0) | 6.5 ± 1.1 (5.0) | 4.2 ± 1.0 (4.0) | 0.014 |
| Cordectomy Type II/III | 5.5 ± 1.2 (7.0) | 6.2 ± 1.4 (6.5) | 6.5 ± 1.3 (6.0) | 5.6 ± 0.9 (5.5) | 0.664 |
| P-value 2 | 0.412 | 0.854 | 0.982 | 0.343 | 0.184 |
| Muscle tension dysphonia (MTD), n (%) | |||||
| Cordectomy Type I | 2/13 (15.4) | 3/13 (23.1) | 3/13 (23.1) | 2/13 (15.4) | 1 |
| Cordectomy Type II/III | 3/16 (18.8) | 7/16 (43.8) | 7/16 (43.8) | 8/16 (50.0) | 0.068 |
| P-value 2 | 1 | 0.433 | 0.433 | 0.114 | - |
| Intensity of scarring, n (%) | |||||
| Cordectomy Type I | 0.667 | ||||
| Mild | - | 11 (84.6) | 10 (76.9) | 12 (92.3) | |
| Moderate | - | 2 (15.4) | 3 (23.1) | 1 (7.7) | |
| Severe | - | 0 (0) | 0 (0) | 0 (0) | |
| Cordectomy Type II/III | 1 | ||||
| Mild | - | 10 (62.5) | 11 (68.8) | 11 (68.8) | |
| Moderate | - | 4 (25.0) | 4 (25.0) | 4 (25.0) | |
| Severe | - | 2 (12.5) | 1 (6.3) | 1 (6.3) | |
| P-value 2 | - | 0.477 | 1 | 0.343 | - |
TABLE 3.
Videostroboscopic assessments of vocal fold function; by study group and time of measurement
| Parameter / Patient group | Before treatment | 1 month after treatment | 3 months after treatment | 12 months after treatment | P-value1 |
|---|---|---|---|---|---|
| Vocal fold vibratory amplitude | |||||
| Cordectomy Type I | 0.002 | ||||
| Appropriate | 0 (0) | 1 (7.7) | 3 (23.1) | 5 (38.5) | |
| Diminished | 8 (61.5) | 6 (46.2) | 7 (53.8) | 6 (46.2) | |
| Absent | 5 (38.5) | 6 (46.2) | 3 (23.1) | 2 (15.4) | |
| Cordectomy Type II/III | 0.002 | ||||
| Appropriate | 1 (6.3) | 0 (0) | 0 (0) | 0 (0) | |
| Diminished | 2 (12.5) | 2 (12.5) | 7 (43.8) | 10 (62.5) | |
| Absent | 13 (81.3) | 14 (87.5) | 9 (56.3) | 6 (37.5) | |
| P-value 2 | 0.016 | 0.041 | 0.049 | 0.022 | - |
| Vocal fold phase symmetry | |||||
| Cordectomy Type I | 0.024 | ||||
| Symmetrical | 0 (0) | 0 (0) | 2 (15.4) | 4 (30.8) | |
| Asymmetrical | 13 (100) | 13 (100) | 11 (84.6) | 9 (69.2) | |
| Cordectomy Type II/III | 0.572 | ||||
| Symmetrical | 1 (6.3) | 0 (0) | 0 (0) | 1 (6.3) | |
| Asymmetrical | 15 (93.8) | 16 (100) | 16 (100) | 15 (93.8) | |
| P-value 2 | 1 | - | 0.192 | 0.144 | - |
| Vocal fold vibration regularity | |||||
| Cordectomy Type I | 0.024 | ||||
| Regular | 0 (0) | 0 (0) | 2 (15.4) | 4 (30.8) | |
| Irregular | 13 (100) | 13 (100) | 11 (84.6) | 9 (69.2) | |
| Cordectomy Type II/III | 0.572 | ||||
| Regular | 1 (6.3) | 0 (0) | 0 (0) | 1 (6.3) | |
| Irregular | 15 (93.8) | 16 (100) | 16 (100) | 15 (93.8) | |
| P-value 2 | 1 | - | 0.192 | 0.144 | - |
| Vocal fold closure | |||||
| Cordectomy Type I | 0.003 | ||||
| Complete | 2 (15.4) | 2 (15.4) | 4 (30.8) | 5 (38.5) | |
| Brief | 5 (38.5) | 5 (38.5) | 8 (61.5) | 7 (53.8) | |
| Absent | 6 (46.2) | 6 (46.2) | 1 (7.7) | 1 (7.7) | |
| Cordectomy Type II/III | 0.338 | ||||
| Complete | 2 (12.5) | 2 (12.5) | 2 (12.5) | 3 (18.8) | |
| Brief | 6 (37.5) | 3 (18.8) | 8 (50.0) | 8 (50.0) | |
| Absent | 8 (50.0) | 11 (68.8) | 6 (37.5) | 5 (31.3) | |
| P-value 2 | 1 | 0.450 | 0.145 | 0.259 | - |
| Mucosal wave movement | |||||
| Cordectomy Type I | 0.001 | ||||
| Normal | 0 (0) | 0 (0) | 3 (23.1) | 5 (38.5) | |
| Disturbed | 8 (61.5) | 7 (53.8) | 7 (53.8) | 6 (46.2) | |
| Absent | 5 (38.5) | 6 (46.2) | 3 (23.1) | 2 (15.4) | |
| Cordectomy Type II/III | 0.001 | ||||
| Normal | 0 (0) | 0 (0) | 0 (0) | 1 (6.3) | |
| Disturbed | 4 (25.0) | 3 (18.8) | 9 (56.3) | 10 (62.5) | |
| Absent | 12 (75.0) | 13 (81.3) | 7 (43.8) | 5 (31.3) | |
| P-value 2 | 0.067 | 0.064 | 0.125 | 0.126 | - |
TABLE 2.
Patient assessment of voice quality and satisfaction; by study group and time of measurement
| Parameter / Patient group | Before treatment | 1 month after treatment | 3 months after treatment | 12 months after treatment | P-value 1 |
|---|---|---|---|---|---|
| Voice quality (VAS) | |||||
| Cordectomy Type I | 4.8 (0.5) | 3.9 (0.5) | 3.5 (0.5) | 3.0 (0.4) | 0.040 |
| Cordectomy Type II/III | 5.6 (0.3) | 5.7 (0.6) | 4.3 (0.6) | 3.6 (0.5) | 0.031 |
| P-value 2 | 0.342 | 0.032 | 0.279 | 0.367 | P-value3 = 0.635 |
| Voice handicap index score (VHI) | |||||
| Cordectomy Type I | 26.9 (7.9) | 19.5 (4.9) | 15.7 (5.2) | 9.2 (3.6) | 0.041 |
| Cordectomy Type II/III | 31.6 (6.0) | 41.0 (6.8) | 24.4 (6.3) | 26.6 (7.5) | 0.016 |
| P-value 2 | 0.404 | 0.039 | 0.210 | 0.195 | P-value3 = 0.263 |
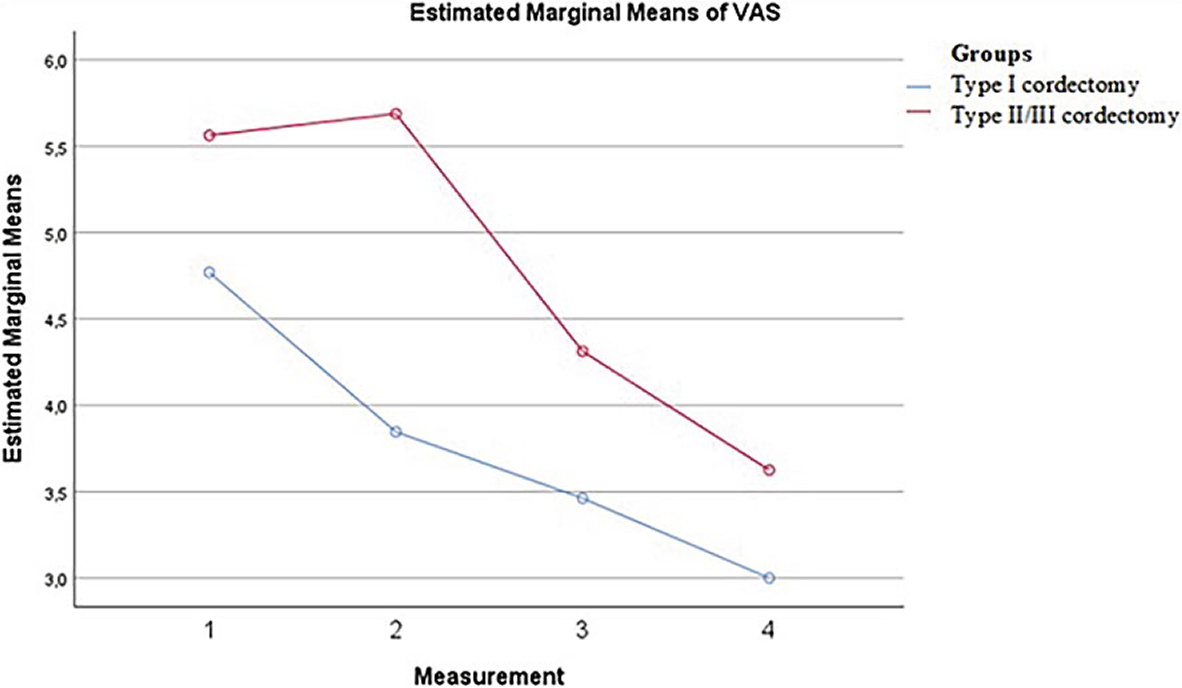
FIGURE 2.
Visual Analogue Scale (VAS) evolution during follow-up.
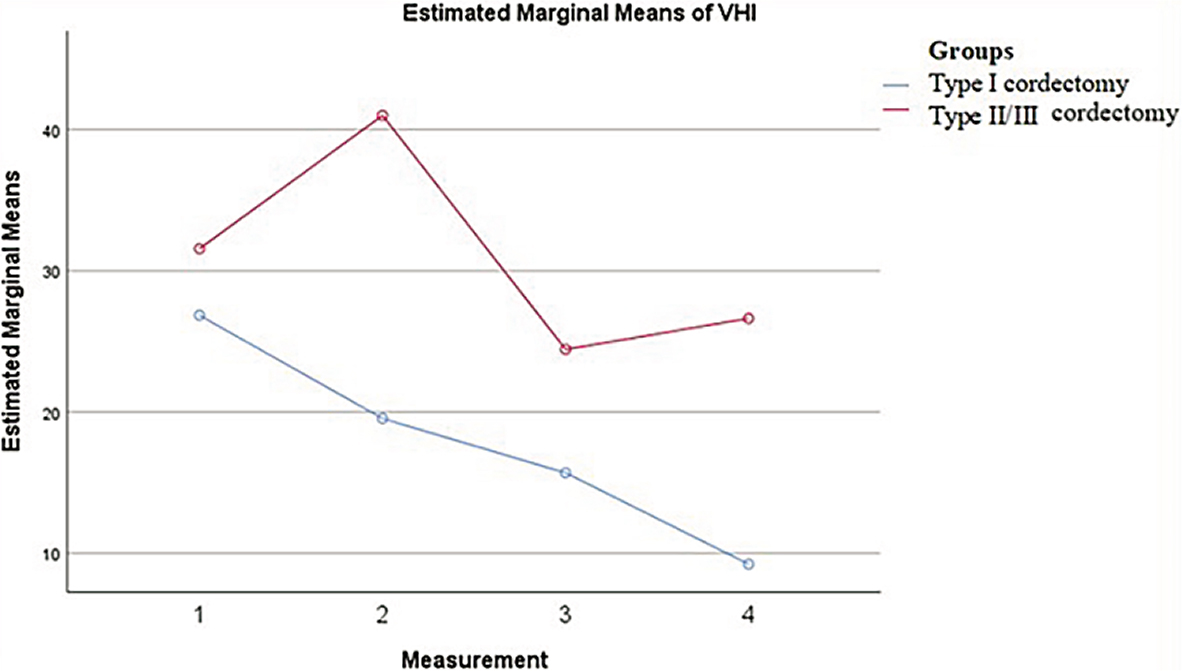
FIGURE 3.
Voice Handicap Index (VHI) evolution during follow-up.
TABLE 5.
Exploratory comparison between classical full-length type I cordectomy and limited mucosal resections within Group 1
| Variable | Full-length Type I Cordectomy | Mean of Type I Cordectomy With Partial Mucosal Preservation Group | SD | z-score |
|---|---|---|---|---|
| Mean loudness (ML) preoperative (dB) | 46.42 | 58.32 | 4.42 | −2.69 |
| Fundamental laryngeal frequency (F0) 1 month postoperatively (Hz) | 266.45 | 162.49 | 38.34 | +2.71 |
| Jitter, 1 month postoperatively (%) | 6.877 | 1.700 | 1.211 | +4.28 |
| Mean loudness (ML) 1 month postoperatively (dB) | 43.42 | 59.57 | 5.12 | −3.15 |
| Noise-to-harmonic ratio (NHR) 1 month postoperatively | 0.300 | 0.152 | 0.041 | +3.61 |
| Fundamental laryngeal frequency (F0) 3 months postoperatively (Hz) | 276.17 | 157.45 | 26.65 | +4.46 |
| Jitter, 3 months postoperatively (%) | 5.675 | 1.935 | 1.612 | +2.32 |
| Voice turbulence index (VTI) 3 months postoperatively | 0.123 | 0.045 | 0.018 | +4.38 |
| Fundamental laryngeal frequency (F0) 12 months postoperatively (Hz) | 254.02 | 156.79 | 26.45 | +3.68 |
| Jitter, 12 months postoperatively (%) | 5.457 | 1.913 | 1.300 | +2.73 |
| Shimmer, 12 months postoperatively (%) | 14.651 | 5.465 | 2.008 | +4.57 |
| Noise-to-harmonic ratio (NHR) 12 months postoperatively | 0.341 | 0.146 | 0.036 | +5.36 |