
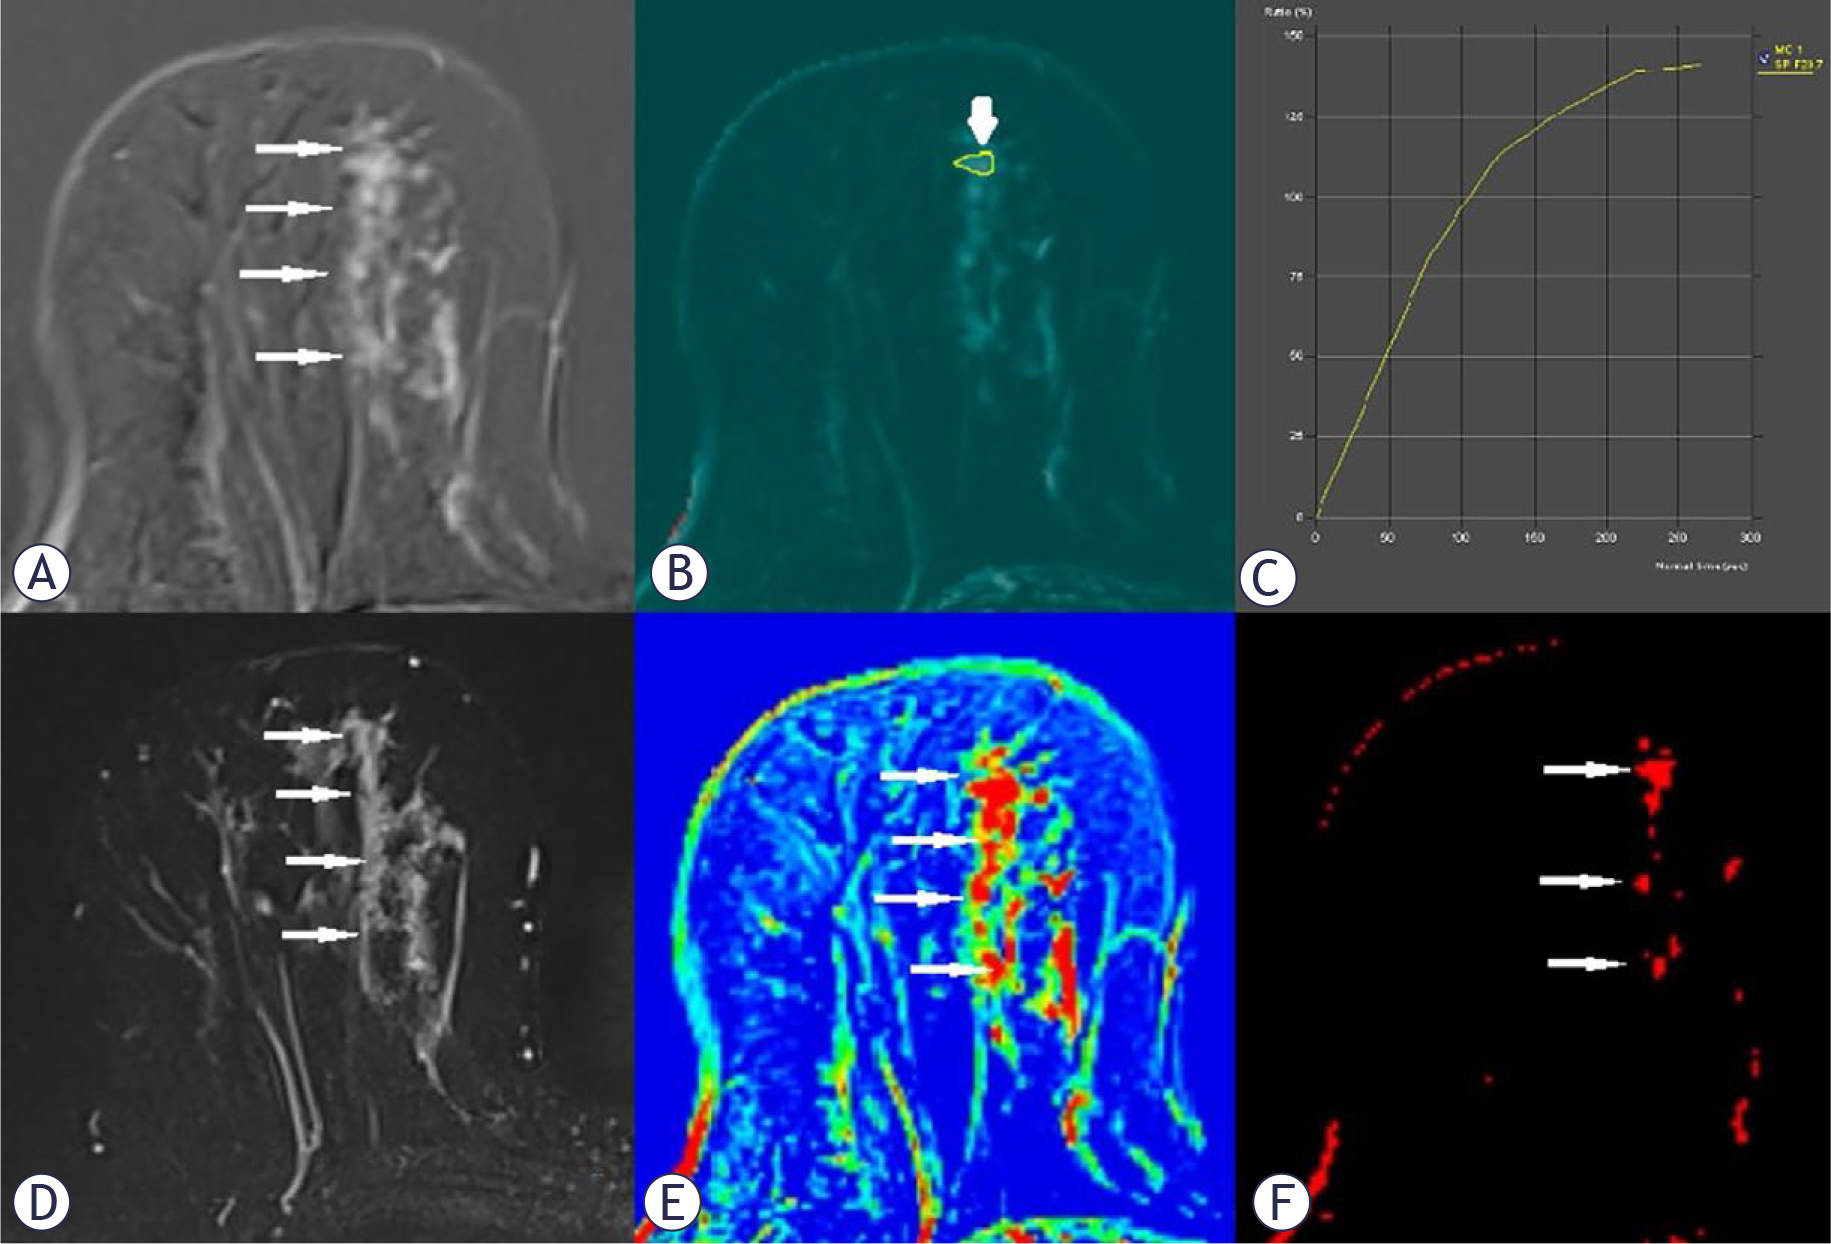
FIGURE 1.
A 69-year-old woman with biopsy-proven ductal carcinoma in situ (DCIS) presenting as segmental clumped nonmass enhancement (NME) on breast dynamic contrast-enhanced magnetic resonance imaging (DCE-MRI) (thin arrows). The upper row shows the dynamic contrast-enhanced study: subtracted postcontrast image demonstrating the extent and distribution of NME (A), wash-in parametric map (B), and time-intensity curve (TIC) analysis (C). On the wash-in map, the freehand region of interest (ROI) was placed over the fastest enhancing part of the lesion, corresponding to the area with the highest signal intensity (thick arrow). TIC analysis demonstrated medium initial enhancement and a persistent delayed phase, corresponding to type 1 kinetics. The lower row shows the corresponding turbo inversion recovery magnitude (TIRM) image with no hyperintense areas (D), positive enhancement integral (PEI) map (E), and time to peak (TTP) map (F), illustrating the semi-quantitative parameters used for lesion assessment. Final postoperative histopathology confirmed pure DCIS without invasive carcinoma (IC).
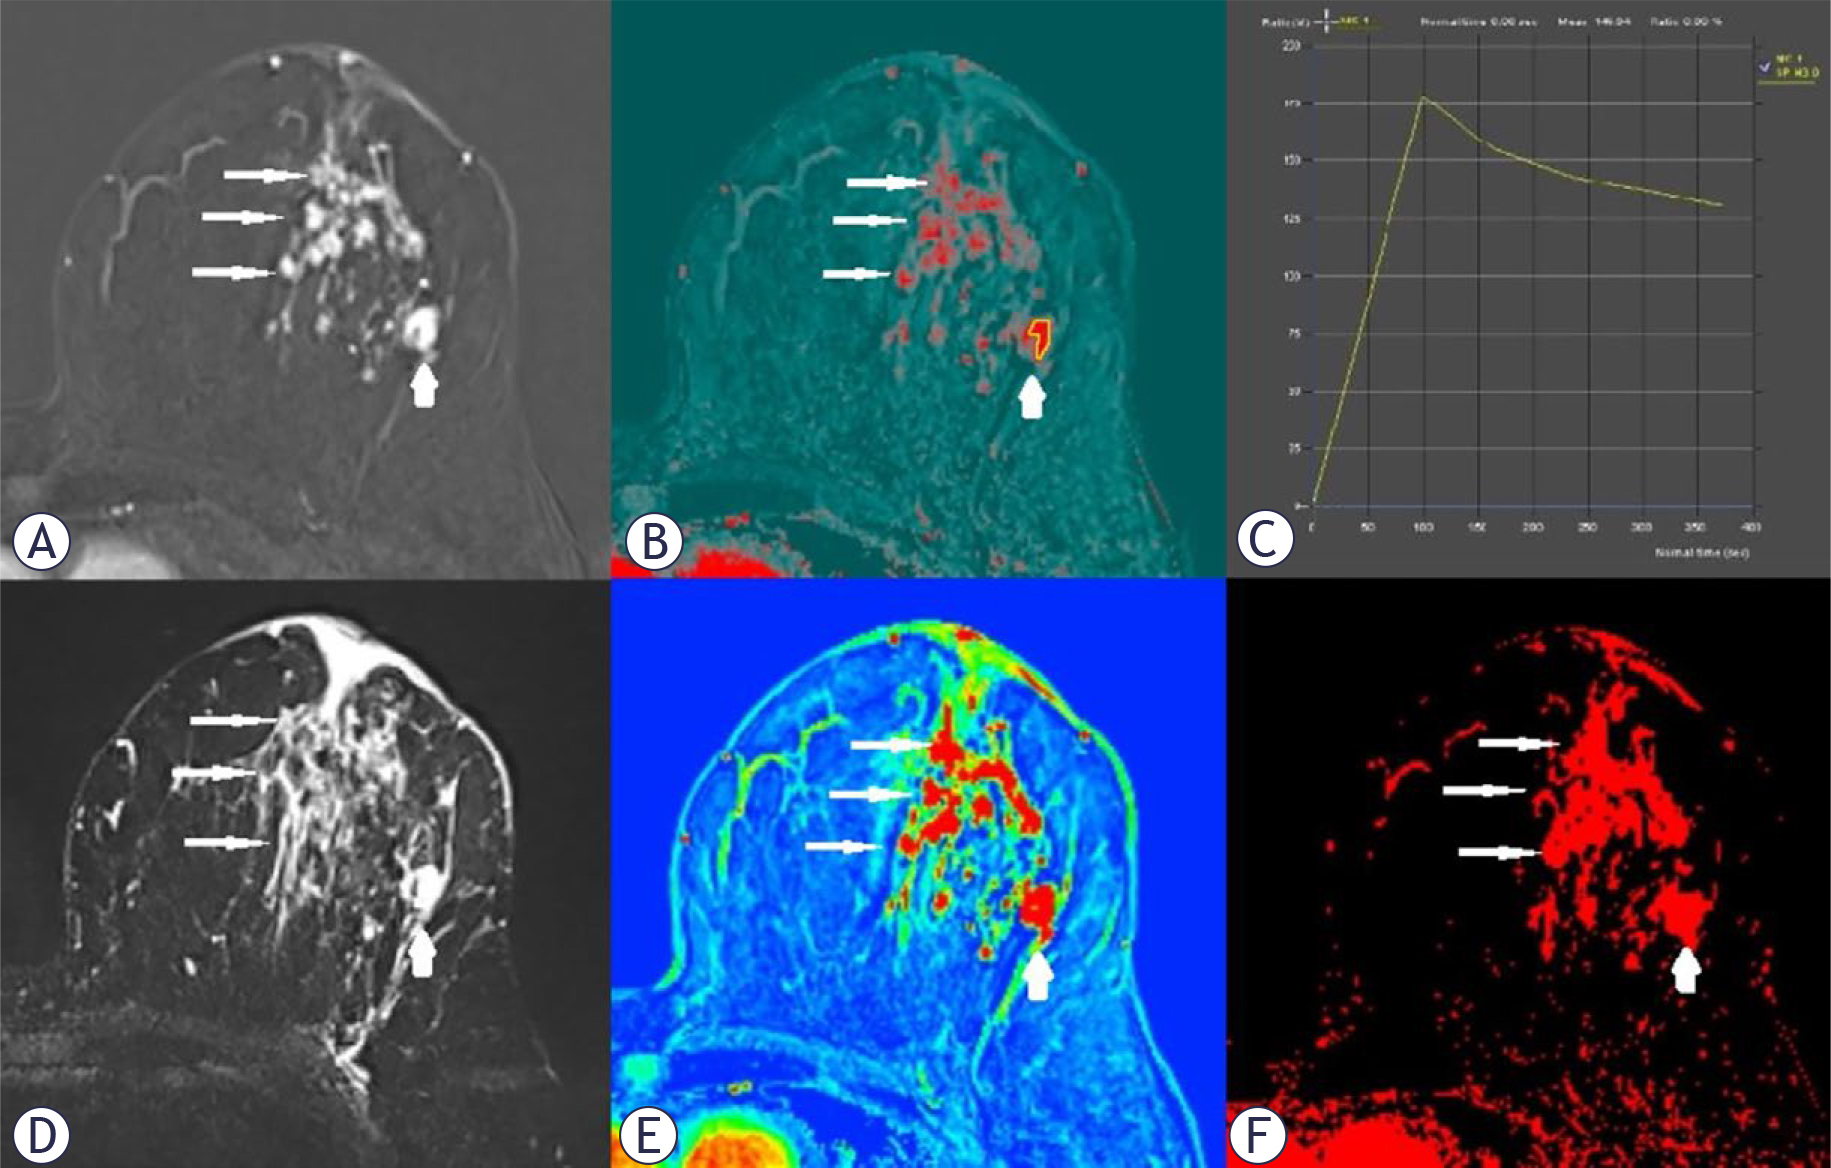
FIGURE 2.
A 56-year-old woman with biopsy-proven ductal carcinoma in situ (DCIS) presenting as segmental non-mass enhancement (NME) (thin arrows) with an associated irregular mass in the inner quadrants (thick arrow) on breast dynamic contrast-enhanced magnetic resonance imaging (DCE-MRI). The upper row shows the dynamic contrast-enhanced study: subtracted postcontrast image demonstrating the extent of NME and the associated irregular mass (A), wash-in parametric map (B), and time-intensity curve (TIC) analysis (C). On the wash-in map, the freehand region of interest (ROI) was placed over the irregular mass, which represented the fastest enhancing part of the lesion and corresponded to the area with the highest signal intensity (thick arrow). TIC analysis demonstrated fast initial enhancement and washout delayed-phase kinetics, corresponding to type 3 kinetics. The lower row shows the corresponding turbo inversion recovery magnitude (TIRM) image, where the lesion appears conspicuously hyperintense (D), positive enhancement integral (PEI) map (E), and time to peak (TTP) map (F), illustrating the semi-quantitative parameters used for lesion assessment. Final postoperative histopathology revealed DCIS with an associated invasive carcinoma (IC).
TABLE 1.
Comparison of findings between patients with and without invasive carcinoma
| Without IC (n = 55) | With IC (n = 35) | p-value | |
|---|---|---|---|
| Age | 55.29 ± 11.13 | 51.91 ± 9.42 | 0.141 |
| Type of biopsy | |||
| CNB | 19 (34.5%) | 17 (48.6%) | 0.256 |
| SVAB/DBT-VAB | 34 (61.8%) | 18 (51.4%) | |
| MR-VAB | 2 (3.6%) | 0 | |
| DCE-MRI lesion type | |||
| NME | 45 (81.8%) | 14 (40%) | < 0.001* |
| Mass | 6 (10.9%) | 6 (17.1%) | |
| NME + mass | 4 (7.3%) | 15 (42.9%) | |
| Lesion size (mm) | 25 (52) | 48 (46) | 0.015* |
| Multifocality/multicentricity | |||
| No | 37 (67.3%) | 10 (28.6%) | < 0.001* |
| Yes | 18 (32.7%) | 25 (71.4%) | |
| Wash-in | |||
| Slow | 13 (23.6%) | 3 (8.6%) | < 0.001* |
| Medium | 18 (32.7%) | 2 (5.7%) | |
| Fast | 24 (43.6%) | 30 (85.7% | |
| Peak enhancement (%) | 253.49 ± 168.06 | 343.14 ± 195.26 | 0,023* |
| Delayed phase | |||
| Persistent | 34 (61.8%) | 5 (14.3%) | < 0.001* |
| Plateau | 14 (25.5%) | 16 (45.7%) | |
| Washout | 7 (12.7%) | 14 (40%) | |
| T2W TSE | |||
| Hypointense | 19 (34.5%) | 8 (22.9%) | 0.023* |
| Isointense | 32 (58.2%) | 17 (48.6%) | |
| Hyperintense | 4 (7.3%) | 10 (28.6%) | |
| TIRM | |||
| Hypointense | 14 (25.5%) | 6 (17.1%) | 0.003* |
| Isointense | 23 (41.8%) | 5 (14.3%) | |
| Hyperintense | 18 (32.7%) | 24 (68.6%) | |
| PEI | 988 (733) | 1391 (1307) | 0.009* |
| PEI L/NP | 10.83 (7.61) | 11 (11.92) | 0.493 |
| TTP | 470 (343) | 359 (182) | 0.003* |
[i] CNB = core-needle biopsy; DBT-VAB = digital breast tomosynthesis-guided vacuum-assisted biopsy; DCE-MRI = dynamic contrast-enhanced magnetic resonance imaging; IC = invasive carcinoma; L/NP = lesion-to-normal parenchyma; MR-VAB = magnetic resonance-guided vacuum-assisted biopsy; NME = non-mass enhancement; PEI = positive enhancement integral; SVAB = stereotactic vacuum-assisted biopsy; T2W TSE = T2-weighted turbo-spin-echo; TIRM = turbo inversion recovery magnitude; TTP = time to peak.
TABLE 2.
Multivariate regression analysis with independent predictors of invasive carcinoma
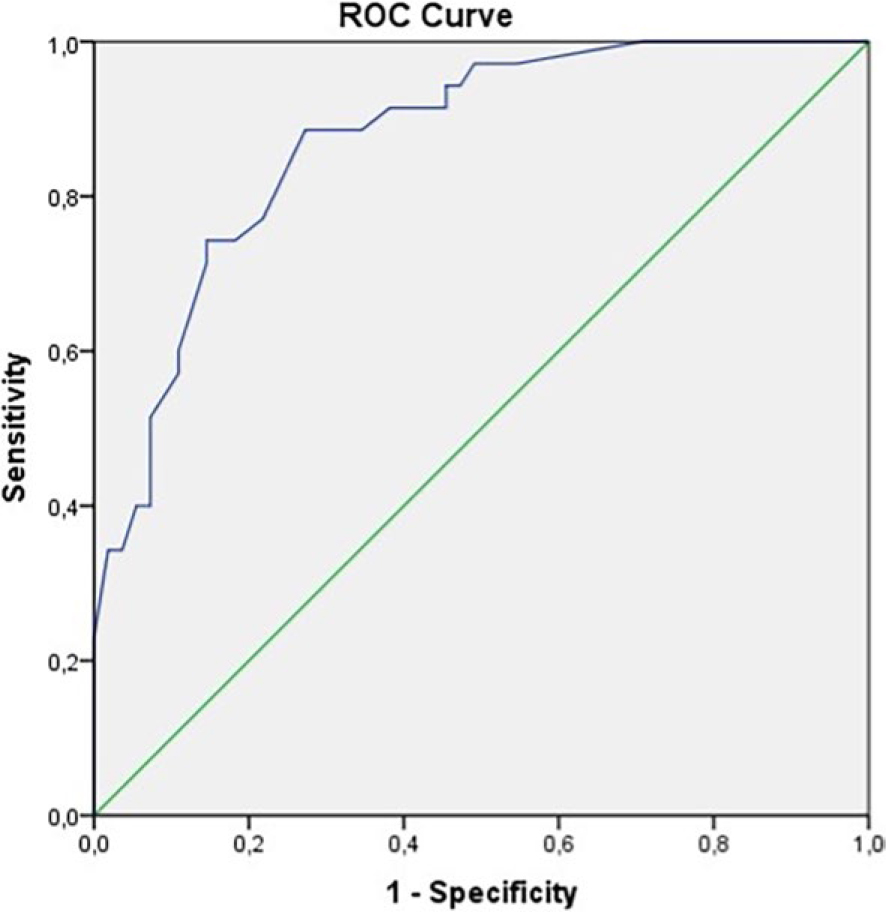
FIGURE 3.
Receiver operating characteristic (ROC) curve for the multivariate regression model (area under the curve [AUC] = 0.872).