
TABLE 1.
Clinical and radiological characteristics of the cohort
| Variable | n (189) | %/Median (IQR) |
|---|---|---|
| Age (years) | 58 (48-68) | — |
| Family history of cancer | ||
| Yes | 42 | 22.22 |
| No | 140 | 74.07 |
| Not declared | 7 | 3.70 |
| Lesion laterality | ||
| Right | 83 | 43.90 |
| Center | 106 | 56.10 |
| Previous mammography | 189 | |
| Yes | 134 | 70.90 |
| No | 55 | 29.10 |
| Ultrasound BI-RADS category | ||
| 4A | 21 | 11.10 |
| 4B | 70 | 37.00 |
| 4C | 16 | 8.50 |
| 5 | 82 | 43.40 |
| Ultrasound tumor size (mm) | 20 (17-28) | — |
| Lesion depth | 16 (12-20) | |
| Elasticity index | 2.57 (2-3) | — |
| Shear-Wave Elastography (SWE, kPa) | 54 (49-59) | — |
| Histopathological diagnosis | 85 | |
| Malignant | 54 | 63.50 |
| Benign | 31 | 36.50 |
| Breast cancer subtype | n = 35 | |
| Luminal A | 7 | 20.00 |
| Luminal B | 22 | 62.90 |
| HER2-positive | 4 | 11.40 |
| Triple negative | 2 | 5.70 |
| Histological grade | 2 (2-3) | — |
TABLE 2.
Spearman’s Rho correlation between lesion characteristics and elastography measurements
| Rho de Spearman | Elasticity index | SWE (kPa) | ||
|---|---|---|---|---|
| Lesion size (mm) | Spearman’s ρ | 1.000 | 0.226 | 0.250 |
| p - value | 0.002 | 0.001 | ||
| N | 189 | 188 | 189 | |
| Lesion depth | Spearman’s ρ | 1.000 | -0.037 | 0.102 |
| p - value | 0.622 | 0.176 | ||
| N | 177 | 176 | 177 |
TABLE 3.
Comparison of elastography values according to histopathological diagnosis
| Histopathological Diagnosis | |||
|---|---|---|---|
| Benign (n = 31) Median; [Q1-Q3] | Malignant (n = 54) Median; [Q1-Q3] | p value | |
| Elasticity index | 1.9; [1.4–2.5] | 2.5; [2–2.8] | 0.001 |
| Shear-Wave Elastography (SWE, kPa) | 43; [36–49] | 53; [48–59] | 0.000 |
TABLE 4.
Relationship between BI-RADS category and elastography measurements
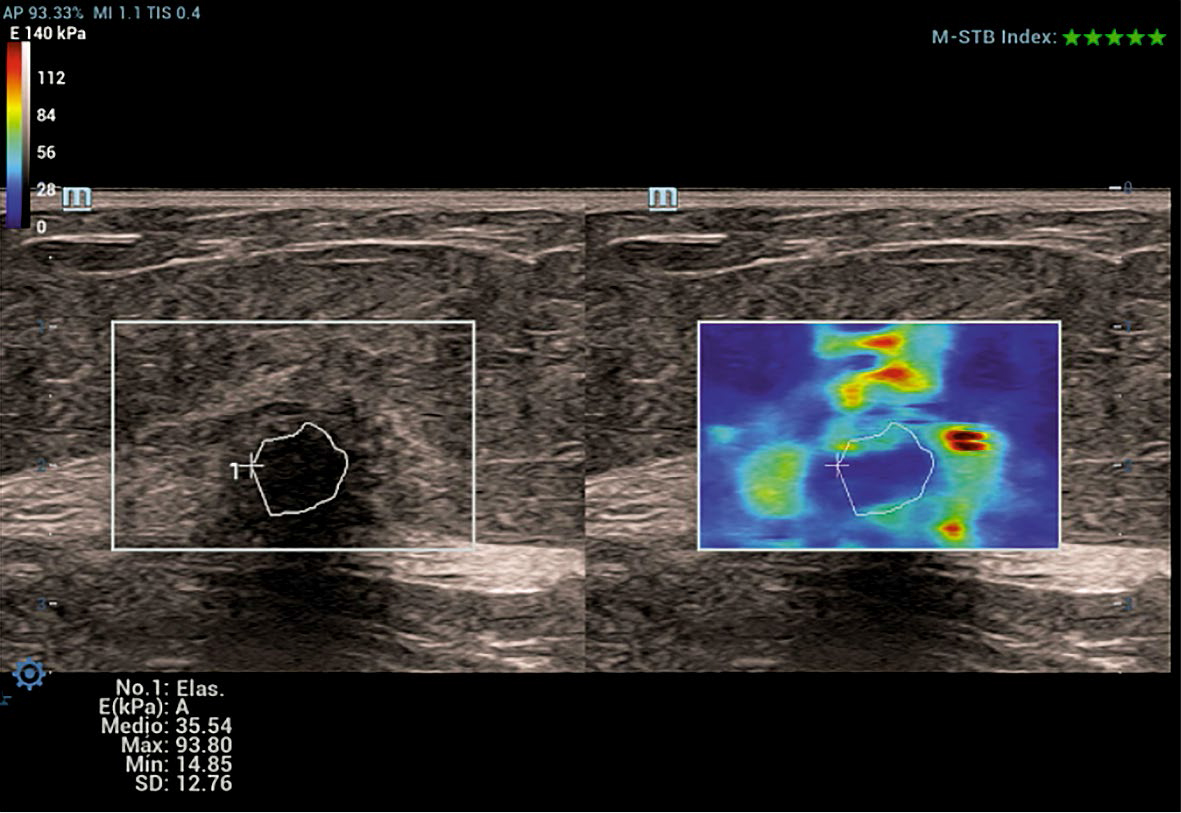
FIGURE 1.
Representative shear-wave elastography image of a BI-RADS 4B breast lesion.
Grayscale ultrasound image (left) and corresponding shear-wave elastography map (right) of a BI-RADS 4B breast lesion. The region of interest (ROI) is manually traced along the lesion margins on B-mode imaging. The elastography map shows intermediate stiffness with focal areas of increased rigidity surrounding the lesion, depicted by green to yellow colour coding, without the marked high-stiffness dominance seen in higher-suspicion categories. Quantitative measurements demonstrate a moderate mean SWE value (Emean ≈ 35.5 kPa), illustrating the role of SWE in refining risk stratification within intermediate-suspicion BI-RADS subcategories. Individual SWE values may vary within BI-RADS subcategories; this representative BI-RADS 4B case illustrates moderate mean stiffness with focal areas of increased rigidity, consistent with the heterogeneous nature of this category.
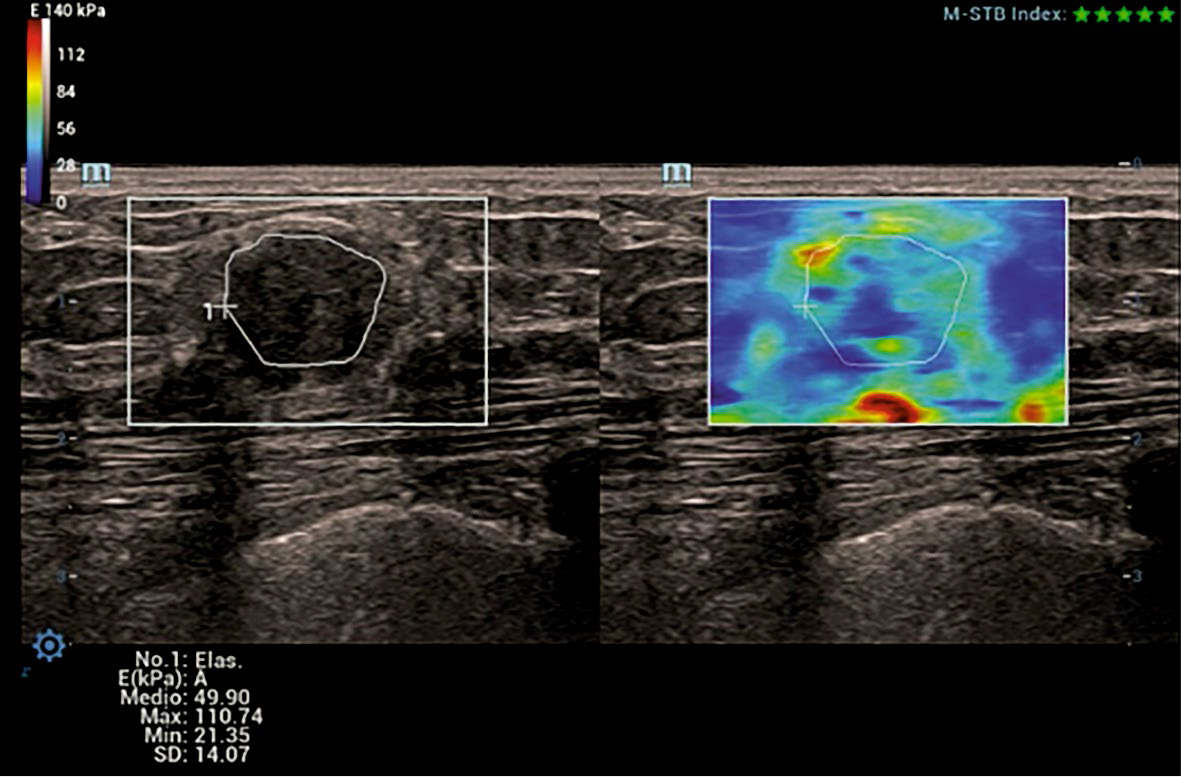
FIGURE 2.
Representative shear-wave elastography image of a BI-RADS 4C breast lesion.
Grayscale ultrasound (left) and corresponding shear-wave elastography (right) of a BI-RADS 4C breast lesion. The region of interest (ROI) is manually delineated along the lesion margins. The elastography map demonstrates marked stiffness heterogeneity with focal areas of increased rigidity (red–orange colour scale). Quantitative measurements show an elevated mean SWE value (Emean ≈ 49.9 kPa) and high maximum stiffness, findings consistent with a high suspicion for malignancy and illustrating the added diagnostic value of SWE in advanced BI-RADS subcategories.
TABLE 5.
Elastography measurements according to BI-RADS 4A and 4B subcategories
| Parameter | BI-RADS 4a Median [Q1-Q3] | BI-RADS 4b Median [Q1-Q3] | p value* |
|---|---|---|---|
| Shear-Wave Elastography (SWE), kPa | 38.0 [29.5–39.5] | 45.0 [39.0–50.0] | < 0.001 |
| Elastography Index | 1.60 [1.20–2.05] | 1.90 [1.50–2.20] | 0.030 |
TABLE 6.
Spearman correlation between tumor size and elastography parameters
| Parameter | Spearman’s ρ | p value | R2 (%) |
|---|---|---|---|
| Elastography Index | 0.226 | 0.002 | 5.1 |
| Shear-Wave Elastography (SWE, kPa) | 0.250 | 0.001 | 6.3 |
TABLE 7.
Binary logistic regression for predictors of malignancy
| Parameter | B | p value | ORc (95% CI) | p value | ORa (95% CI) |
|---|---|---|---|---|---|
| Age (years) | 0.110 | < 0.001 | 1.117 (1.060–1.176) | 0.004 | 1.108 (1.033–1.187) |
| Tumor size (mm) | –0.025 | 0.074 | 0.976 (0.949–1.002) | 0.122 | 0.967 (0.928–1.009) |
| Shear-Wave left | 0.102 | < 0.001 | 1.107 (1.047–1.171) | 0.793 | 0.846 (0.242–2.958) |
| Elastography Index | 1.278 | 0.001 | 3.588 (1.648–7.813) | 0.106 | 1.085 (0.983–1.198) |
| Ultrasound BI-RADS | 1.459 | < 0.001 | 4.304 (2.411–7.683) | 0.007 | 2.932 (1.343–6.400) |
TABLE 8.
Binary logistic regression model using clinically selected variables
| Parameter | B | p value | Adjusted OR (ORa) | 95% CI (Lower) | 95% CI (Upper) |
|---|---|---|---|---|---|
| Age (years) | 0.110 | < 0.001 | 1.117 | 1.054 | 1.783 |
| Elastography Index | 0.422 | 0.435 | 1.524 | 0.530 | 4.389 |
| SWE (kPa) | 0.094 | 0.016 | 1.099 | 1.017 | 1.186 |
TABLE 9.
Binary logistic regression model excluding age
| Parameter | B | p value | Adjusted OR (ORa) | 95% CI (Lower) | 95% CI (Upper) |
|---|---|---|---|---|---|
| Elastography Index | 0.671 | 0.117 | 1.955 | 0.846 | 4.521 |
| SWE (kPa) | 0.079 | 0.011 | 1.082 | 1.018 | 1.150 |
TABLE 10.
Area under the ROC curve (AUC) for elastography parameters
| Parameter | AUC | SE | p value* | 95% CI (Lower-Upper) |
|---|---|---|---|---|
| Elastog raphy Index | 0.725 | 0.059 | 0.001 | 0.610-0.840 |
| SWE (kPa) | 0.768 | 0.056 | < 0.001 | 0.659-0.877 |
TABLE 11.
Bootstrap validation of optimal cut-off points for elastography parameters
| Method | Original cut-off | Bootstrap mean | Bootstrap 95% CI | Coefficient of Variation |
|---|---|---|---|---|
| SWE (kPa) | 47.5 | 47.49 | 40.5-51.5 | 4.7% |
| Elastography Index | 2.25 | 2.054 | 1.6-2.367 | 13.0% |
TABLE 12.
Diagnostic performance of elastography parameters
| SWE | Diagnostic | Sensitivity (%) | Specificity (%) | PPV(%) | N PV(%) | |
|---|---|---|---|---|---|---|
| Malignant (n = 54) | Benign (n = 31) | |||||
| ≥ 47.50 kPa | 43 | 10 | 79.6 | 67.7 | 81.1 | 65.6 |
| < 47.50 kPa | 11 | 21 | ||||
| Elasticity index | ||||||
| ≥ 2.25 | 36 | 9 | 66.7 | 71.0 | 80.0 | 55.0 |
| < 2.25 | 18 | 22 | ||||
| Total | 54 | 31 | ||||
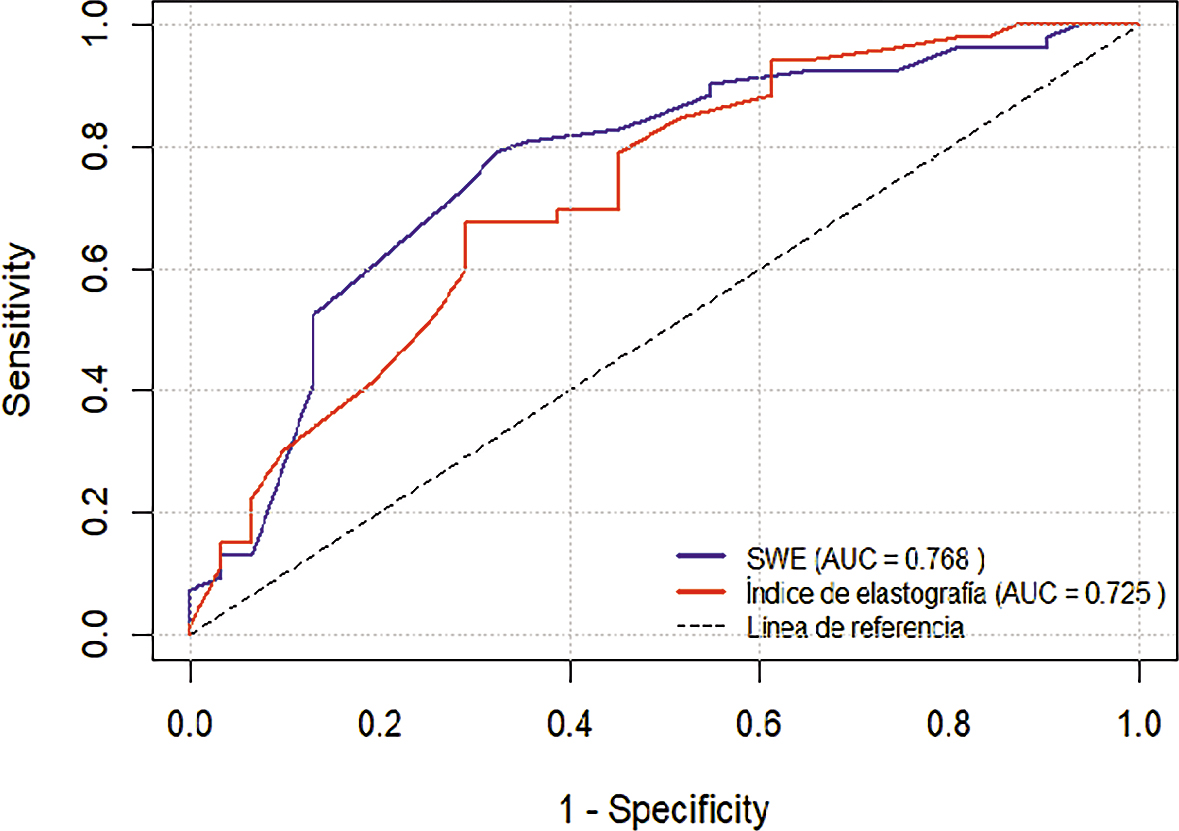
FIGURE 3.
Receiver operating characteristic (ROC) curves for shear wave elastography (SWE) and the elastography index.
ROC curves comparing the diagnostic performance of SWE (blue line) and the elastography index (red line) for distinguishing malignant from benign breast lesions. The diagonal dashed line represents the reference line of no discrimination. Both parameters demonstrated discriminative ability above chance, with SWE showing a greater area under the curve (AUC = 0.768) than the elastography index (AUC = 0.725), indicating superior overall diagnostic performance.