
FIGURE 1.
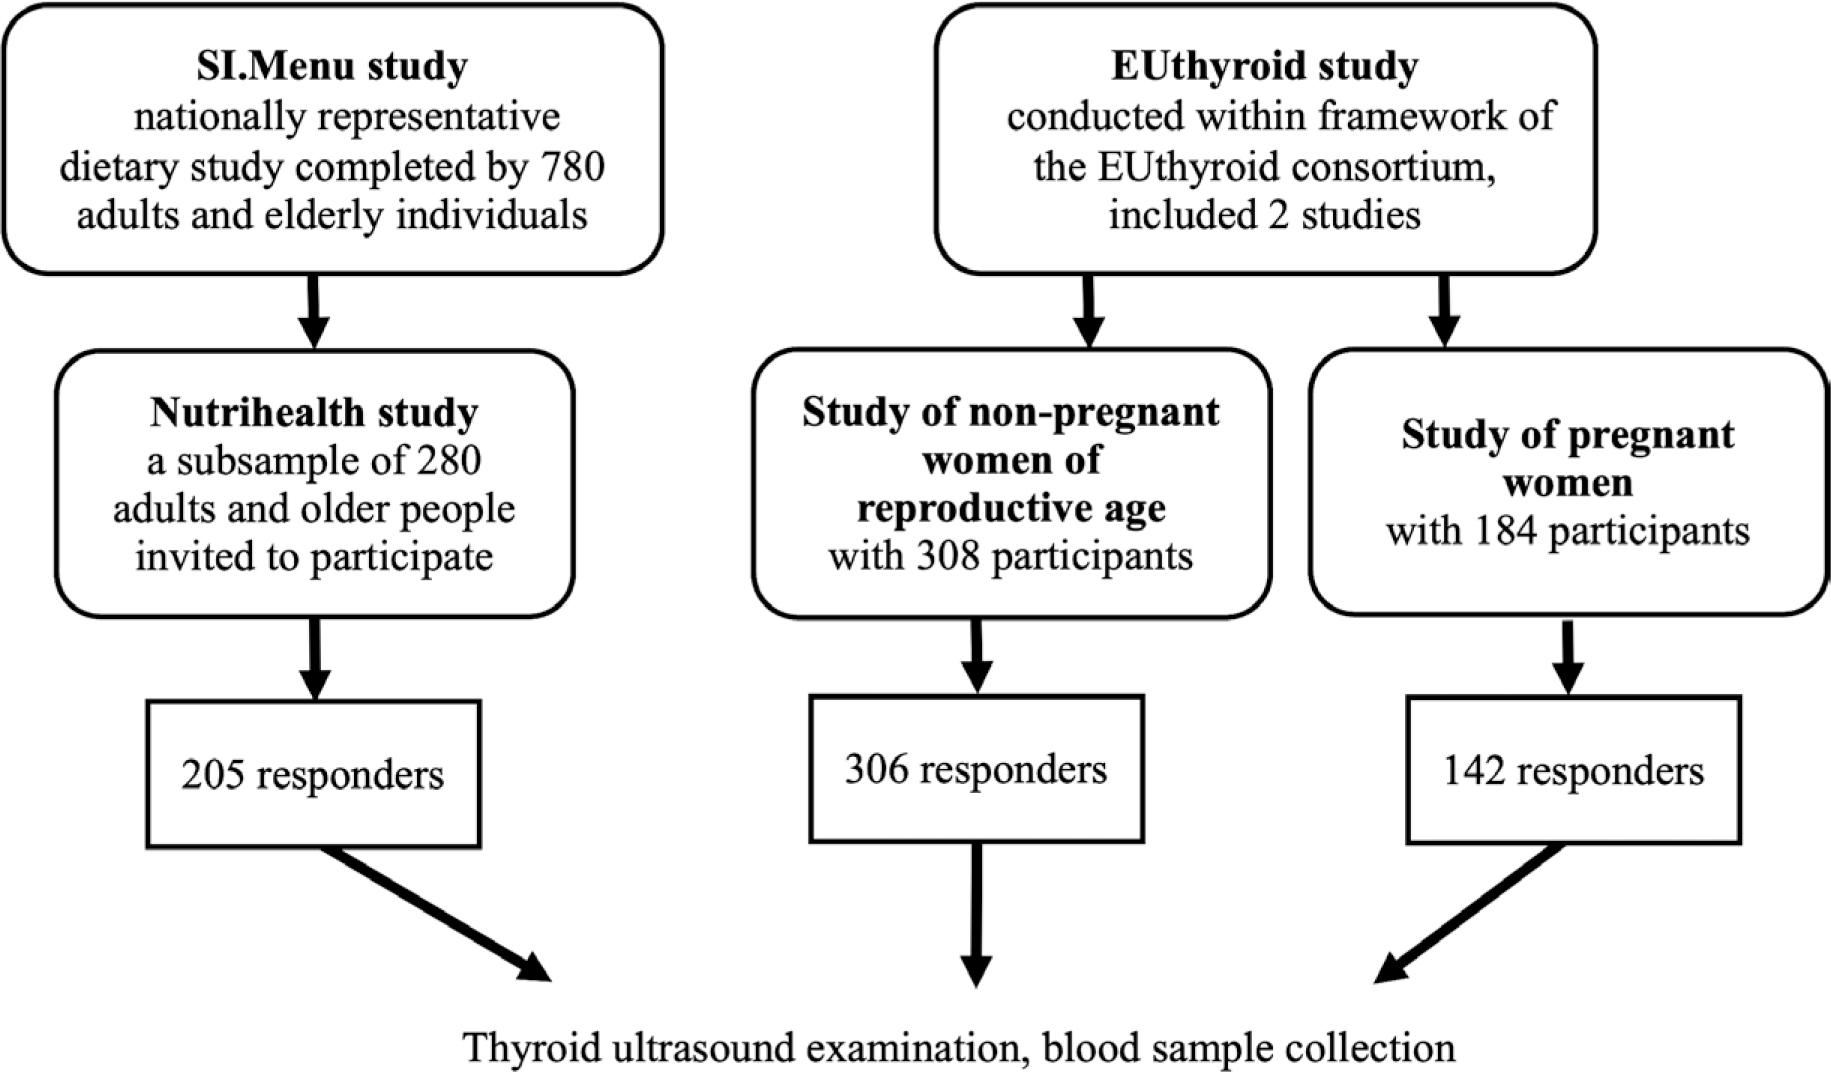
FIGURE 2.
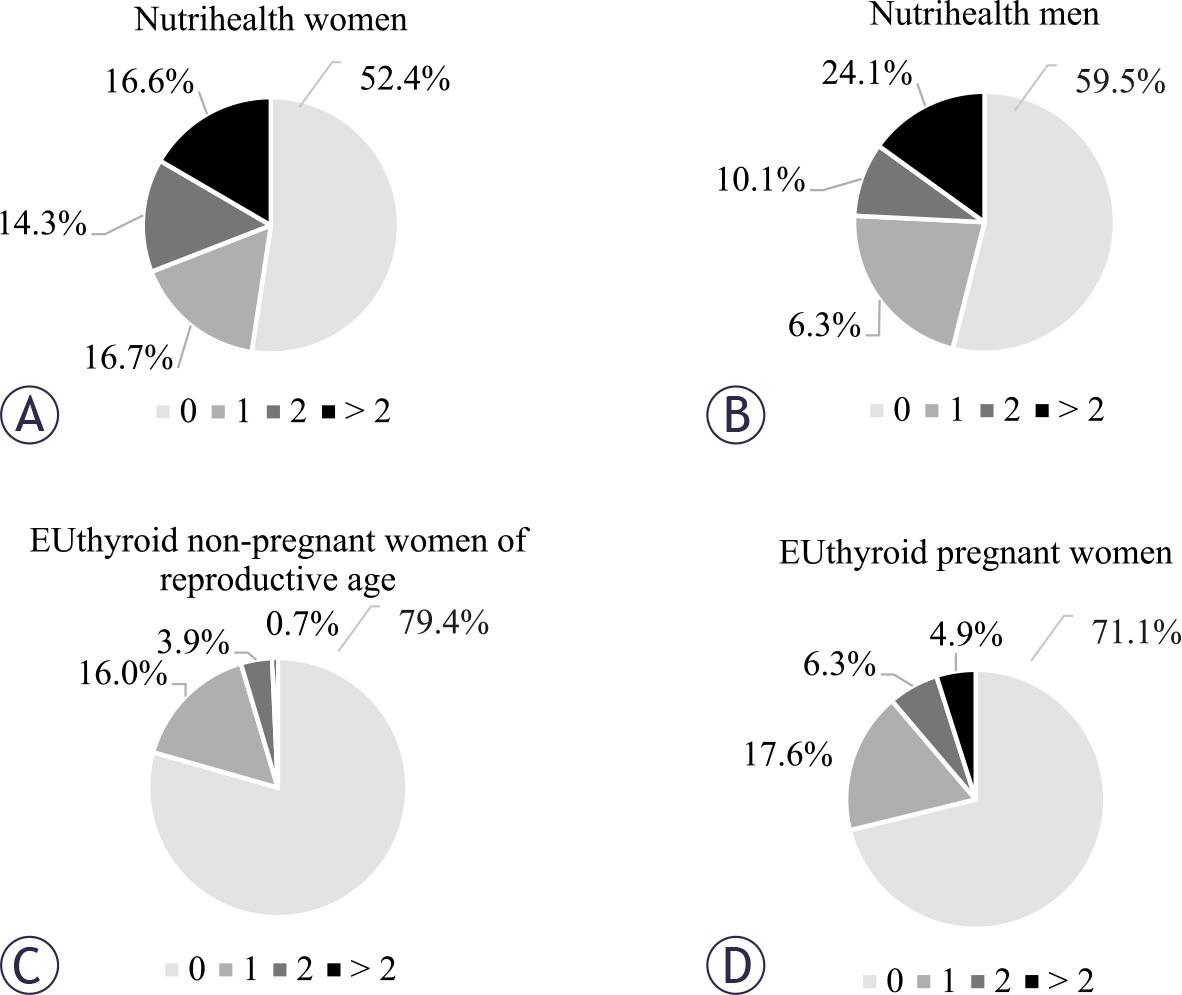
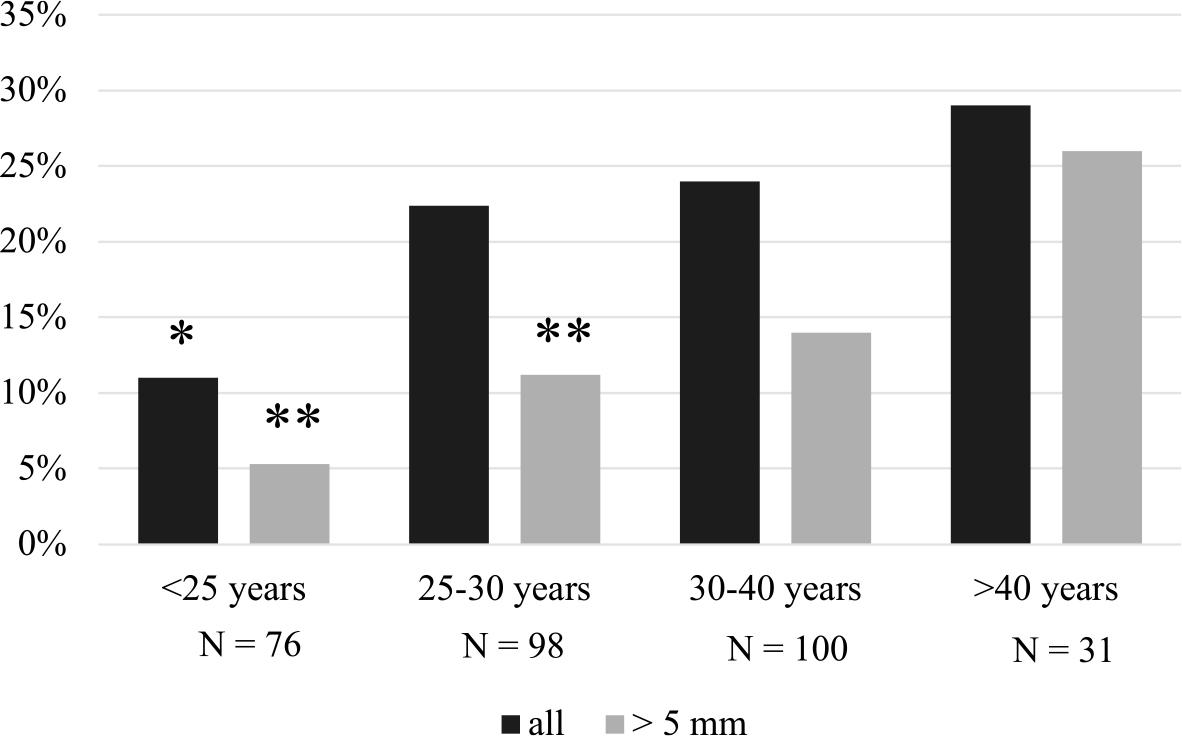
FIGURE 3.
Correlation of thyroid volume with age, body mass index (BMI), nodule characteristics, and thyroid-stimulating hormone (TSH)
| Nutrihealth women N = 126 | Nutrihealth man N = 79 | EUthyroid women of reproductive age N = 305 | EUthyroid pregnant women N = 142 | |||||
|---|---|---|---|---|---|---|---|---|
| rho | p-value | rho | p-value | rho | p-value | rho | p-value | |
| Age | 0.100 | 0.266 | -0.065 | 0.569 | 0.134 | 0.019 | 0.101 | 0.231 |
| BMI | -0.011 | 0.911 | 0.242 | 0.039 | n.a. | n.a. | 0.404 | 0.001 |
| Number of nodules | 0.416 | < 0.001 | 0.337 | 0.002 | 0.116 | 0.042 | 0.185 | 0.028 |
| Number of nodules > 5 mm | 0.416 | < 0.001 | 0.320 | 0.004 | 0.156 | 0.006 | 0.290 | < 0.001 |
| Volume of dominant nodule | 0.390 | 0.004 | 0.553 | 0.002 | 0.059 | 0.727 | 0.251 | 0.217 |
| TSH | -0.269 | 0.005 | -0.509 | < 0.001 | -0.151 | 0.008 | -0.255 | 0.002 |
Clinical characteristics of nationally representativo Nutrihealth study group
| All N = 205 | Women N = 126 (61.5%) | Men N = 79 (38.5%) | p-value | |
|---|---|---|---|---|
| Age, years (median, range) | 62 (18–74) | 60 (20–74) | 64 (18–74) | 0.177 |
| BMI, kg/m2 (median, range) | 26.3 (17.9–43.4) | 25.5 (17.9–43.4) | 26.8 (18.2–41.7) | 0.088 |
| Thyroid volume, mL (median, range) | 8.15 (2.0–46.7) | 6.8 (2.0–46.7) | 10.8 (2.0–28.4) | <0.001 |
| Proportion of subjects with nodules (number, %) | 92 (44.9) | 60 (47.6) | 32 (40.5) | 0.069 |
| Proportion of subjects with nodules > 5 mm (number, %) | 80 (39.0) | 52 (41.3) | 28 (35.4) | 0.058 |
| Proportion of subjects with nodules > 0.5 mL (number, %) | 26* (13.7) | 18* (14.3) | 8* (10.1) | 0.385 |
| Number of nodules per person with nodules (mean, range) | 2.3 (1–6) | 2.5 (1–6) | 1.8 (1–6) | 0.017 |
| Dominant nodule volume, mL (median, range) | 0.28 (0.02–19.00) | 0.30 (0.02–19.00) | 0.19 (0.02–17.20) | 0.785 |
| TSH, mIU/L (median, range) | 8.15 (2.0–46.7) | 2.04 (0.13–9.52) | 1.88 (0.26–5.39) | 0.056 |
Clinical characteristics of EUthyroid study group
| All N = 448 | Women of reproductive age N = 305 (68.0%) | Pregnant women N = 142 (32.0%) | p-value | |
|---|---|---|---|---|
| Age, years (median, range) | 30 (19–56) | 27 (19–49) | 33 (20–46) | < 0.001 |
| Thyroid volume, mL (median, range) | 7.4 (2.5–30.5) | 7.3 (2.5–16.6) | 7.4 (3.3–30.5) | 0.417 |
| Proportion of all women with nodules (number, %) | 101 (22.5) | 60 (19.7) | 41 (28.9) | 0.031 |
| Proportion of women with nodules > 5 mm (number, %) | 63** (14.1) | 37** (12.1) | 26** (18.3) | 0.082 |
| Proportion of women with nodules > 0.5 mL (number, %) | 9* (2.0) | 3* (1.0) | 6* (4.2) | 0.023 |
| Number of nodules per person with nodules (mean, range) | 1.5 (1–6) | 1.3 (1–4) | 1.8 (1–6) | 0.036 |
| Dominant nodule volume, mL (median, range) | 0.09 (0.02–3.83) | 0.08 (0.02–2.46) | 0.12 (0.03–3.83) | 0.084 |
| TSH, mU/L (median, range) | 1.55 (0.27–116.90) | 1.61 (0.32–116.90) | 1.46 (1.48–4.38) | < 0.001 |