
FIGURE 1.
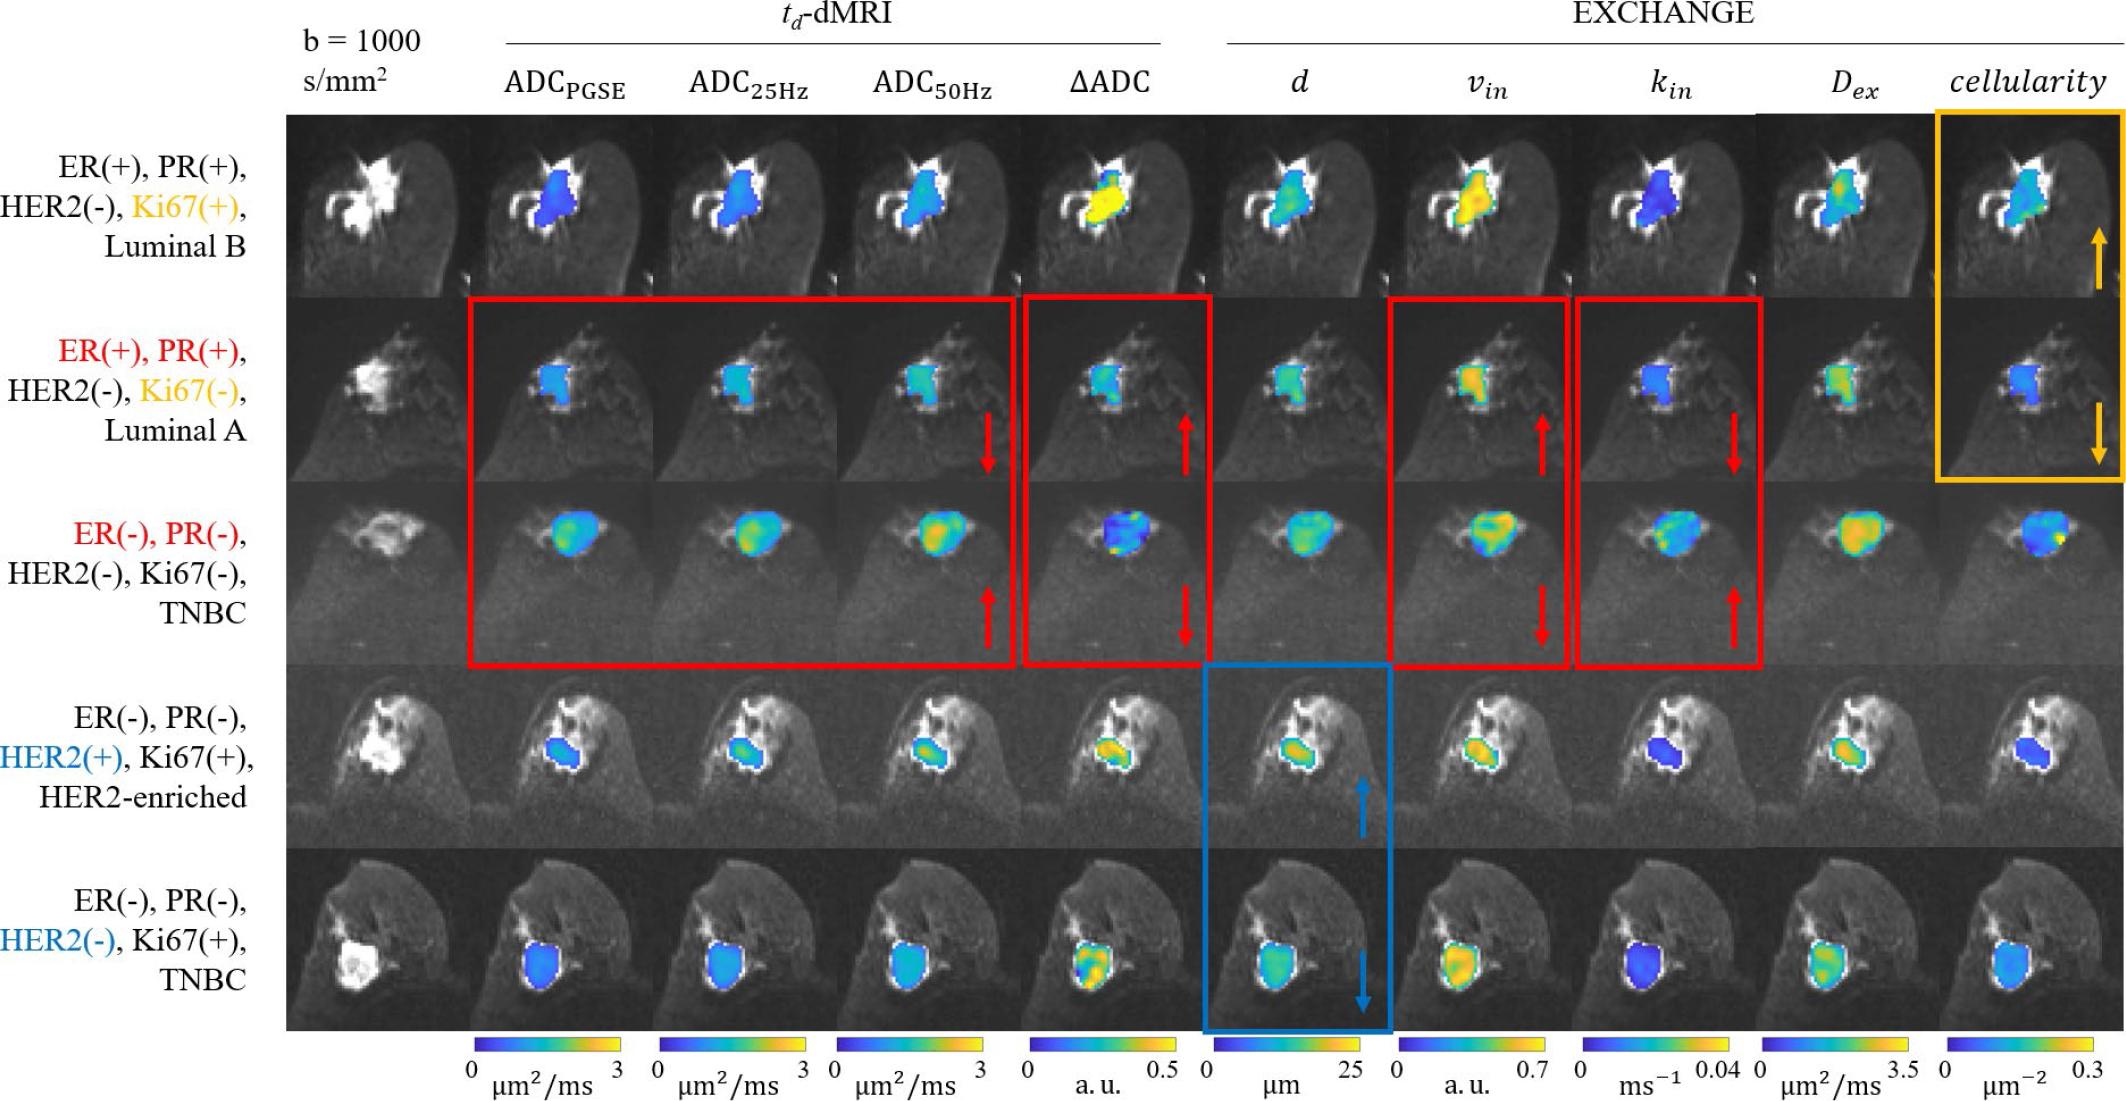
FIGURE 2.
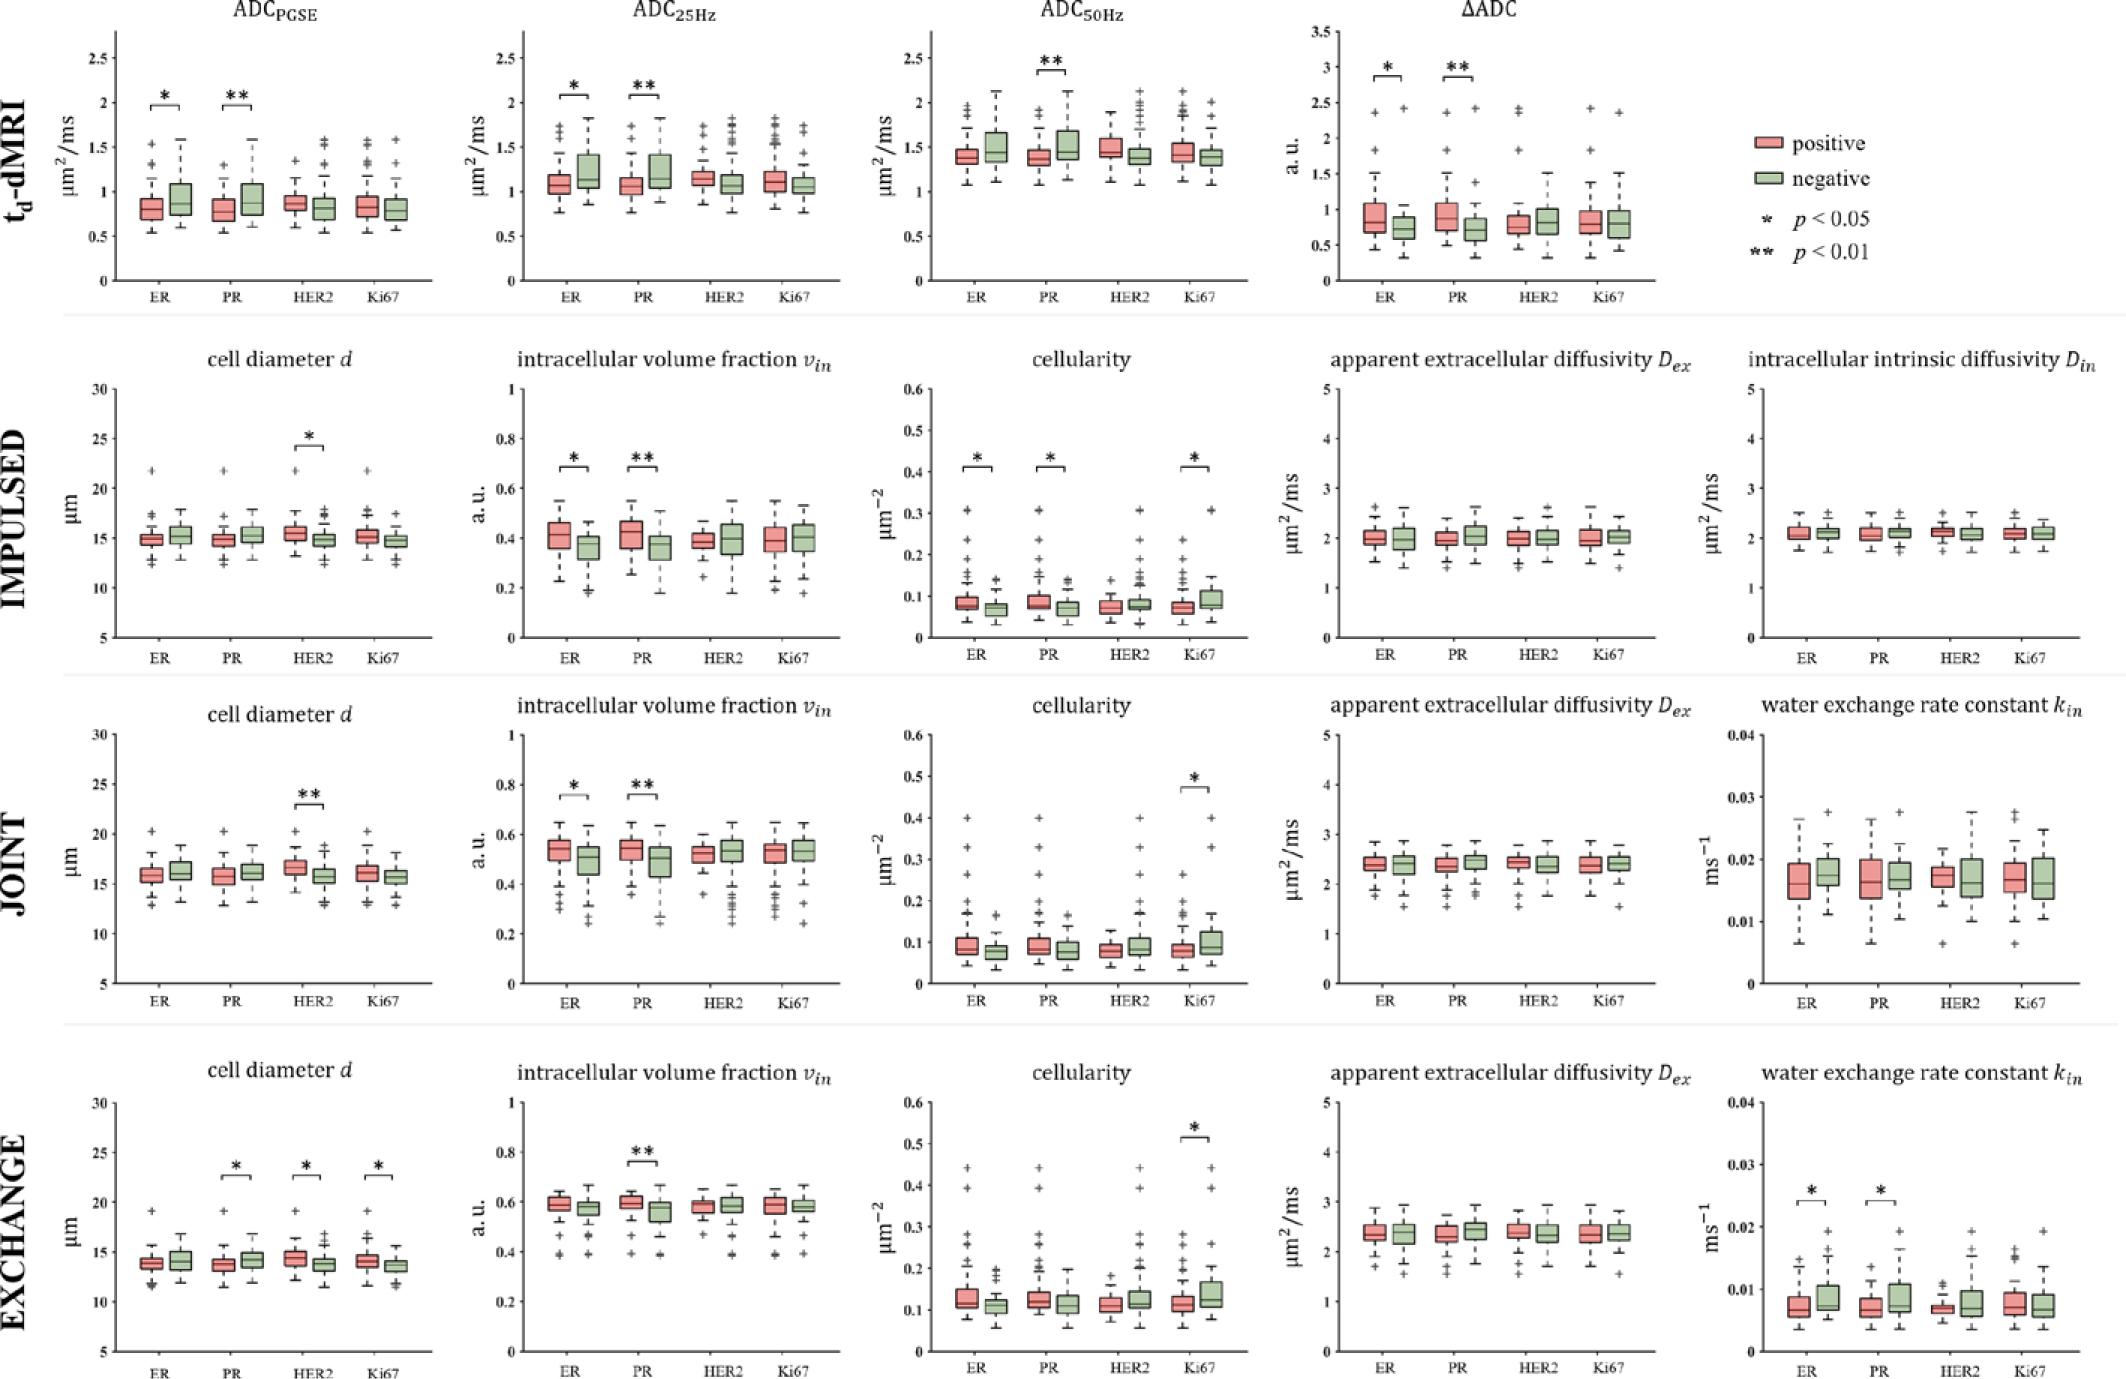
FIGURE 3.
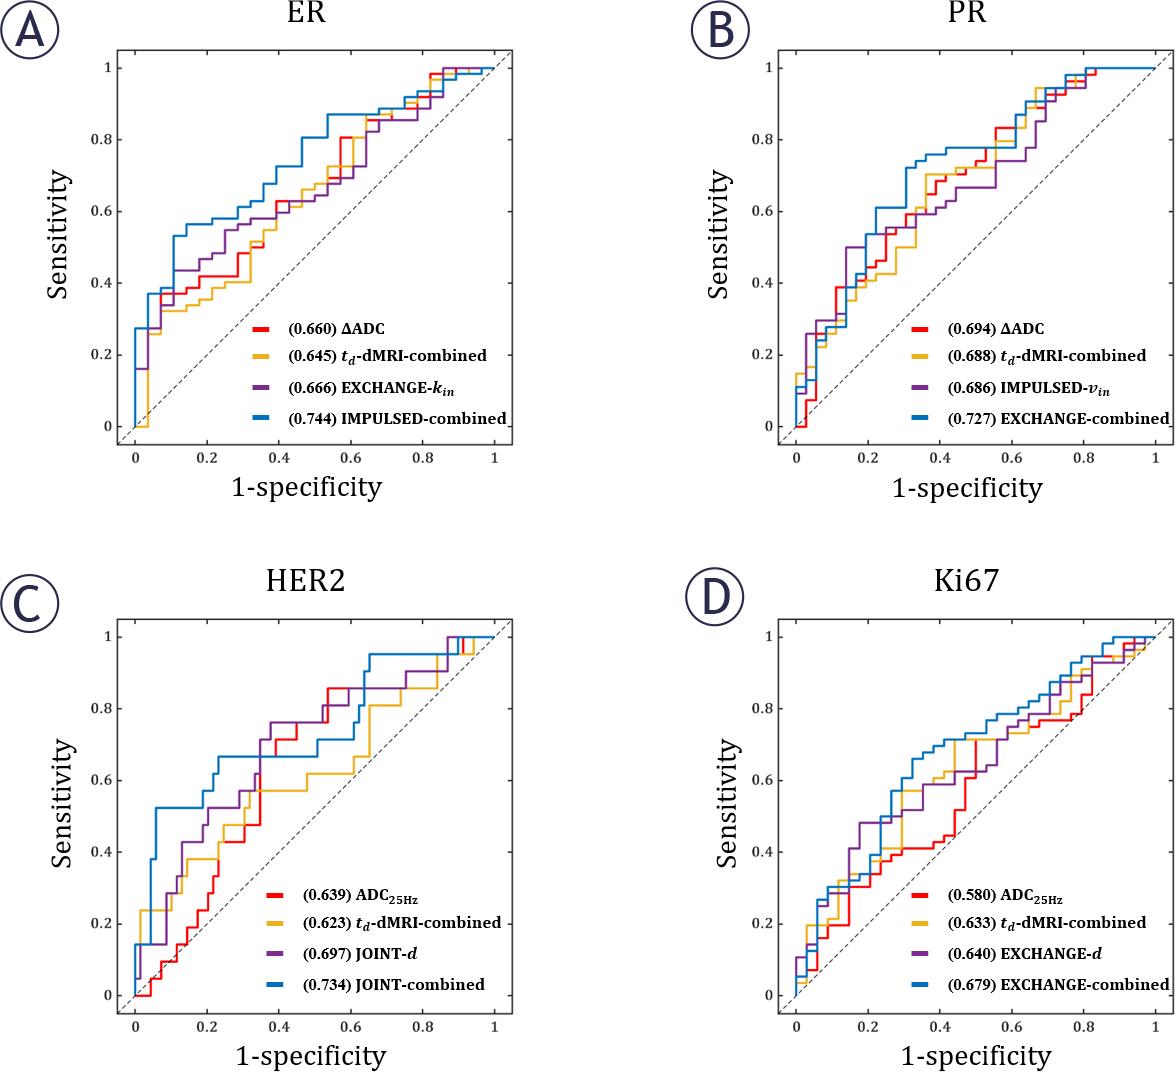
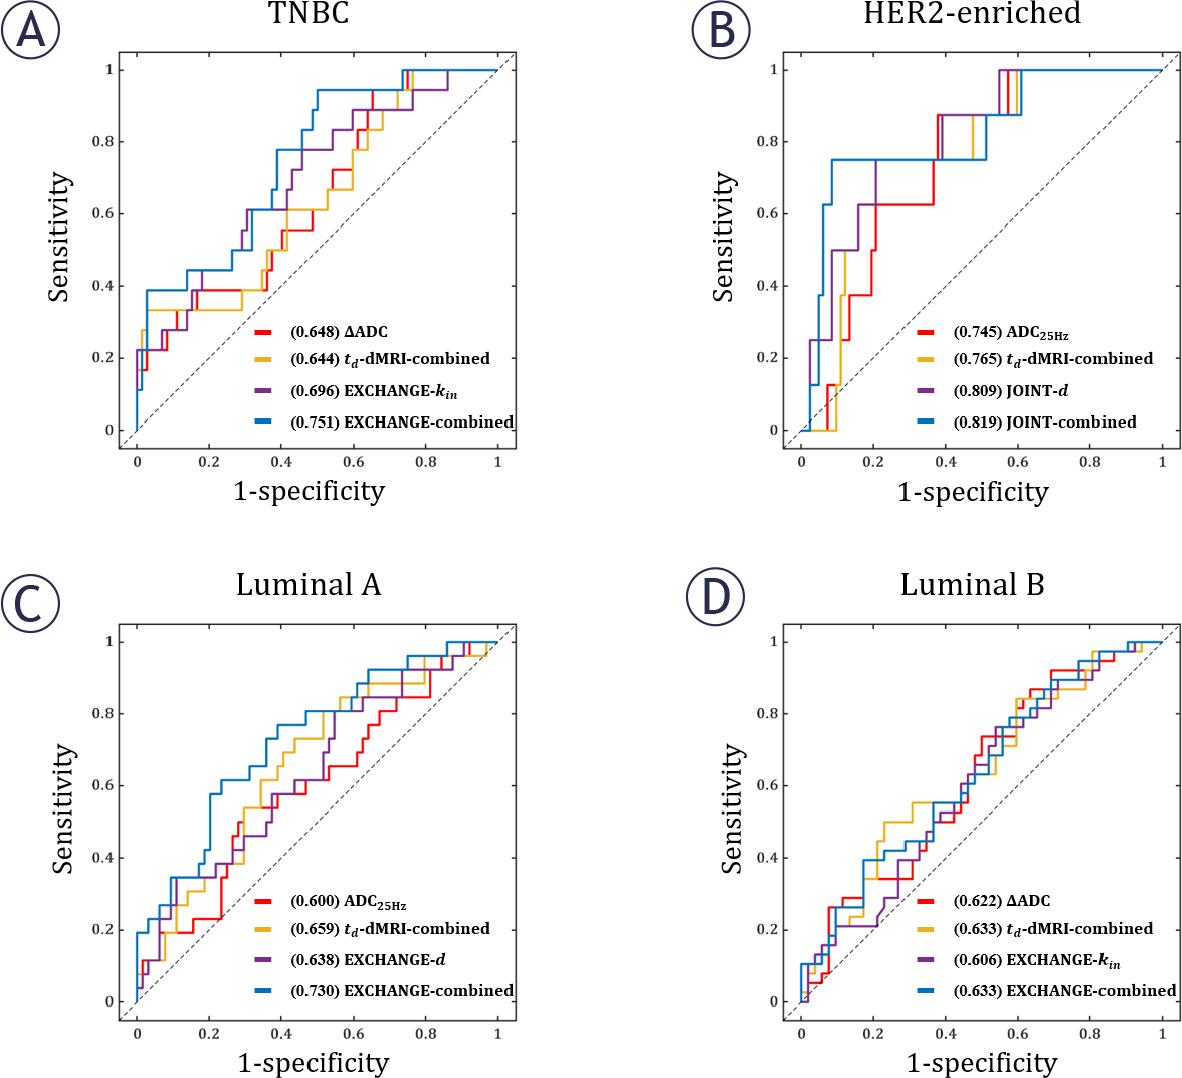
Figure 4.
The diagnostic performance of imaging metrics for the prediction of immunohistochemistry (IHC) factor status
| Model | Parameter | AUC (ER) | AUC (PR) | AUC (HER2) | AUC (Ki67) |
|---|---|---|---|---|---|
| td-dMRI | ADCPGSE | 0.631 (0.508, 0.755) | 0.693 (0.584, 0.803) | 0.594 (0.470, 0.718) | 0.553 (0.427, 0.678) |
| ADC25Hz | 0.630 (0.508, 0.752) | 0.682 (0.571, 0.793) | 0.639 (0.055, 0.767) | 0.580 (0.458, 0.702) | |
| ADC50Hz | 0.624 (0.493, 0.755) | 0.674 (0.560, 0.788) | 0.627 (0.500, 0.755) | 0.571 (0.449, 0.693) | |
| ΔADC | 0.660 (0.540, 0.779) | 0.694 (0.583, 0.806) | 0.468 (0.328, 0.608) | 0.496 (0.369, 0.623) | |
| Combined | 0.645 (0.522, 0.768) | 0.688 (0.576, 0.800) | 0.623 (0.476, 0.770) | 0.633 (0.516, 0.750) | |
| IMPULSED | d | 0.590 (0.454, 0.726) | 0.621 (0.501, 0.742) | 0.652 (0.512, 0.793) | 0.612 (0.494, 0.730) |
| Vin | 0.664 (0.550, 0.779) | 0.686 (0.576, 0.796) | 0.554 (0.433, 0.675) | 0.545 (0.419, 0.670) | |
| Dex | 0.529 (0.389, 0.669) | 0.587 (0.461, 0.714) | 0.518 (0.337, 0.659) | 0.558 (0.438, 0.679) | |
| Din | 0.540 (0.407, 0.673) | 0.595 (0.473, 0.716) | 0.567 (0.433, 0.700) | 0.524 (0.399, 0.649) | |
| Cellularity | 0.646 (0.521, 0.771) | 0.638 (0.519, 0.758) | 0.567 (0.426, 0.708) | 0.638 (0.521, 0.754) | |
| Combined | 0.744 (0.641, 0.846) | 0.705 (0.597, 0.813) | 0.689 (0.552, 0.826) | 0.646 (0.532, 0.760) | |
| JOIN | d | 0.575 (0.443, 0.707) | 0.601 (0.481, 0.721) | 0.697 (0.567, 0.827) | 0.595 (0.476, 0.714) |
| vin | 0.643 (0.523, 0.764) | 0.673 (0.559, 0.787) | 0.453 (0.330, 0.577) | 0.517 (0.394, 0.641) | |
| kin | 0.623 (0.507, 0.740) | 0.535 (0.415, 0.655) | 0.459 (0.335, 0.583) | 0.520 (0.392, 0.649) | |
| Dex | 0.487 (0.351, 0.623) | 0.601 (0.478, 0.724) | 0.536 (0.399, 0.673) | 0.524 (0.403, 0.646) | |
| Cellularity | 0.619 (0.490, 0.747) | 0.613 (0.491, 0.736) | 0.577 (0.438, 0.716) | 0.632 (0.513, 0.750) | |
| Combined | 0.731 (0.625, 0.837) | 0.718 (0.609, 0.827) | 0.734 (0.601, 0.867) | 0.666 (0.552, 0.781) | |
| EXCHANGE | d | 0.584 (0.450, 0.718) | 0.624 (0.504, 0.744) | 0.650 (0.510, 0.790) | 0.640 (0.525, 0.755) |
| vin | 0.596 (0.466, 0.725) | 0.671 (0.555, 0.788) | 0.511 (0.380, 0.642) | 0.466 (0.343, 0.590) | |
| kin | 0.666 (0.552, 0.781) | 0.643 (0.526, 0.760) | 0.528 (0.407, 0.650) | 0.547 (0.420, 0.675) | |
| Dex | 0.521 (0.382, 0.661) | 0.608 (0.483, 0.732) | 0.562 (0.424, 0.699) | 0.522 (0.401, 0.643) | |
| Cellularity | 0.618 (0.490, 0.745) | 0.617 (0.496, 0.739) | 0.594 (0.445, 0.732) | 0.632 (0.515, 0.748) | |
| Combined | 0.725 (0.610, 0.839) | 0.727 (0.620, 0.835) | 0.668 (0.542, 0.794) | 0.679 (0.565, 0.793) |
Patient information and lesion characteristics
| Characteristics | Luminal A (n = 26) | Luminal B (n = 38) | TNBC (n = 18) | HER2-enriched (n = 8) |
|---|---|---|---|---|
| Age(years) | 55.11 ± 8.52 | 51.16 ± 11.01 | 52.89 ± 8.45 | 51.00 ± 9.04 |
| Tumor size(mm) | 27.65 ± 6.93 | 27.37 ± 8.25 | 27.83 ± 9.93 | 24.50 ± 6.35 |
| Menstruation state | ||||
| Premenopausal women | 11 | 17 | 5 | 3 |
| Postmenopausal women | 15 | 21 | 13 | 5 |
| Tumor border | ||||
| Well-defined | 9 | 10 | 8 | 4 |
| ill-defined | 17 | 28 | 10 | 4 |
| Tumor sharp | ||||
| Oval or round | 21 | 32 | 11 | 3 |
| Irregular | 5 | 6 | 7 | 5 |
| ER status | ||||
| Positive | 26 | 38 | 0 | 0 |
| Negative | 0 | 0 | 18 | 8 |
| PR status | ||||
| Positive | 24 | 29 | 0 | 0 |
| Negative | 2 | 9 | 18 | 8 |
| HER2 status | ||||
| Positive | 0 | 13 | 0 | 8 |
| Negative | 26 | 25 | 18 | 0 |
| Ki67 status | ||||
| Positive | 3 | 27 | 16 | 6 |
| Negative | 23 | 11 | 2 | 2 |
The diagnostic performance of imaging metrics for the prediction of molecular subtypes
| Model | Parameter | AUC (TNBC) | AUC (HER2- enriched) | AUC (Luminal A) | AUC (Luminal B) |
|---|---|---|---|---|---|
| ADC | ADCPGSE | 0.617 (0.470, 0.763) | 0.681 (0.519, 0.844) | 0.570 (0.438, 0.703) | 0.577 (0.458, 0.697) |
| ADC25Hz | 0.518 (0.435, 0.727) | 0.745 (0.614, 0.877) | 0.600 (0.470, 0.729) | 0.551 (0.429, 0.672) | |
| ADC50Hz | 0.575 (0.411, 0.739) | 0.744 (0.624, 0.863) | 0.576 (0.449, 0.703) | 0.566 (0.446, 0.686) | |
| ΔADC | 0.648 (0.511, 0.785) | 0.360 (0.141, 0.579) | 0.474 (0.340, 0.609) | 0.622 (0.506, 0.738) | |
| Combined | 0.644 (0.501, 0.786) | 0.765 (0.623, 0.907) | 0.659 (0.538, 0.781) | 0.633 (0.517, 0.748) | |
| IMPULSED | d | 0.519 (0.316, 0.676) | 0.784 (0.609, 0.958) | 0.614 (0.487, 0.741) | 0.490 (0.370, 0.610) |
| Vin | 0.657 (0.522, 0.793) | 0.651 (0.489, 0.813) | 0.572 (0.433, 0.711) | 0.593 (0.475, 0.710) | |
| Dex | 0.537 (0.367, 0.707) | 0.582 (0.375, 0.790) | 0.565 (0.445, 0.684) | 0.558 (0.436, 0.680) | |
| Din | 0.507 (0.348, 0.666) | 0.622 (0.468, 0.776) | 0.514 (0.376, 0.653) | 0.533 (0.412, 0.654) | |
| Cellularity | 0.593 (0.447, 0.738) | 0.720 (0.503, 0.936) | 0.606 (0.474, 0.737) | 0.455 (0.336, 0.574) | |
| Combined | 0.748 (0.629, 0.868) | 0.739 (0.531, 0.947) | 0.666 (0.544, 0.789) | 0.630 (0.513, 0.747) | |
| JOIN | d | 0.519 (0.367, 0.671) | 0.809 (0.675, 0.944) | 0.590 (0.460, 0.719) | 0.515 (0.394, 0.635) |
| vin | 0.644 (0.496, 0.791) | 0.611 (0.438, 0.785) | 0.545 (0.412, 0.678) | 0.593 (0.475, 0.712) | |
| kin | 0.630 (0.489, 0.772) | 0.486 (0.349, 0.624) | 0.558 (0.414, 0.701) | 0.541 (0.420, 0.663) | |
| Dex | 0.521 (0.363, 0.679) | 0.642 (0.438, 0.845) | 0.507 (0.383, 0.631) | 0.539 (0.417, 0.662) | |
| Cellularity | 0.549 (0.396, 0.703) | 0.733 (0.537, 0.929) | 0.584 (0.450, 0.718) | 0.461 (0.342, 0.580) | |
| Combined | 0.742 (0.616, 0.869) | 0.819 (0.657, 0.980) | 0.648 (0.525, 0.770) | 0.609 (0.492, 0.727) | |
| EXCHANGE | d | 0.509 (0.357, 0.661) | 0.784 (0.602, 0.965) | 0.638 (0.513, 0.764) | 0.516 (0.396, 0.636) |
| vin | 0.627 (0.477, 0.778) | 0.532 (0.309, 0.755) | 0.492 (0.364, 0.621) | 0.601 (0.481, 0.721) | |
| kin | 0.696 (0.561, 0.831) | 0.459 (0.299, 0.618) | 0.543 (0.402, 0.684) | 0.606 (0.489, 0.723) | |
| Dex | 0.478 (0.313,0.644) | 0.666 (0.468, 0.865) | 0.514 (0.390, 0.637) | 0.553 (0.431, 0.674) | |
| Cellularity | 0.542 (0.393, 0.692) | 0.756 (0.559, 0.953) | 0.620 (0.490, 0.750) | 0.488 (0.368, 0.608) | |
| Combined | 0.751 (0.633, 0.869) | 0.784 (0.598, 0.969) | 0.730 (0.616, 0.843) | 0.633 (0.518, 0.748) |
The intergroup comparison for the imaging metrics across four breast cancer molecular subtypes
| Model | Parameter | TNBC Median (IQR) | HER2-enriched Median (IQR) | Luminal A Median (IQR) | Luminal B Median (IQR) | p |
|---|---|---|---|---|---|---|
| td-dMRI | ADCPGSE | 0.85 (0.49) | 0.90 (0.25) | 0.74 (0.25) | 0.81 (0.25) | 0.106 |
| ADC25Hz | 1.10 (0.51) | 1.21 (0.31) | 1.03 (0.19) | 1.08 (0.22) | 0.055 | |
| ADC50Hz | 1.44 (0.52) | 1.53 (0.26) | 1.38 (0.18) | 1.38 (0.18) | 0.071 | |
| ΔADC | 0.73 (0.38) | 0.66 (0.29) | 0.81 (0.41) | 0.83 (0.42) | 0.075 | |
| IMPULSE | d | 15.00 (1.73) | 16.16 (1.85) | 14.79 (1.33) | 14.96 (1.07) | 0.038 |
| Vin | 0.38 (0.13) | 0.37 (0.07) | 0.42 (0.13) | 0.41 (0.09) | 0.063 | |
| Dex | 1.91 (0.54) | 2.08 (0.28) | 2.02 (0.24) | 1.95 (0.32) | 0.712 | |
| Din | 2.09 (0.20) | 2.15 (0.08) | 2.07 (0.31) | 2.05 (0.21) | 0.598 | |
| Cellularity | 0.074 (0.03) | 0.058 (0.03) | 0.078 (0.05) | 0.075 (0.03) | 0.071 | |
| JOIN | d | 15.73 (1.57) | 17.17 (2.09) | 15.65 (2.02) | 16.05 (1.42) | 0.031 |
| vin | 0.51 (0.15) | 0.51 (0.09) | 0.54 (0.09) | 0.55 (0.07) | 0.144 | |
| kin | 18.12 (6.66) | 16.38 (2.89) | 15.68 (6.75) | 16.74 (5.09) | 0.374 | |
| Dex | 2.35 (0.41) | 2.54 (0.22) | 2.40 (0.26) | 2.37 (0.32) | 0.596 | |
| Cellularity | 0.081 (0.04) | 0.063 (0.03) | 0.083 (0.06) | 0.082 (0.03) | 0.114 | |
| EXCHANGE | d | 13.91 (1.31) | 15.07 (1.79) | 13.67 (1.20) | 13.94 (1.07) | 0.025 |
| vin | 0.58 (0.10) | 0.58 (0.07) | 0.58 (0.05) | 0.59 (0.05) | 0.280 | |
| kin | 8.12 (5.50) | 7.00 (3.44) | 6.70 (3.9) | 6.67 (2.2) | 0.061 | |
| Dex | 2.30 (0.45) | 2.52 (0.20) | 2.36 (0.31) | 2.30 (0.34) | 0.442 | |
| Cellularity | 0.12 (0.03) | 0.09 (0.03) | 0.12 (0.08) | 0.12 (0.03) | 0.053 |