
TABLE 1.
Results of human papillomavirus (HPV) genotyping in squamous lesions
| HPV type | HPV 16 | HPV 18 | HPV 31 | HPV 39 | HPV 51 | HPV 52 | HPV 53 | HPV 56 | HPV 58 | HPV 59 | HPV 68 | HPV 66 | HPV 70 | HPV 42 |
|---|---|---|---|---|---|---|---|---|---|---|---|---|---|---|
| LSIL, n | 4 | 0 | 0 | 3 | 2 | 0 | 3 | 1 | 0 | 1 | 2 | 5 | 2 | 2 |
| HSIL/CIN 2, n | 4 | 1 | 1 | 0 | 1 | 2 | 0 | 1 | 2 | 0 | 0 | 1 | 0 | 0 |
| HSIL/CIN 3, n | 8 | 0 | 3 | 0 | 0 | 0 | 1 | 0 | 0 | 1 | 0 | 0 | 0 | 0 |
| CSCC, n | 6 | 2 | 2 | 0 | 3 | 0 | 0 | 0 | 0 | 0 | 0 | 0 | 1 | 0 |
1 CSCC = cervical squamous cell carcinoma; HPV = human papillomavirus; HSIL/CIN 2 = high-grade squamous intraepithelial lesion/cervical intraepithelial neoplasia grade 2; HSIL/CIN 3 = high-grade squamous intraepithelial lesion/cervical intraepithelial neoplasia grade 3; LSIL = low-grade squamous intraepithelial lesion; n = number of cases
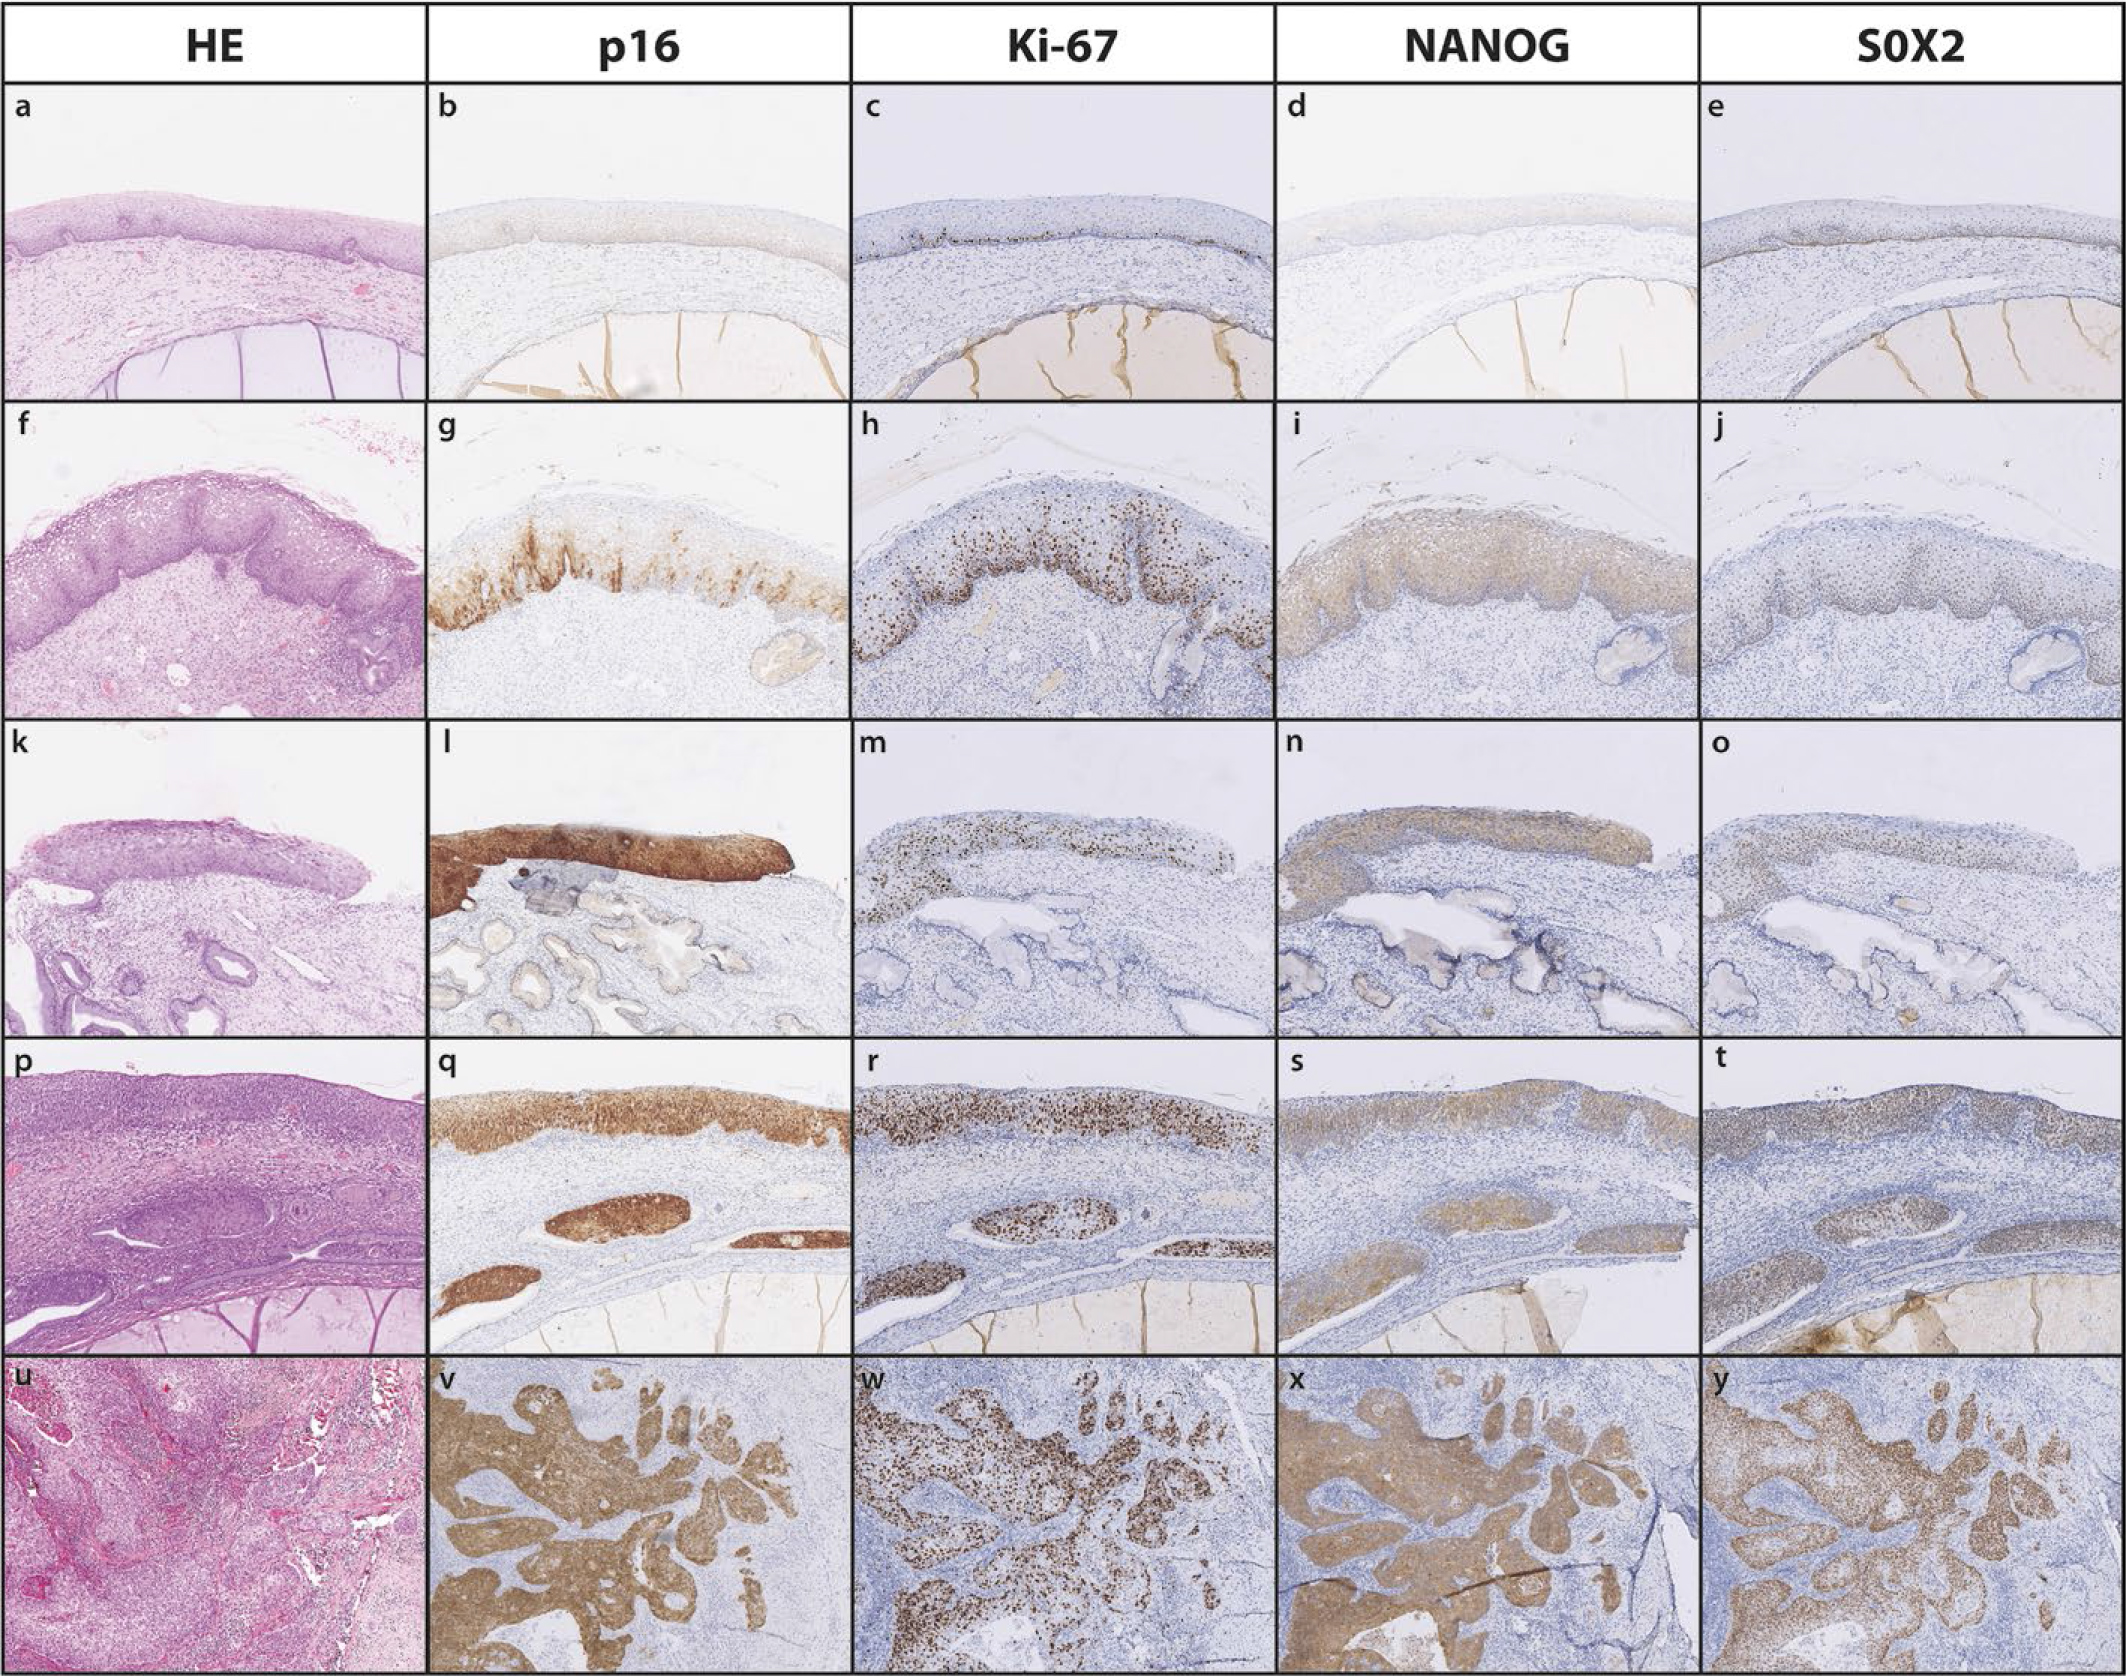
Figure 1.
Representative images of p16 (b, g, l, q, v), Ki-67 (c, h, m r, w), NANOG (d, i, n, s, x) and SOX2 (e, j, o, t, y) immunohistochemical staining in a control (a-e), low-grade squamous intraepithelial lesion (LSIL) (f-j), high-grade squamous intraepithelial lesion/cervical intraepithelial neoplasia grade 2 (HSIL/CIN 2) (k-o), high-grade squamous intraepithelial lesion/cervical intraepithelial neoplasia grade 3 (HSIL/CIN 3) (p-t) and cervical squamous cell carcinoma (CSCC) (u-y).
HE = haematoxylin and eosin stain
TABLE 2.
Evaluation of NANOG staining in controls and squamous lesions
| NANOG SI, n (%) | NANOG P, n (%) | NANOG T, n (%) | |||||||||||
|---|---|---|---|---|---|---|---|---|---|---|---|---|---|
| Score | 0 | 1 | 2 | 3 | 0 | 1 | 2 | 3 | 4 | 0 | 1 | 2 | 3 |
| Controls (n = 40) | 3 (7.5) | 32 (80) | 5 (12.5) | 0 (0) | 3 (7.5) | 6 (15) | 22 (55) | 8 (20) | 1 (2.5) | 3 (7.5) | 4 (10) | 28 (70) | 5 (12.5) |
| LSIL (n = 10) | 0 (0) | 2 (20) | 7 (70) | 1 (10) | 0 (0) | 0 (0) | 0 (0) | 1 (10) | 9 (90) | 0 (0) | 0 (0) | 0 (0) | 10 (100) |
| HSIL/CIN 2 (n = 10) | 1 (10) | 0 (0) | 4 (40) | 5 (50) | 1 (10) | 0 (0) | 0 (0) | 0 (0) | 9 (90) | 1 (0) | 0 (0) | 0 (0) | 9 (90) |
| HSIL/CIN 3 (n = 10) | 0 (0) | 0 (0) | 1 (10) | 9 (90) | 0 (0) | 0 (0) | 0 (0) | 0 (0) | 10 (10) | 0 (0) | 0 (0) | 0 (0) | 10 (100) |
| CSCC (n = 10) | 0 (0) | 0 (0) | 1 (10) | 9 (90) | 0 (0) | 0 (0) | 0 (0) | 0 (0) | 10 (100) | Not applicable1 | |||
1 CSCC = cervical squamous cell carcinoma; HSIL/CIN 2 = high-grade squamous intraepithelial lesion/cervical intraepithelial neoplasia grade 2; HSIL/CIN 3 = high-grade squamous intraepithelial lesion/cervical intraepithelial neoplasia grade 3; LSIL = low-grade squamous intraepithelial lesion; n = number of cases; P = percentage of positive cells; SI = staining intensity for NANOG; T = thickness of staining; % = percentage of all cases in each category
TABLE 3.
Evaluation of SOX2 staining in controls and squamous lesions
| SOX2 SI, n (%) | SOX2 P, n (%) | SOX2 T, n (%) | |||||||||||
|---|---|---|---|---|---|---|---|---|---|---|---|---|---|
| Score | 0 | 1 | 2 | 3 | 0 | 1 | 2 | 3 | 4 | 0 | 1 | 2 | 3 |
| Controls (n = 40) | 2 (5) | 33 (82.5) | 5 (12.5) | 0 (0) | 2 (5) | 1 (2.5) | 26 (65) | 10 (25) | 0 (0) | 2 (5) | 1 (2.5) | 31 (77.5) | 6 (15) |
| LSIL (n = 10) | 0 (0) | 4 (40) | 6 (60) | 0 (0) | 0 (0) | 0 (0) | 2 (20) | 4 (40) | 4 (40) | 0 (0) | 0 (0) | 4 (40) | 6 (60) |
| HSIL/CIN 2 (n = 10) | 0 (0) | 1 (10) | 7 (70) | 2 (20) | 0 (0) | 0 (0) | 0 (0) | 4 (40) | 6 (60) | 0 (0) | 0 (0) | 1 (10) | 9 (90) |
| HSIL/CIN 3 (n = 10) | 0 (0) | 1 (10) | 1 (10) | 8 (80) | 1 (10) | 0 (0) | 0 (0) | 1 (10) | 8 (80) | 0 (0) | 0 (0) | 0 (0) | 10 (100) |
| CSCC (n = 10) | 0 (0) | 0 (0) | 3 (30) | 7 (70) | 0 (0) | 0 (0) | 0 (0) | 2 (20) | 8 (80) | Not applicable1 | |||
1 CSCC = cervical squamous cell carcinoma; HSIL/CIN 2 = high-grade squamous intraepithelial lesion/cervical intraepithelial neoplasia grade 2; HSIL/CIN 3 = high-grade squamous intraepithelial lesion/cervical intraepithelial neoplasia grade 3; LSIL = low-grade squamous intraepithelial lesion; n = number of cases; P = percentage of positive cells; SI = staining intensity for NANOG; T = thickness of staining; % = percentage of all cases in each category
TABLE 4.
Comparison of NANOG and SOX2 staining between squamous lesions and their adjacent control non-dysplastic squamous epithelium
| NANOG SIxP score, a ± SD | p-value1 | SOX2 SIxP score, a ± SD | p-value1 | ||
|---|---|---|---|---|---|
| C (LSIL) | LSIL | C (LSIL) | LSIL | ||
| 2.30 ± 0.95 | 7.50 ± 2.46 | 0.000 | 3.00 ± 1.41 | 5.40 ± 2.63 | 0.054 |
| C (HSIL/CIN 2) | HSIL/CIN 2 | C (HSIL/CIN 2) | HSIL/CIN 2 | ||
| 3.30 ± 2.06 | 9.20 ± 3.79 | 0.002 | 2.20 ± 1.48 | 7.70 ± 2.75 | 0.000 |
| C (HSIL/CIN 3) | HSIL/CIN 3 | C (HSIL/CIN 3) | HSIL/CIN 3 | ||
| 2.00 ± 0.94 | 10.40 ± 2.07 | 0.000 | 2.30 ± 1.16 | 10.10 ± 3.84 | 0.002 |
| C (CSCC) | CSCC | C (CSCC) | CSCC | ||
| 1.44 ± 1,01 | 11.56 ± 1.33 | 0.000 | 2.44 ± 0,53 | 10.22 ± 2.73 | 0.000 |
| C (HSIL) | HSIL | C (HSIL) | HSIL | ||
| 2.65 ± 1.65 | 9.80 ± 2.96 | 0.000 | 2.25 ± 1.26 | 8.90 ± 3.39 | 0.000 |
| NANOG SIxT score2 a ± SD | p-value1 | SOX2 SIxT score2, a ± SD | p-value1 | ||
|---|---|---|---|---|---|
| C (LSIL) | LSIL | C (LSIL) | LSIL | ||
| 1.90 ± 0.32 | 5.70 ± 1.70 | 0.000 | 2.50 ± 0.85 | 4.30 ± 1.89 | 0.0027 |
| C (HSIL/CIN 2) | HSIL/CIN 2 | C (HSIL/CIN 2) | HSIL/CIN 2 | ||
| 3.00 ± 1.76 | 6.90 ± 2.85 | 0.005 | 1.90 ± 0.99 | 6.10 ± 1.85 | 0.000 |
| C (HSIL/CIN 3) | HSIL/CIN 3 | C (HSIL/CIN 3) | HSIL/CIN 3 | ||
| 2.20 ± 1.48 | 7.80 ± 1.55 | 0.000 | 2.40 ± 1.17 | 8.10 ± 2.02 | 0.000 |
| C (HSIL) | HSIL | C (HSIL) | HSIL | ||
| 2.60 ± 1.59 | 7.35 ± 2.22 | 0.000 | 2.15 ± 1.06 | 7.10 ± 2.10 | 0.000 |
1 a = average; C (HSIL) = control non-dysplastic squamous epithelium adjacent to high-grade squamous intraepithelial lesion; C (LSIL) = control non-dysplastic squamous epithelium adjacent to low-grade squamous intraepithelial lesion; C (HSIL/CIN 2) = control non-dysplastic squamous epithelium adjacent to high-grade squamous intraepithelial lesion/cervical intraepithelial neoplasia grade 2; C (HSIL/CIN 3) = control non-dysplastic squamous epithelium adjacent to high-grade squamous intraepithelial lesion/cervical intraepithelial neoplasia grade 3; CSCC = cervical squamous cell carcinoma; C (CSCC) = control non-dysplastic squamous epithelium adjacent to cervical squamous cell carcinoma; HSIL = high-grade squamous intraepithelial lesion; HSIL/CIN 2 = high-grade squamous intraepithelial lesion/cervical intraepithelial neoplasia grade 2; HSIL/CIN 3 = high-grade squamous intraepithelial lesion/cervical intraepithelial neoplasia grade 3; LSIL = low-grade squamous intraepithelial lesion; SD = standard deviation; SIxP score = staining intensity (SI) multiplied by percentage of positive cells (P); SIxT score = staining intensity (SI) multiplied by thickness of staining (T)
TABLE 5.
Comparison of NANOG and SOX2 staining between squamous lesions
| NANOG SIxP score, a ± SD | p-value1 | SOX2 SIxP score, a ± SD | p-value1 | ||
|---|---|---|---|---|---|
| LSIL | HSIL/CIN 2 | LSIL | HSIL/CIN 2 | ||
| 7.50 ± 2.46 | 9.20 ± 3.79 | 0.101 | 5.40 ± 2.63 | 7.70 ± 2.75 | 0.114 |
| HSIL/CIN 2 | HSIL/CIN 3 | HSIL/CIN 2 | HSIL/CIN 3 | ||
| 9.20 ± 3.79 | 10.40 ± 2.07 | 0.547 | 7.70 ± 2.75 | 10.10 ± 3.84 | 0.031 |
| HSIL/CIN 3 | CSCC | HSIL/CIN 3 | CSCC | ||
| 10.40 ± 2.07 | 11.56 ± 1.33 | 0.165 | 10.10 ± 3.84 | 10.22 ± 2.73 | 0.805 |
| LSIL | HSIL | LSIL | HSIL | ||
| 7.50 ± 2.46 | 9.80 ± 2.96 | 0.018 | 5.40 ± 2.63 | 8.90 ± 3.39 | 0.009 |
| HSIL | CSCC | HSIL | CSCC | ||
| 9.80 ± 2.96 | 11.56 ± 1.33 | 0.078 | 8.90 ± 3.39 | 10.22 ± 2.73 | 0.370 |
| NANOG SIxT score2 a ± SD | p-value1 | SOX2 SIxT score2, a ± SD | p-value1 | ||
|---|---|---|---|---|---|
| LSIL | HSIL/CIN 2 | LSIL | HSIL/CIN 2 | ||
| 5.70 ± 1.70 | 6.90 ± 2.85 | 0.101 | 4.30 ± 1.89 | 6.10 ± 1.85 | 0.056 |
| HSIL/CIN 2 | HSIL/CIN 3 | HSIL/CIN 2 | HSIL/CIN 3 | ||
| 6.90 ± 2.85 | 7.80 ± 1.55 | 0.547 | 6.10 ± 1.85 | 8.10 ± 2.02 | 0.023 |
| LSIL | HSIL | LSIL | HSIL | ||
| 5.70 ± 1.70 | 7.35 ± 2.22 | 0.018 | 4.30 ± 1.89 | 7.10 ± 2.10 | 0.003 |
1 a = average; CSCC = cervical squamous cell carcinoma; HSIL = high-grade squamous intraepithelial lesion; HSIL/CIN 2 = high-grade squamous intraepithelial lesion/cervical intraepithelial neoplasia grade 2; HSIL/CIN 3 = high-grade squamous intraepithelial lesion/cervical intraepithelial neoplasia grade 3; LSIL = low-grade squamous intraepithelial lesion; SD = standard deviation; SIxP score = staining intensity (SI) multiplied by percentage of positive cells (P); SIxT score = staining intensity (SI) multiplied by thickness of staining (T)