
FIGURE 1.
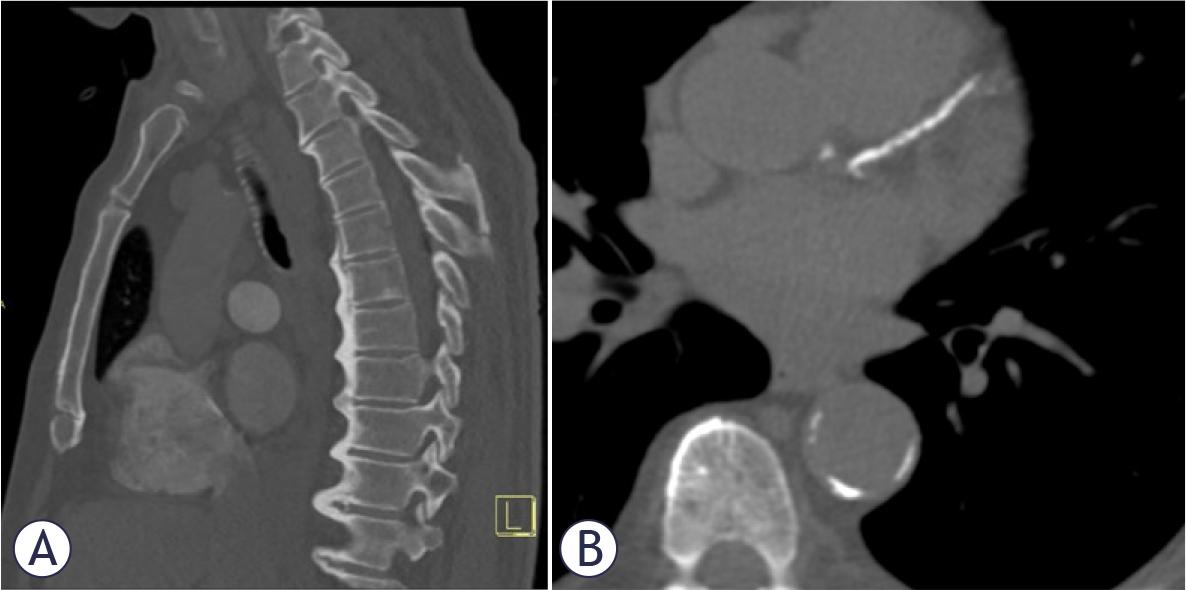
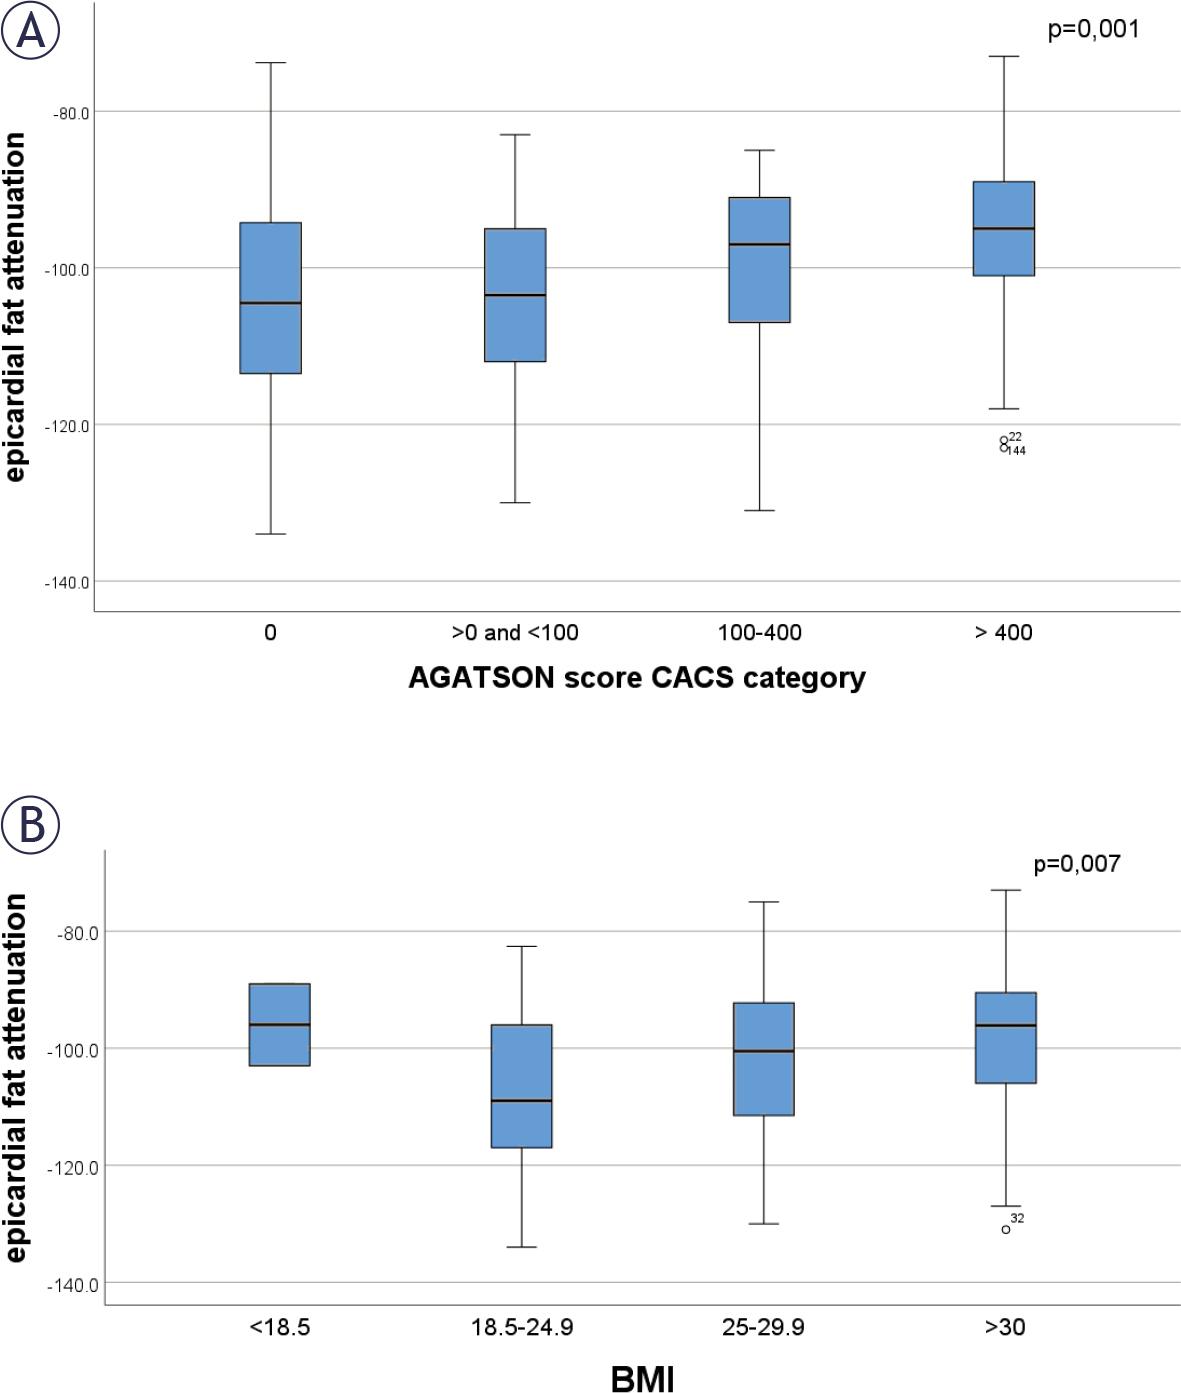
FIGURE 2.
Characteristics of the cohort
| DISH | no DISH | p-value | |
|---|---|---|---|
| Age (years), mean (SD) | 67.3 ± 10.1 | 60.5 ± 12.2 | 0.029 |
| Gender (f/m), N | 5/12 | 99/103 | 0.120 |
| Weight (kg), mean (SD) | 96.6 ± 20.3 | 84.5 ± 17.5 | 0.008 |
| Height (cm), mean (SD) | 170.9 ± 6.5 | 171.0 ± 9.7 | 0.980 |
| BMI (kg/m2), mean (SD) | 32.8 ± 7.2 | 28.9 ± 5.3 | 0.011 |
| Family history of cardiovascular disease, N (%) | 11 (64.7%) | 119 (59.2%) | 0.657 |
| Diabetes, N (%) | 6 (35.3%) | 25 (12.4%) | 0.010 |
| Hypercholesterolemia, N (%) | 6 (35.3%) | 51 (25.4%) | 0.371 |
| Hypertension, N (%) | 12 (70.6%) | 110 (54.7%) | 0.206 |
| Current smoker, N (%) | 2 (11.8%) | 38 (18.9%) | 0.465 |
| Angina pectoris, N (%) | 4 (23.5%) | 92 (44%) | 0.076 |
| Metabolic syndrome, N (%) | 7 (43.8%) | 25 (13.0%) | 0.001 |
| EAT attenuation (HU), mean (SD) | -98.5 ± 11.8 | -101.7 ± 13.0 | 0.347 |
| NAFLD | 5 (29.4%) | 52 (26.0%) | 0.759 |
| CACS (au) = 0 | 2 (11.8%) | 68 (33.8%) | 0.063 |
| CACS (au), median (IQR) | 101.0 (4.7-569.0) | 27.3 (0-391.8) | 0.241 |
| Calcifications in proximal thoracic aorta, median (IQR) | 196.4 (12.3-759.5) | 14.3 (0-244.6) | 0.023 |
| Calcifications in aortic root, median (IQR) | 146.8 (8.3-758.0) | 1.8 (0-175.0) | 0.013 |
| Calcifications in ascending aorta, median (IQR) | 2.1 (0-35.2) | 0.0 (0-3.9) | 0.109 |
| Myocardial infarction, N (%) | 1 (6.0%) | 12 (6.0%) | 0.988 |
Prevalence of diffuse idiopathic skeletal hyperostosis (DISH) among Agatson coronary artery calcification score (CACS) categories
| CACS = 0 (N = 70) | CACS > 0 and < 100 (N = 62) | CACS = 100–400 (N = 33) | CACS > 400 (N = 53) | |
|---|---|---|---|---|
| DISH | 2.8% | 10.3% | 6.6% | 13.3% |
| No DISH | 97.2% | 89.7% | 93.4% | 86.7% |
Association of epicardial adipose tissue (EAT) attenuation with conventional coronary artery disease (CAD) risk factors and CT parameters
| Variable | EAT attenuation (HU) | p-value |
|---|---|---|
| Gender | M - 98.3 ± 11.3 | < 0.001 |
| NAFLD | Y - 98.3 ± 12.8 | 0.022 |
| Family history of cardiovascular disease | Y - 100.1 ± 12.8 | 0.261 |
| Diabetes | Y - 104.2 ± 14.3 | 0.883 |
| Hypercholesterolemia | Y - 99.4 ± 13.5 | 0.402 |
| Hypertension | Y - 99.2 ± 12.4 | 0.129 |
| Smoking | Y - 97.8 ± 13.3 | 0.361 |
| Regular physical activity | Y - 101.6 ± 12.8 | 0.653 |
| Correlation coefficient | ||
| CACS (Agatson) | 0.306 | < 0.001 |
| CACS per vessel | ||
| LM | 0.159 | 0.018 |
| LAD | 0.247 | < 0.001 |
| LCX | 0.269 | < 0.001 |
| RCA | 0.289 | < 0.001 |
| Calcifications in proximal thoracic aorta | 0.110 | 0.103 |
| Calcifications in aortic root | 0.082 | 0.226 |
| Calcifications in ascending aorta | 0.172 | 0.011 |
| Age | 0.006 | 0.834 |
| BMI | 0.243 | < 0.001 |
Univariate logistic regression analysis with diffuse idiopathic skeletal hyperostosis (DISH) status as the dependent factor
| Variable | units | OR | p-value |
|---|---|---|---|
| Age | + 1 year | 1.055 | 0.032 |
| Gender | Male vs. female | 2.307 | 0.129 |
| BMI | + 1 kg/m2 | 1.133 | 0.005 |
| Diabetes | Present vs. absent | 3.840 | 0.015 |
| Hypertension | Present vs. absent | 1.985 | 0.213 |
| Hypercholesterolemia | Present vs. absent | 0.623 | 0.375 |
| Smoking | Present vs. absent | 1.748 | 0.470 |
Multinomial multivariate logistic regression analysis on the association of diffuse idiopathic skeletal hyperostosis (DISH) and coronary artery calcification score (CACS) category
| CACS category | gender | age | hypertension | EAT attenuation | ||||
|---|---|---|---|---|---|---|---|---|
| OR | p-value | OR | p-value | OR | p-value | OR | p-value | |
| >0 and <100 | 3.515 | 0.008 | 1.087 | <0.001 | 3.956 | 0.001 | 0.980 | 0.225 |
| 100-400 | 7.583 | <0.001 | 1.156 | <0.001 | 5.023 | 0.003 | 1.005 | 0.804 |
| > 400 | 16.786 | <0.001 | 1.227 | <0.001 | 5.423 | 0.001 | 1.052 | 0.022 |