
TABLE 1.
Antigens expressed on acute lymphoblastic leukaemia (ALL) blasts which are essential for planning the treatment or may influence the prognosis of the disease
| Antigen | Expression of the antigen in normal and pathological conditions | Clinical significance |
|---|---|---|
| CD10 | Normal lymphoid progenitors, neutrophils and blast cells of B-ALL19 | Associated with favourable presenting features in paediatric B-ALL and possible target for emerging CAR-T19,20,21 |
| CD19 | Normal and malignant B lymphocytes22 | Target of blinatumomab and CAR-T22,23,24 |
| CD20 | Normal and malignant B lymphocytes21 | Target of rituximab, up-modulated in B-ALL patients with poor prognosis7,21 |
| CD27 | T cells, natural killer cells and thymocytes, also memory B cells, and in some subsets of B-ALL11 | Positive in B-ALL with BCR/ABL or CRLF2 rearrangement, high positivity was associated with poor prognosis11,12,13 |
| CD34 | Pluripotent stem cells14 | Lack of expression associated with worse event free and overall survival of ALL15 |
| CD45 | Cells of hematopoietic origin25 | High expression associated with high risk disease and worse event free survival, and worse rate of complete remission after the induction therapy16,26 |
| CD58 | Hematopoietic and nonhematopoietic cells27 | Lack of expression reduces the efficacy of blinatumomab and anti-CD19 CAR-T4,5 |
| CD66c | Granulocytes and their precursors, most common myeloid antigen on malignant B lymphoblasts17 | Associated with specific genetic alterations such as BCR/ABL, hypodiploidy, hypodiploidy and CRLF2-positivity in B-ALL17,18 |
| CD137 | T lymphocytes and natural killer cells but also on activated B cells of naive origin28 | Enhances B cell survival28 |
[i] B-ALL = B-cell ALL; CAR-T = chimeric antigen receptor T; CRLF2 = cytokine receptor-like factor 2
TABLE 2.
Clinical characteristics of all included patients
| No. of all included patients with B-ALL | N = 29 |
|---|---|
| Male/female | N |
| 17/12 | |
| Mean age at diagnosis | Years |
| 4.76 (newborn 17) | |
| Flow cytometric findings at diagnosis | N (%) |
| Pro-B | 3 (10) |
| Pre-B | 6 (21) |
| Common type | 20 (69) |
| Cytogenetic and molecular finding at diagnosis | N (%) |
| normal karyotype | 6 (21) |
| hyperdiploid | 10 (34) |
| t(12;21) | (28) |
| complex karyotype | (3) |
| MLL | 1 (3) |
| changes of unknown risk potential | 3 (10) |
| Outcome | N (%) |
| Alive | 93) |
| Died | 2 (7) |
| Cause of death | N |
| pancreatitis* | 1 |
| progressive disease** | 1 |
TABLE 3.
Response to the therapy in patients treated according ALL IC BFM 09 protocol
| Patients treated according to ALL IC-BFM 2009 protocol | |
|---|---|
| No. of patients | 27 |
| Treatment arm | N (%) |
| SR | 6 (22) |
| IR | 18 (66) |
| HR | 3 (11) |
| Response to prednisolone on day 8 | N (%) |
| good response* | 27 (100) |
| poor response** | 0 (0) |
| Minimal residual disease on day 15 | N (%) |
| < 0.1% | 10 (37) |
| 0.1–10% | 15 (56) |
| > 10% | 2 (7) |
| Minimal residual disease on day 33 | N (%) |
| neg | 16 (59) |
| < 0.1% | 6 (22) |
| 0.1–10% | 3 (11) |
| > 10% | 2 (7) |
| Outcome | N (%) |
| alive | 26 (96) |
| died | 1 (4) |
TABLE 4.
The description of the antibodies used for flow cytometry
| Antibody | Antibody clone | Antibody vendor | Antibody volume (μL) | |
|---|---|---|---|---|
| CD10 | Anti-CD10 Horizon™ BV605 | HI10a | BD Biosciences | 5 |
| CD19 | CD19-BD Horizon™ V450 Mouse Anti-Human CD19 | SJ25C1 | BD Biosciences | 5 |
| CD20 | CD20-BD™ CD20 APC | L27 | BD Biosciences | 7 |
| CD27 | CD27-BD Horizon™ APC-R700 Mouse Anti-Human CD27 | M-T271 | BD Biosciences | 5 |
| CD34 | CD34-BD™ CD34 PE-Cy™7 | 8G12 | BD Biosciences | 5 |
| CD45 | CD45-BD™ CD45 APC-Cy™7 | 2D1 | BD Biosciences | 3 |
| CD58 | CD58-BD Pharmingen™ FITC Mouse Anti-Human CD58 | 1C3 | BD Biosciences | 3 |
| CD66c | CD66c-BD OptiBuild™ BV510 Mouse Anti-Human CD66c | B6.2/CD66 | BD Biosciences | 5 |
| CD137 | CD137-BD Pharmingen™ PE Mouse Anti-Human CD137 | 4B4-1 | BD Biosciences | 7 |
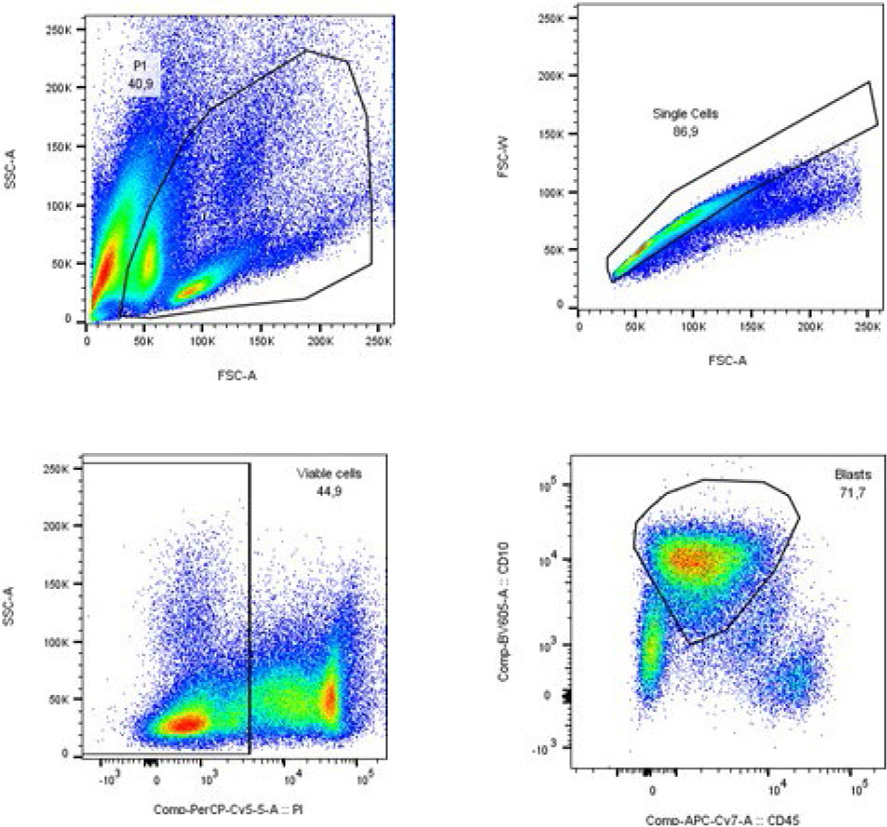
FIGURE 1.
Example of a gating procedure. Mononuclear cells were selected on the forward versus side scatter plot (A) and single cells by gating on the area against the width for forward scatter (B). Propidium iodide (PI) was used to select viable cells (C). The final selection of blasts was based on their immunophenotype, in this case by selecting CD10-positive cells on the CD10 versus CD45 plots (D).
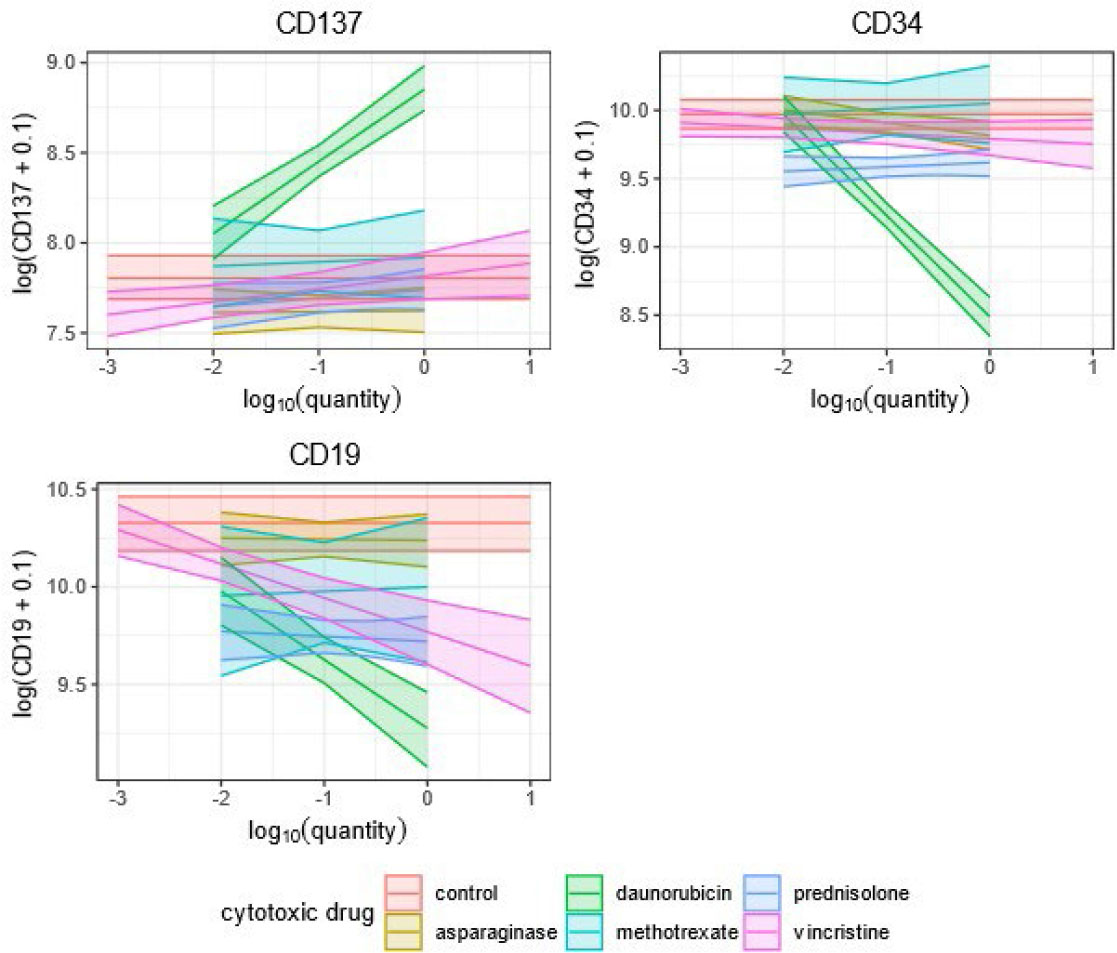
FIGURE 2A.
The plots of the marginal effects for the fixed effects coefficients of the models for CD137, CD34 and CD19. The lines correspond to the estimates of the ma rginal ef fects and the coloured areas to the 95% confidence intervals.
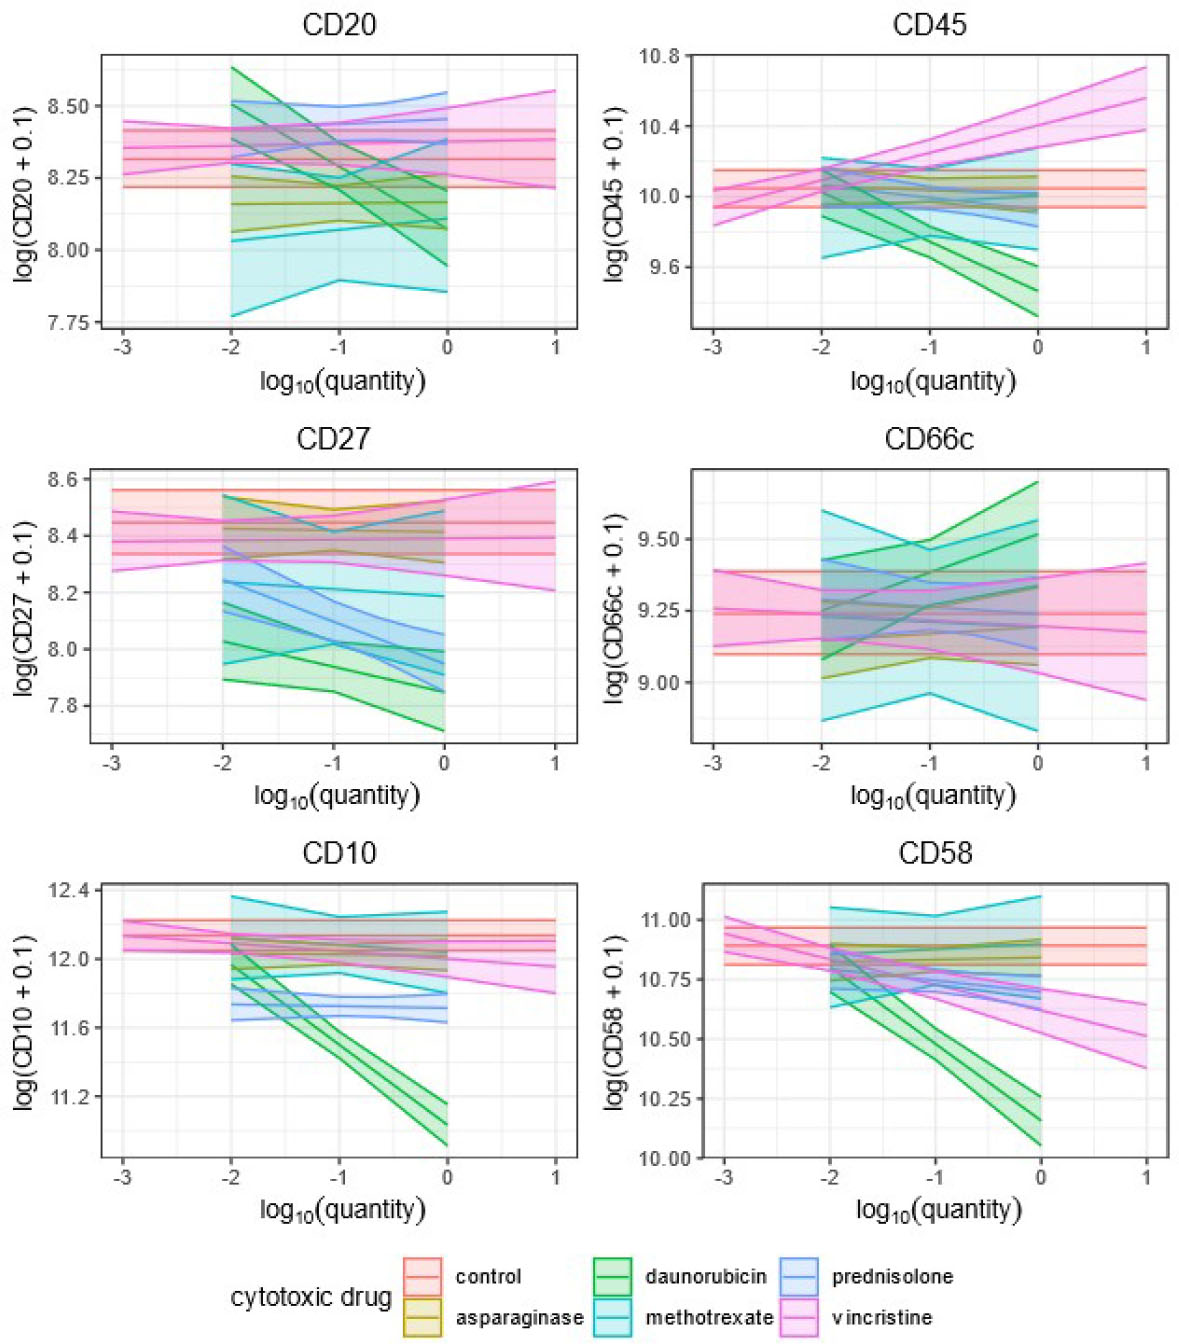
FIGURE 2B.
The plots of the marginal effects for the fixed effects coefficients of the models for CD20, CD45, CD27, CD66c, CD10, and CD58. The lines correspond to the estimates of the marginal effects and the coloured areas to the 95% confidence intervals.
TABLE 5.
The coefficients obtained by using separate mixed model which showed the effect of single drug in CDn antigen expression. The coefficient d showed the presence of CDn antigen and coefficient of k_d the influence of drug dose on antigen expression. The way how the given drug influences the antigen expression is shown in different colours: RED (coefficients d and k_d are statistically significantly different from 0), BLUE (the coefficient d is significantly different from 0), GREEN (coefficient k_d is significantly different from 0) and WHITE (neither the coefficient d nor k_d is statistically significantly different from 0). 95% confidence intervals, and corresponding p values are also shown. All confidence intervals and p values were adjusted with Holm’s method
| Drug | CD | Coefficient d (presence) | p value for d | Coefficient k_d (log(amount)) | p value for k_d |
|---|---|---|---|---|---|
| Asparaginase | CD10 | −0.12, [−0.33, 0.1] | 1 | −0.01, [−0.11, 0.1] | 1 |
| CD137 | −0.18, [−0.46, 0.1] | 1 | 0, [−0.11, 0.12] | 1 | |
| CD19 | −0.09, [−0.42, 0.24] | 1 | −0.01, [−0.14, 0.13] | 1 | |
| CD20 | −0.15, [−0.39, 0.09] | 1 | 0, [−0.09, 0.1] | 1 | |
| CD27 | −0.03, [−0.28, 0.22] | 1 | −0.01, [−0.12, 0.11] | 1 | |
| CD34 | −0.15, [−0.4, 0.09] | 1 | −0.09, [−0.23, 0.04] | 1 | |
| CD45 | −0.04, [−0.27, 0.2] | 1 | −0.02, [−0.16, 0.11] | 1 | |
| CD58 | −0.05, [−0.23, 0.13] | 1 | 0.01, [−0.08, 0.1] | 1 | |
| CD66c | −0.05, [−0.36, 0.27] | 1 | 0.02, [−0.15, 0.19] | 1 | |
| Daunorubicin | CD10 | −1.1, [−1.38, −0.83] | < 0.001 | −0.47, [−0.63, −0.31] | < 0.001 |
| CD137 | 1.05, [0.72, 1.37] | < 0.001 | 0.4, [0.21, 0.59] | < 0.001 | |
| CD19 | −1.05, [−1.48, −0.62] | < 0.001 | −0.35, [−0.6, −0.1] | < 0.001 | |
| CD20 | −0.24, [−0.53, 0.05] | 0.35 | −0.22, [−0.39, −0.05] | 0.002 | |
| CD27 | −0.6, [−0.92, −0.27] | < 0.001 | −0.09, [−0.27, 0.09] | 1 | |
| CD34 | −1.48, [−1.8, −1.16] | < 0.001 | −0.74, [−0.93, −0.55] | < 0.001 | |
| CD45 | −0.58, [−0.9, −0.27] | < 0.001 | −0.28, [−0.47, −0.1] | < 0.001 | |
| CD58 | −0.73, [−0.97, −0.5] | < 0.001 | −0.32, [−0.46, −0.19] | < 0.001 | |
| CD66c | 0.28, [−0.13, 0.69] | 1 | 0.13, [−0.1, 0.37] | 1 | |
| Methotrexate | CD10 | −0.1, [−0.52, 0.33] | 1 | −0.04, [−0.32, 0.24] | 1 |
| CD137 | 0.11, [−0.33, 0.56] | 1 | 0.02, [−0.24, 0.29] | 1 | |
| CD19 | −0.33, [−1, 0.35] | 1 | 0.02, [−0.38, 0.42] | 1 | |
| CD20 | −0.21, [−0.68, 0.27] | 1 | 0.04, [−0.26, 0.34] | 1 | |
| CD27 | −0.26, [−0.79, 0.27] | 1 | −0.03, [−0.34, 0.29] | 1 | |
| CD34 | 0.08, [−0.4, 0.56] | 1 | 0.04, [−0.28, 0.35] | 1 | |
| CD45 | −0.04, [−0.5, 0.41] | 1 | 0.03, [−0.29, 0.35] | 1 | |
| CD58 | 0.01, [−0.25, 0.27] | 1 | 0.02, [−0.21, 0.26] | 1 | |
| CD66c | −0.05, [−0.64, 0.54] | 1 | −0.02, [−0.4, 0.37] | 1 | |
| Prednisolone | CD10 | −0.42, [−0.64, −0.21] | < 0.001 | −0.01, [−0.12, 0.1] | 1 |
| CD137 | −0.06, [−0.32, 0.19] | 1 | 0.05, [−0.1, 0.19] | 1 | |
| CD19 | −0.61, [−0.94, −0.27] | < 0.001 | −0.03, [−0.2, 0.15] | 1 | |
| CD20 | 0.14, [−0.09, 0.37] | 1 | 0.02, [−0.1, 0.14] | 1 | |
| CD27 | −0.5, [−0.76, −0.23] | < 0.001 | −0.15, [−0.3, 0] | 0.055 | |
| CD34 | −0.35, [−0.6, −0.11] | < 0.001 | 0.03, [−0.1, 0.16] | 1 | |
| CD45 | −0.12, [−0.36, 0.12] | 1 | −0.07, [−0.2, 0.07] | 1 | |
| CD58 | −0.19, [−0.38, −0.01] | 0.034 | −0.05, [−0.15, 0.05] | 1 | |
| CD66c | 0, [−0.19, 0.19] | 1 | −0.02, [−0.2, 0.15] | 1 | |
| Vincristine | CD10 | −0.14, [−0.37, 0.1] | 1 | −0.05, [−0.14, 0.05] | 1 |
| CD137 | 0.01, [−0.22, 0.25] | 1 | 0.07, [−0.04, 0.18] | 1 | |
| CD19 | −0.56, [−0.94, 0] | < 0.001 | −0.17, [−0.32, −0.03] | 0.004 | |
| CD20 | 0.06, [−0.19, 0.31] | 1 | 0.01, [−0.08, 0.09] | 1 | |
| CD27 | −0.06, [−0.34, 0.23] | 1 | 0, [−0.09, 0.09] | 1 | |
| CD34 | −0.18, [−0.45, 0.1] | 1 | −0.04, [−0.14, 0.06] | 1 | |
| CD45 | 0.36, [0.07, 0.64] | 0.002 | 0.16, [0.05, 0.26] | < 0.001 | |
| D58 | −0.27, [−0.48, −0.06] | 0.001 | −0.11, [−0.19, −0.03] | < 0.001 | |
| CD66c | −0.04, [−0.39, 0.3] | 1 | −0.02, [−0.15, 0.11] | 1 |