
FIGURE 1.
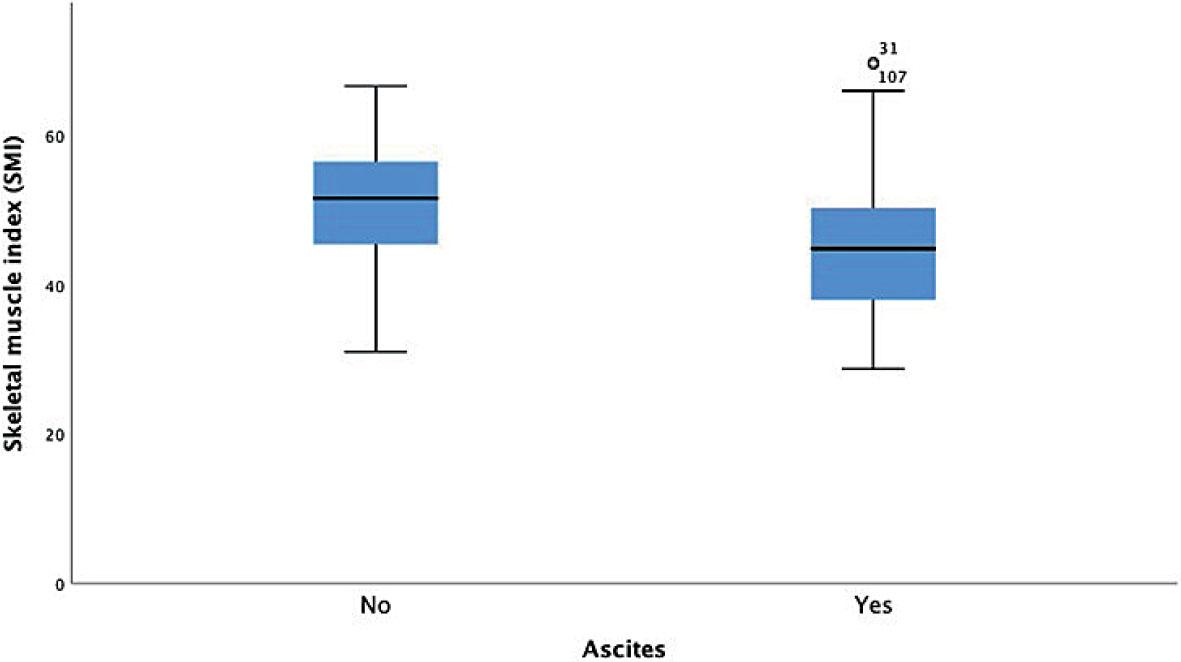
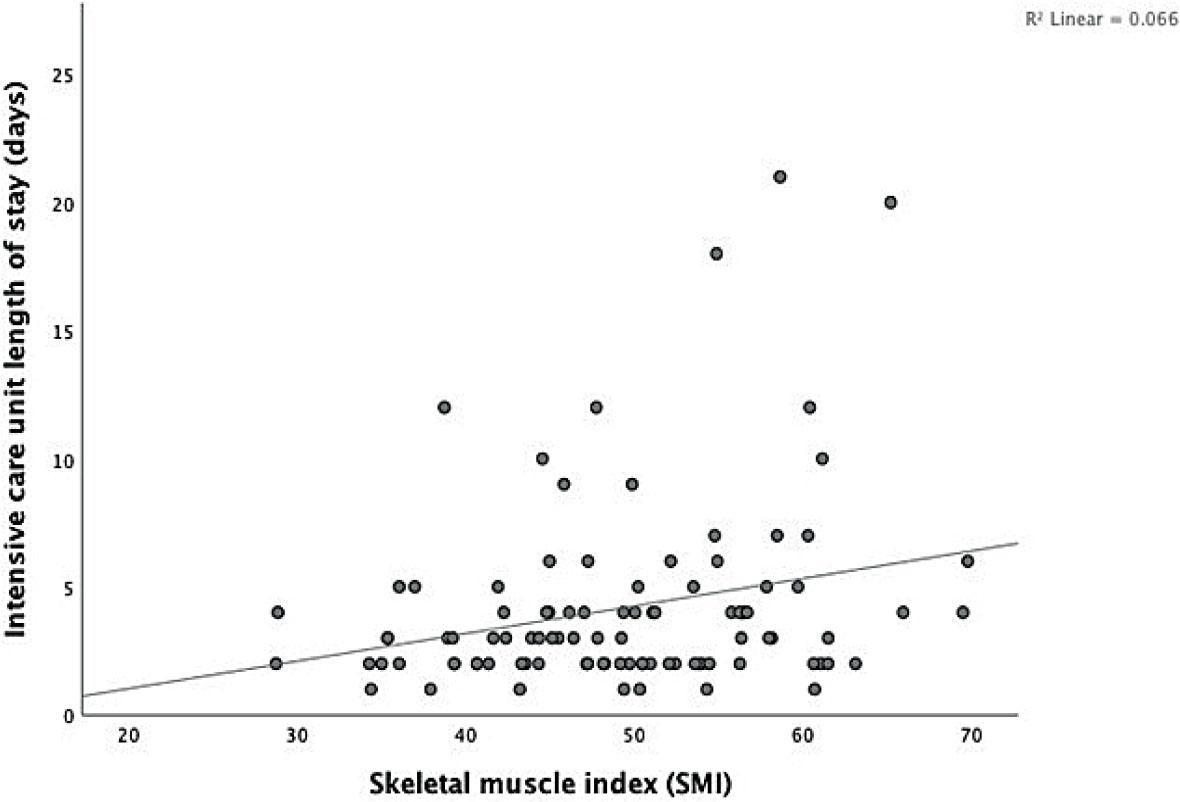
FIGURE 2.
Laboratory and clinical data of patients
| Variable | Min | Max | IQR | SD | 95% CI | |
|---|---|---|---|---|---|---|
| Lower | Upper | |||||
| BMI | 15 | 38 | 6 | 4.775 | 25.13 | 26.74 |
| Waiting time for liver transplantation (days) | 1 | 691 | 166 | 151.311 | 108.44 | 159.38 |
| Sodium | 121 | 147 | 6 | 4.701 | 136.09 | 137.68 |
| Creatinine | 41 | 696 | 46 | 67.082 | 85.91 | 108.49 |
| Albumin | 10 | 62 | 10 | 7.674 | 31.28 | 33.86 |
| Protein | 23 | 89 | 12 | 11.494 | 65.80 | 69.74 |
| Bilirubin | 2 | 687 | 56 | 107.535 | 51.83 | 88.04 |
| INR | 1 | 4 | 1 | .502 | 1.44 | 1.61 |
| MELD score | 7 | 46 | 9 | 6.700 | 14.30 | 16.56 |
| ALBI score | −4 | 0 | 1.13 | 0.802 | −1.87 | −1.60 |
Aetiology of liver disease and incidence of myosteatosis
| Variable | Myosteatosis | ||
|---|---|---|---|
| no | yes | ||
| Liver failure | Alcohol-related | 32 | 28 |
| Virus-related | 14 | 3 | |
| Other | 47 | 14 | |
| χ2 | 9.717 | ||
| Degrees of freedom (Df) | 2 | ||
| p | 0.008 | ||