
FIGURE 1.
FIGURE 2.
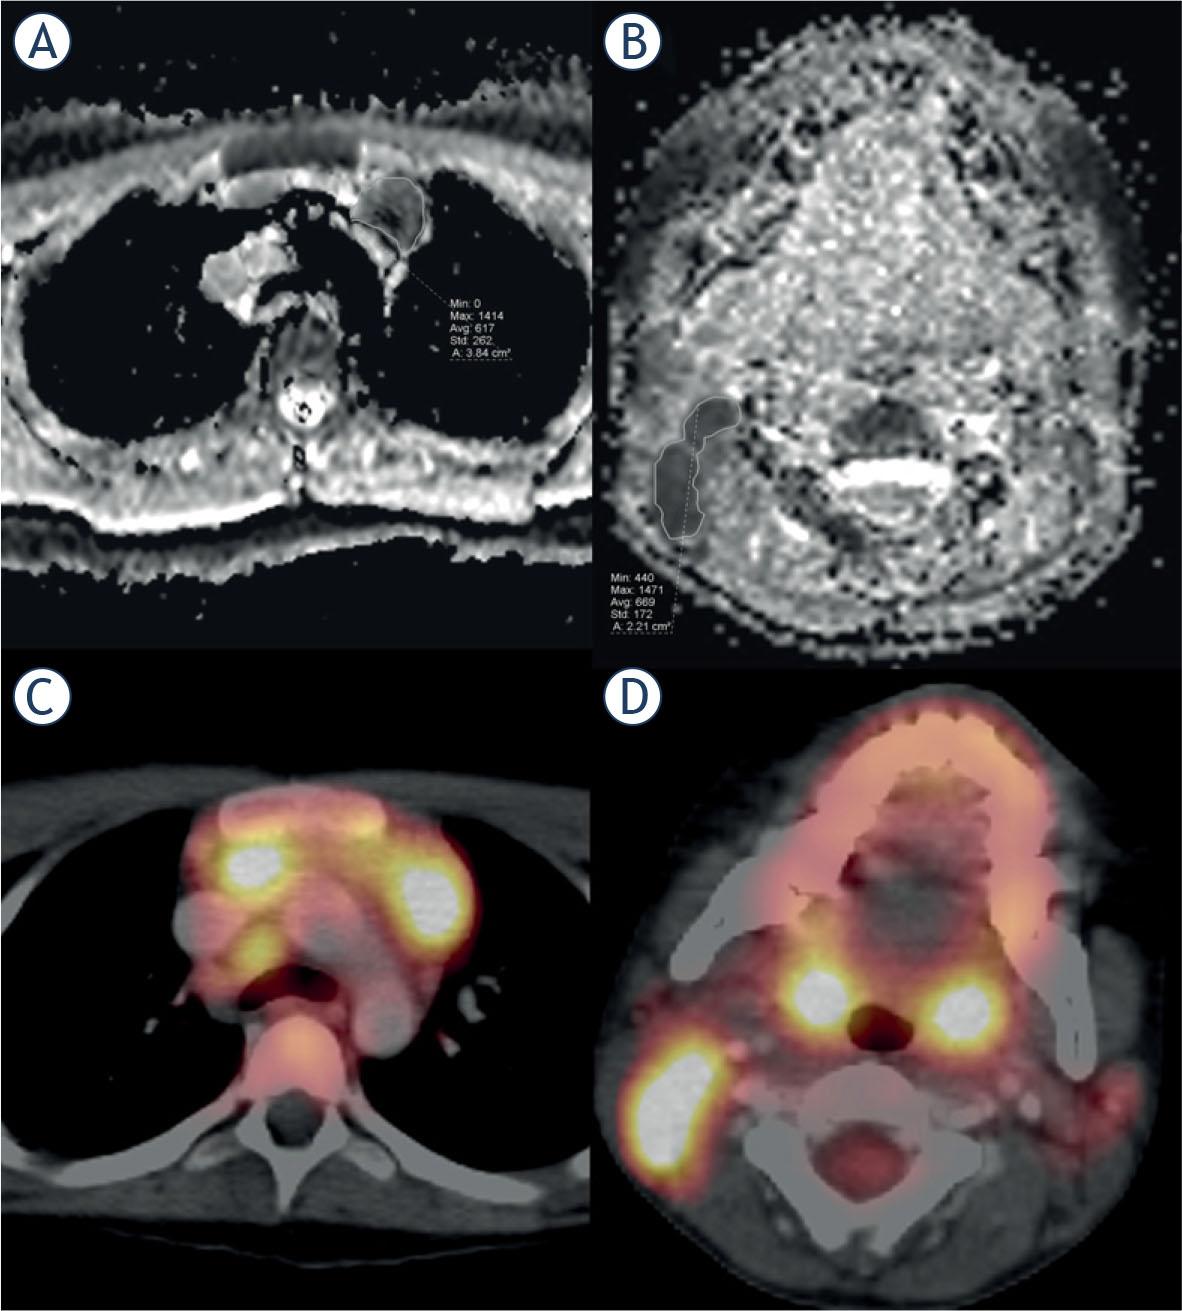
FIGURE 3.
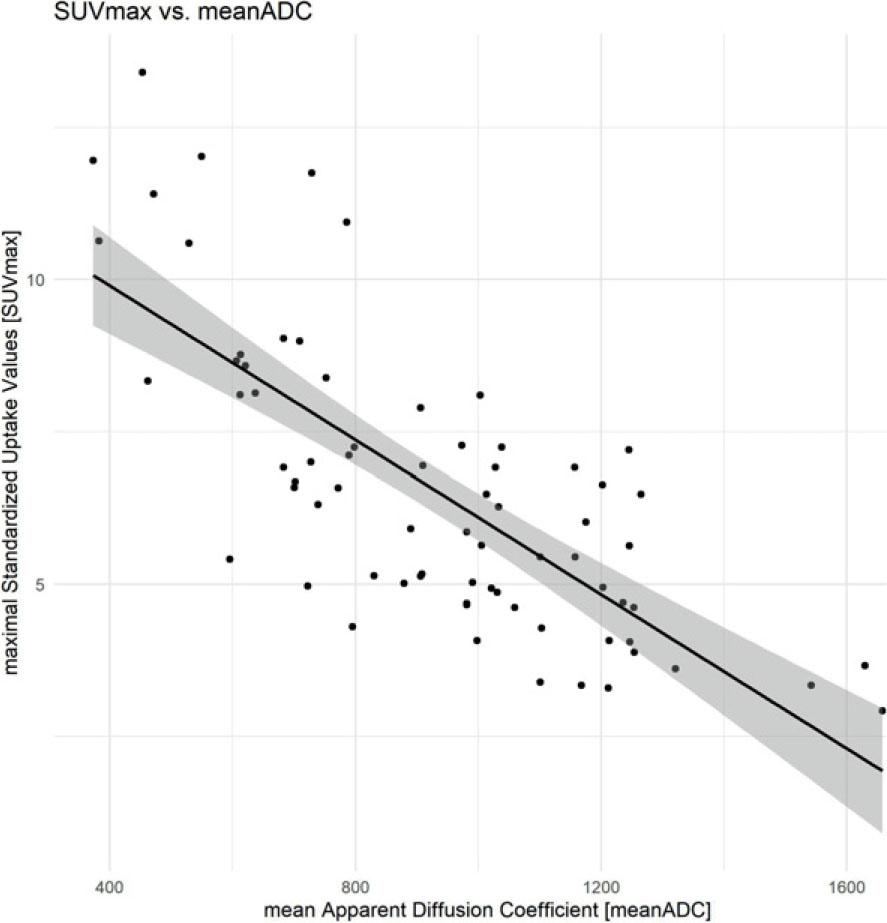
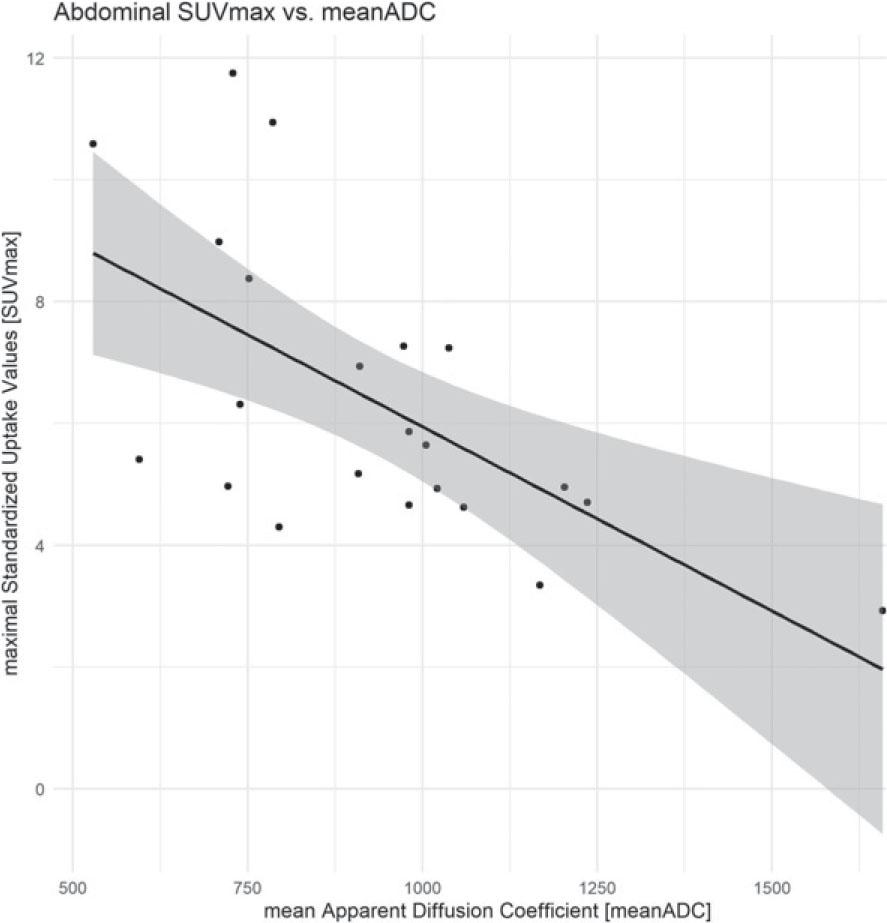
FIGURE 4.
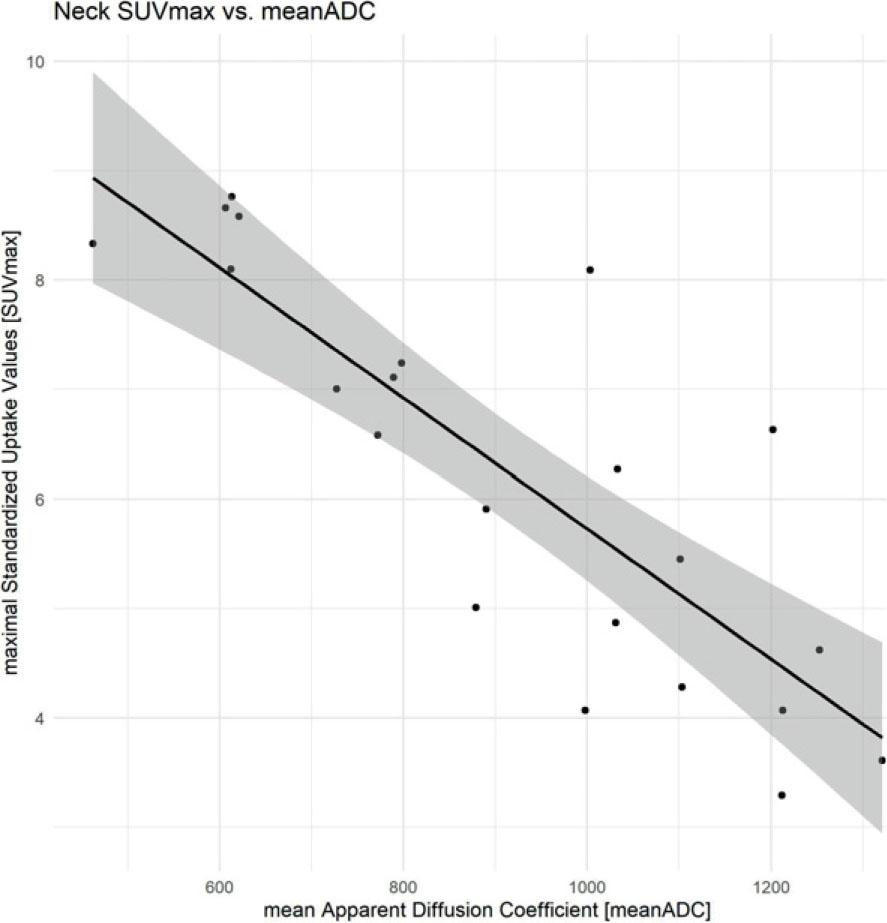
FIGURE 5.
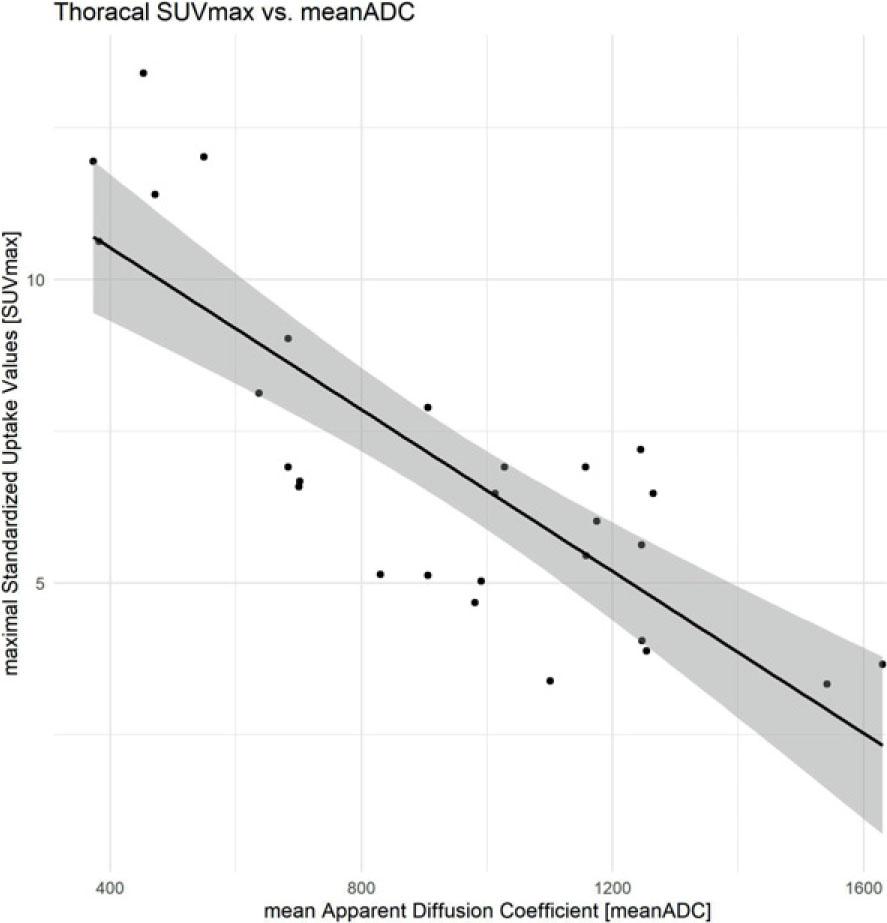
FIGURE 6.
Magnetic resonance imaging sequences
| Sequence | Orientation | Body part |
|---|---|---|
| T2w-TIRM in transversal orientation | transversal | neck |
| T1w-TSE (fat suppressed, +/− contrast media) | transversal | neck |
| T1w-TSE (no fat suppression, with substraction, +/− contrast media) | coronal | neck |
| DWI (b-values: 50, 200, 800) | transversal | neck, body |
| T2w-HASTE | coronal, sagittal and transversal | body |
| T1w-VIBE (with fat suppression) without breath-hold-imaging +/− contrast media | transversal | body |
Patient characteristics and classifications
| Variable | Retrospective cohort of patients diagnosed with Hodgkin lymphoma; baseline features |
|---|---|
| No. of patients | 17 |
| Median age (SD), years | 15.8 (2.2) |
| Sex | |
| Male | 11 (65%) |
| Female | 6 (35%) |
| Lugano classification | |
| 1 | 3 (18%) |
| 2 | 6 (35%) |
| 3 | 4 (23%) |
| 4 | 4 (23%) |
| Hodgkin lymphoma subtypes (WHO classification) | |
| Nodular sclerosis | 9 (52%) |
| Mixed cellularity | 5 (29%) |
| Lymphocyte rich | 2 (12%) |
| Lymphocyte depleted | 1 (6%) |
Radiation exposure and examination time
| Modality | CTDI [mGy] | DLP [mGy*cm] | Examination time [min] | |||
|---|---|---|---|---|---|---|
| Mean (SD) | Range | Mean (SD) | Range | Mean (SD) | Range | |
| FDG-PET/CT | 2.2 (0.8) | 1.2–4.1 | 215.1 (92.1) | 93.9–410.2 | 28 (8:26)1 | 20–49 |
| MRI | ||||||
| Neck | 19:45 (3:41) | 17:21–24:47 | ||||
| Thorax | 09:23 (2:12) | 08:01–10:29 | ||||
| Abdomen | 09:23 (2:59) | 07:32–12:21 | ||||