
Figure 1
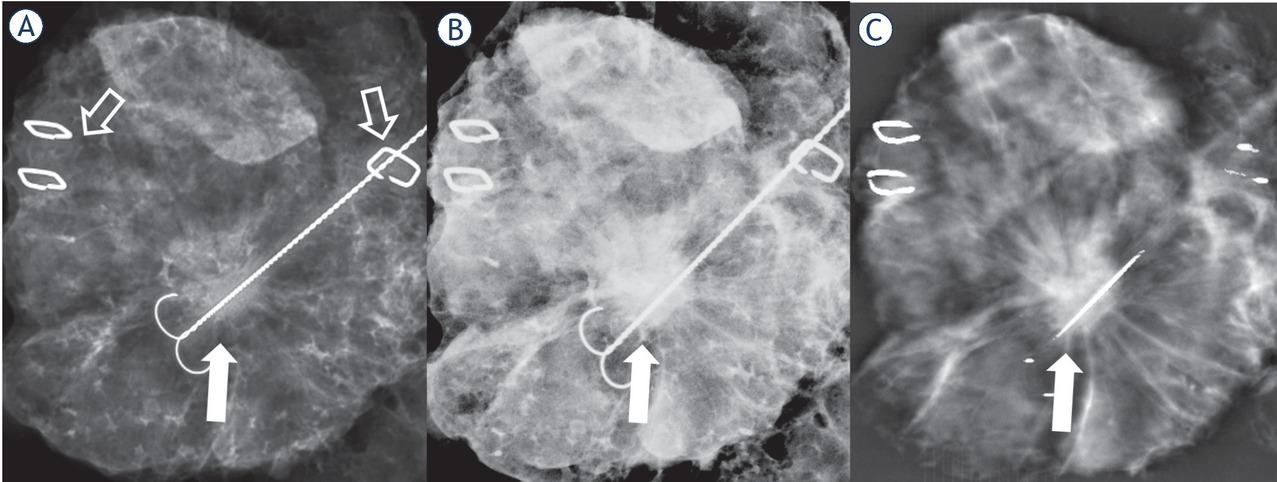
Figure 2
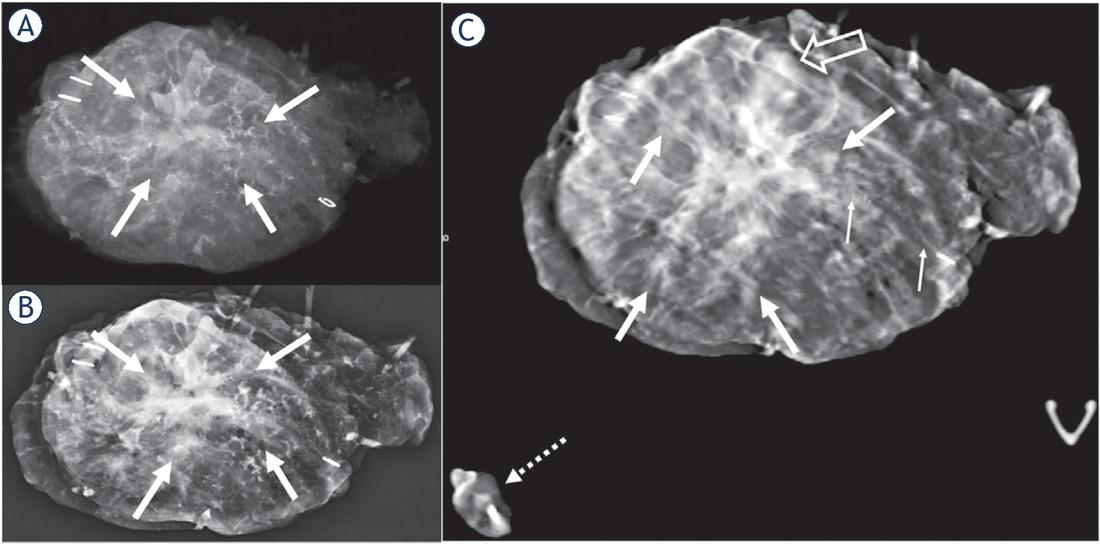
Figure 3
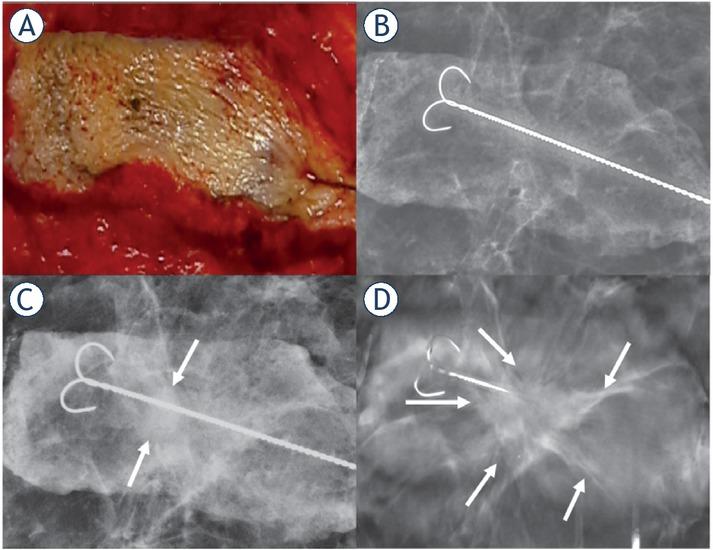
Figure 4
Characteristics of the patients, surgical procedures and tumours
| Mean age years (range) | 62.5 (33−95) |
|---|---|
| Mammography negative | 20 (9.3%) |
| Surgery | |
| Wide local excision | 158 (73.1%) |
| Oncoplastic | 58 (26.9%) |
| Specimen diameter (mm) | |
| Mean | 97.65 |
| Median | 89.0 |
| Range | 25–285 |
| Histology n (%) | |
| Invasive ductal | 120 (55.6%) |
| Invasive lobular | 27 (12.5%) |
| Mixed malignant | 7 (3.2%) |
| Pure DCIS | 26 (12.0%) |
| Other malignant | 11 (5.1%) |
| Benign | 25 (11.6%) |
| Size of tumour mean mm (range) | 15.69 (0–70) |
| Presence of DCIS | 114 (52.8%) |
| Grade | |
| 1 | 62 (28.7%) |
| 2 | 94 (43.5%) |
| 3 | 35 (16.2%) |
| T-stage | |
| Tis | 27 (14.1%) |
| T1 | 122 (63.9%) |
| T2 | 40 (20.9%) |
| T3 | 2 (1.0%) |
| N-Stage | |
| N0 | 145 (75.9%) |
| N1 | 39 (20.4%) |
| N2 | 6 (3.1%) |
| N3 | 1 (0.5%) |
| ER-Status | |
| Positive | 152 (92.2%) |
| Negative | 13 (7.8%) |
| PR-Status | |
| Positive | 147 (89.2%) |
| Negative | 18 (10.8%) |
| HER2-Status | |
| Positive | 12 (7.3%) |
| Negative | 153 (92.7) |
Evaluated parameters of the specimen with three different imaging modalities by both observers
| Margins | > 10mm | 6–10 | ≤ 5mm | |||||||
|---|---|---|---|---|---|---|---|---|---|---|
| Observer | 1 | 2 | 1 | 2 | 1 | 2 | ||||
| Tomosynthesis | 156 | 114 | 20 | 37 | 19 | 49 | ||||
| SRS | 132 | 126 | 15 | 15 | 8 | 23 | ||||
| FFDM | 158 | 135 | 14 | 38 | 13 | 28 | ||||
| Diagnostic Certainty | Not at all | Somehow Certain | Average | Almost Certain | Completely Certain | |||||
| Observer | 1 | 2 | 1 | 2 | 1 | 2 | 1 | 2 | 1 | 2 |
| Tomosynthesis | 21 | 19 | 12 | 6 | 15 | 22 | 40 | 46 | 128 | 123 |
| SRS | 61 | 53 | 21 | 12 | 22 | 26 | 59 | 40 | 53 | 85 |
| FFDM | 32 | 23 | 13 | 19 | 18 | 34 | 61 | 53 | 92 | 87 |
| Lesion Visibility | 0% | 0−10% | 10−50% | 50−90% | 90−100% | |||||
| Observer | 1 | 2 | 1 | 2 | 1 | 2 | 1 | 2 | 1 | 2 |
| Tomosynthesis | 22 | 16 | 15 | 18 | 13 | 24 | 34 | 40 | 132 | 118 |
| SRS | 60 | 50 | 20 | 51 | 26 | 50 | 65 | 35 | 45 | 30 |
| FFDM | 32 | 21 | 15 | 27 | 18 | 40 | 57 | 60 | 94 | 68 |
| Spiculation visibility | Not visible | Partially visible | Completely visible | No spiculations | ||||||
| Observer | 1 | 2 | 1 | 2 | 1 | 2 | 1 | 2 | ||
| Tomosynthesis | 1 | 8 | 23 | 30 | 45 | 103 | 147 | 75 | ||
| SRS | 11 | 32 | 43 | 68 | 3 | 5 | 159 | 111 | ||
| FFDM | 5 | 31 | 54 | 67 | 9 | 42 | 148 | 76 | ||
| Calcifications | Present | Less visible | Equally visible | More visible | ||||||
| Observer | 1 | 2 | 1 | 2 | 1 | 2 | 1 | 2 | ||
| Tomosynthesis | 48 | 53 | 4 | 13 | 25 | 30 | 19 | 10 | ||
| SRS | 47 | 41 | 40 | 30 | 7 | 9 | 0 | 2 | ||
| FFDM | 49 | 53 | 18 | 28 | 28 | 21 | 3 | 4 | ||
Mammographic features and lesion descriptors according to the Breast Imaging Reporting and Data System, 5th Edition
| Breast density | |||||||
|---|---|---|---|---|---|---|---|
| A | 57 | B | 121 | C | 34 | D | 4 |
| Peritumoral density % | |||||||
| < 25% | 90 | 25%–50% | 20 | 50%–75% | 24 | 75%–100% | 60 |
| Mass Shape | |||||||
| Oval | 17 | Round | 70 | Irregular | 58 | ||
| Mass Margin | |||||||
| Circumscribed | 4 | Obscured | 7 | Microlobulated | 36 | ||
| Indistinct | 27 | Spiculated | 71 | ||||
| Calcifications | |||||||
| Amorphous | 2 | Fine Pleomorphic | 42 | ||||
| Coarse Heterogenous | 2 | Fine linear or branching | 7 | ||||
| Calcification distribution | |||||||
| Regional | 9 | Linear | 6 | ||||
| Grouped | 33 | Segmental | 5 | ||||
| Architectural Distortion | |||||||
| Yes | 15 | No | 201 | ||||
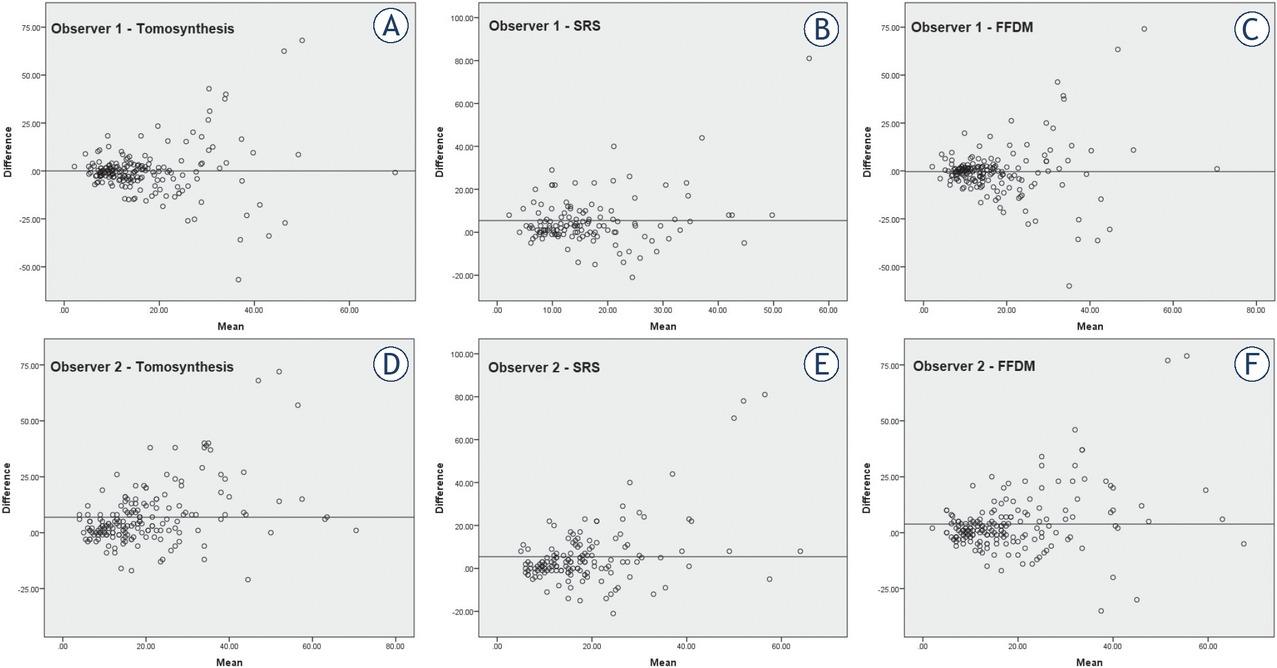
Diameters of the excised lesions evaluated by the two observers using three imaging modalities and in the final pathology report
| Lesion diameter | Mean (mm) | Median (mm) | Minimum (mm) | Maximum (mm) | Pearson’s coefficient (r) |
|---|---|---|---|---|---|
| Observer 1 | |||||
| Tomosynthesis | 16.82 | 12.70 | 2.90 | 84.10 | 0.471 |
| SRS | 17.45 | 13.90 | 2.10 | 96.90 | 0.421 |
| FFDM | 16.96 | 12.60 | 2.00 | 90.10 | 0.452 |
| Observer 2 | |||||
| Tomosynthesis | 23.04 | 19.00 | 4.00 | 88.00 | 0.614 |
| SRS | 21.31 | 17.00 | 5.00 | 97.00 | 0.457 |
| FFDM | 20.21 | 15.00 | 3.00 | 95.00 | 0.550 |
| Final Pathology | |||||
| 15.69 | 14.00 | 0 | 70 |
The preferred imaging modalities for individual lesions selected by the two observers
| Observer 1 | Observer 2 | |
|---|---|---|
| Tomosynthesis | 166 (76.9%) | 166 (76.9%) |
| SRS | 1 (0.5%) | 6 (2.8%) |
| FFDM | 21 (9.7%) | 14 (6.5%) |
| All equal | 5 (2.3%) | 12 (5.6%) |
| None | 23 (10.6%) | 18 (8.3%) |