
Table 1
3 Tesla Siemens and 3 Tesla Philips MRI protocols
| SIEMENS VERIO 3.0T | |||||||
|---|---|---|---|---|---|---|---|
| FOV (mm) | Matrix (mm) | Slice thickness (mm) | TR (ms) | TE (ms) | Voxel size (mm) | TA (min) | |
| T1 COR | 300 | 390/320 | 5 | 500 | 8.7 | 0.9×0.9×5.0 | 01:36 |
| T2 SAG | 200 | 320/320 | 4 | 3300 | 133 | 0.6×0.6×4.0 | 03:44 |
| T2 paracor | 200 | 320/320 | 4 | 3700 | 140 | 0.6×0.6×4.0 | 03:24 |
| T2 paracor +FS | 200 | 256/256 | 4 | 3700 | 131 | 0.8×0.8×4.0 | 01:58 |
| T2 paratra | 200 | 320/320 | 4 | 3740 | 148 | 0.6×0.6×4.0 | 03:29 |
| T2 paratra + FS | 200 | 256/256 | 4 | 3700 | 138 | 0.8×0.8×4.0 | 02:13 |
| T1 SAG | 160 | 217/192 | 4 | 569 | 12 | 0.4×0.4×4.0 | 03:44 |
| T1 vibe dixon AX | 380 | 188/320 | 3.5 | 3.92 | 1.27 | 0.6×0.6×3.5 | 00:19 |
| DWI AX (b50-400-800) | 360 | 100/128 | 5 | 4700 | 57 | 1.4×1.4×5.0 | 02:49 |
| POST C | |||||||
| T1 vibe dixon AX | 380 | 188/320 | 3.5 | 3.92 | 1.27 | 0.6×0.6×3.5 | 00:19 |
| T1 SAG | 160 | 217/192 | 4 | 569 | 12 | 0.4×0.4×4.0 | 03:44 |
| T1 COR | 300 | 390/320 | 5 | 500 | 8.7 | 0.9×0.9×5.0 | 01:36 |
| PHILIPS INGENIA 3.0T | |||||||
| COR STIR | 340 | 228/186 | 5 | 5622 | 50 | 1.5×1.5×5.0 | 03:45 |
| T2 SAG | 229 | 208/208 | 3 | 3776 | 100 | 1.1×1.1×3.0 | 03:01 |
| COR T2 | 315 | 392/297 | 5 | 4846 | 90 | 0.8×1.6×5.0 | 01:56 |
| COR T1 | 315 | 392/315 | 5 | 483 | 8 | 0.8×1.2×5.0 | 02:11 |
| AX T2 | 261 | 328/251 | 5 | 4805 | 100 | 0.8×1.0×5.0 | 02:05 |
| AX T2 FS | 261 | 236/208 | 5 | 4346 | 80 | 1.11×1.25×5.0 | 02:37 |
| DWI 3b 0,100,800 | 375 | 124/106 | 4 | 5299 | 77 | 3.0×3.0×4.0 | 01:51 |
| POST C | |||||||
| MDixon AX | 240 | 220/222 | 3,5 | 5.4 | 1.96 | 1.09×1.08×3.5 | 02:58 |
| COR T1 FS | 315 | 392/309 | 5 | 519 | 8 | 0.8×1.02×5.0 | 02:17 |
Table 2
Results of 124 ovarian masses according to their MRI features
| Malignant | Benign | Borderline | |
|---|---|---|---|
| Cystic masses | 5/41 (12.2%) | 61/71 (85.9%) | 6/12 (50%) |
| Solid masses | 10/41 (24.4%) | 4/71 (5.6%) | 2/12 (16.6%) |
| Mixed masses | 26/41 (63.4%) | 6/71 (8.5%) | 4/12 (33.4%) |
| Cases with one ovary involvement | 18/30 (60%) | 46/58 (79.3%) | 9/10 (90%) |
| Cases with both ovaries’ involvement | 12/30 (40%) | 12/58 (20.7%) | 1/10 (10%) |
| Size of the mass (more than 4 cm) | 37/41 (90.2%) | 22/71 (31%) | 8/12 (66.7%) |
| Masses with adipose tissue presence | - | 5/71 (7%) | 1/12 (8.3%) |
| Masses with high signal intensity in T2WI | 5/41 (12.2%) | 42/71 (59.1%) | 5/12 (41.6%) |
| Masses with low signal intensity in T2WI | 7/41 (17.1%) | 18/71 (25.4%) | 1/12 (8.4%) |
| Heterogeneous masses | 29/41 (70.7%) | 11/71 (15.5%) | 6/12 (50%) |
| Diffusion restriction | 39/41 (95.1%) | 19/71 (26.8%) | 7/12 (58.4%) |
| Wall thickness (more than 3 mm) | 20/41 (48.8%) | 12/71 (16.9%) | 5/12 (41.7%) |
| Presence of septa | 25/41 (61%) | 11/71 (15.5%) | 5/12 (41.7%) |
| Papillary projections presented | 14/41 (34.1%) | - | 2/12 (16.6%) |
| Cases with presence of ascites | 16/30 (53.3%) | 15/58 (25.9%) | 2/10 (20%) |
| Lymph nodes involvement and metastases | 20/30 (66.6%) | 3/58* (5.2%) | 1/10 (10%) |
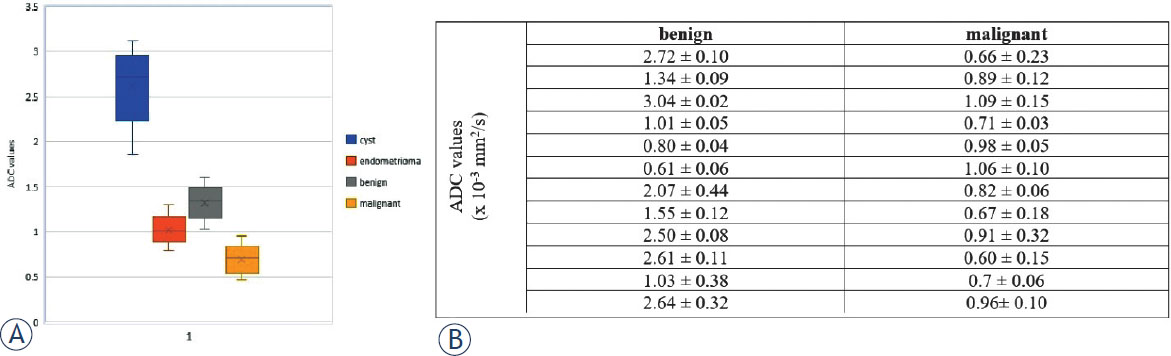
Figure 1
(A) Box plot presenting ADC values in four different types of adnexal tumors – highest ADC value found in a simple cyst; lowest found in a malignant tumor. (B) Mean apparent diffusion coefficient (ADC) values of twelve patients with histologically proven benign adnexal lesion and twelve patients with histologically proven malignant adnexal lesion. All values are expressed as mean value ± standard deviation (SD) x 10 -3 mm 2 /s.
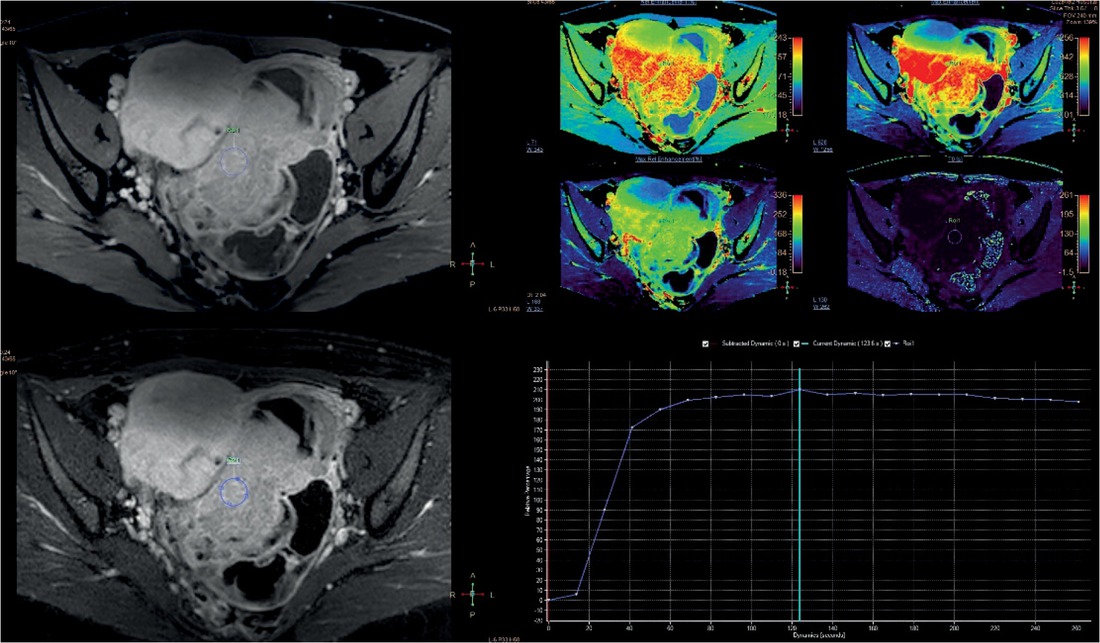
Figure 2
Type III time intensity curve (TIC) of a malignant adnexal mass.
Table 3
Diffusion MRI appearance of histologically different groups
| Histopathological findings | DWI restricted | DWI Facilitated |
|---|---|---|
| Simple cyst | - | 5 |
| Inclusion cyst | - | 1 |
| Abscess | 1 | - |
| Endometrioma | 12 | 5 |
| Teratoma | 5 | - |
| Serous cystadenoma | - | 2 |
| Mucinous cystadenoma | 1 | 1 |
| Serous adenofibroma | 1 | - |
| Serous cystadenofibroma | 1 | - |
| Brenner tumor | - | 1 |
| Seromucinous carcinoma | 2 | - |
| Serous papillary adenocarcinoma | 2 | - |
| Adenosarcoma | 1 | - |
| Metastases | 6 | - |
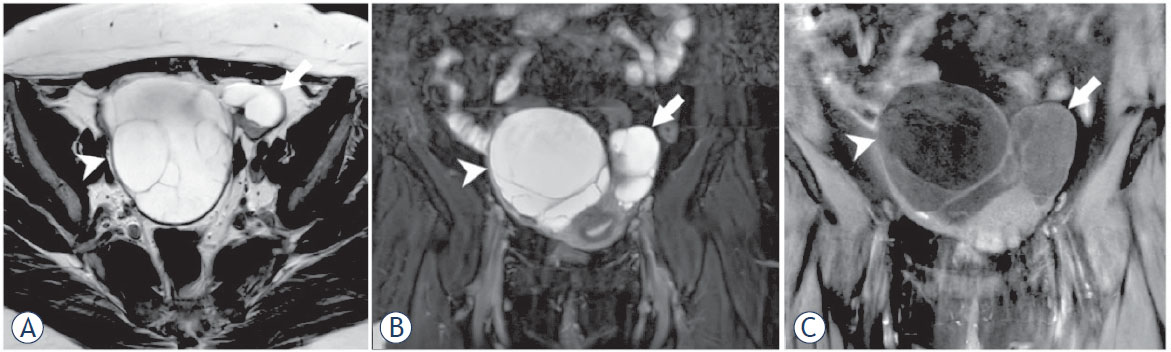
Figure 3
45-year old patient with bilateral adnexal masses; serous papillary cystadenoma (arrow) and mucinous cystadenoma (arrowhead); both masses have predominantly high signal intensity on T2WI and T2WI fat sat (A), (B) and low signal intensity on T1WI fat sat (C).
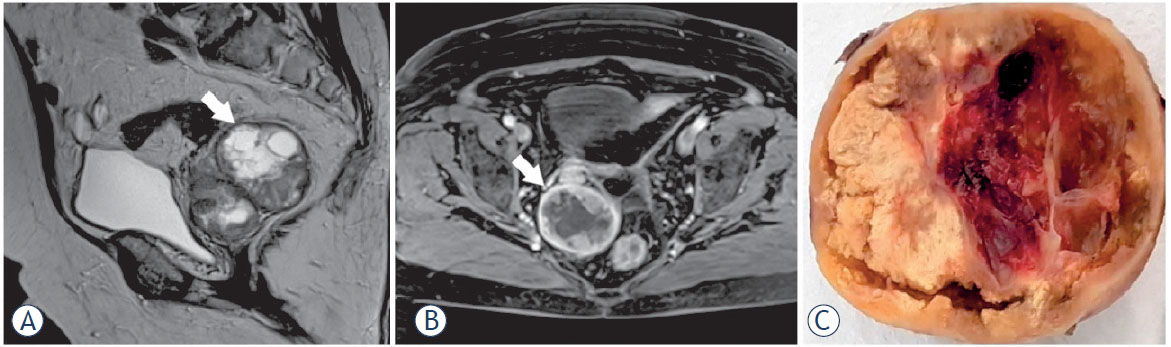
Figure 4
68-year old patient with previous hysterectomy; right serous cystadenofibroma (arrow); complex mass - heterogeneous on T2WI (A) which shows peripheral enhancement on T1WI fat sat with contrast (B). (C) Macroscopic histological preparation of the tumor.
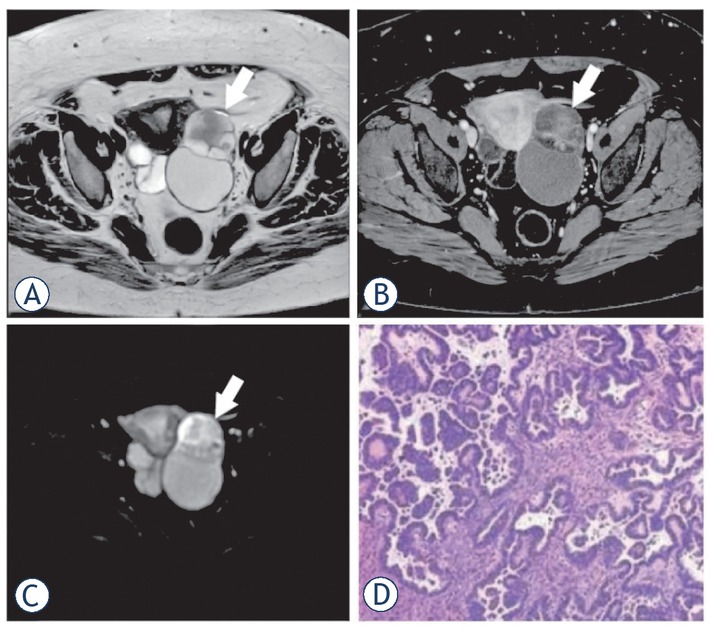
Figure 5
57- year old patient with left serous papillary adenocarcinoma (arrow); predominantly cystic mass with high signal intensity on T2WI (A) and solid component which is enhanced on T1WI fat sat with contrast (B). Part of the mass characterizes with diffusion restriction (C). (D) Microscopy preparation of the tumor.
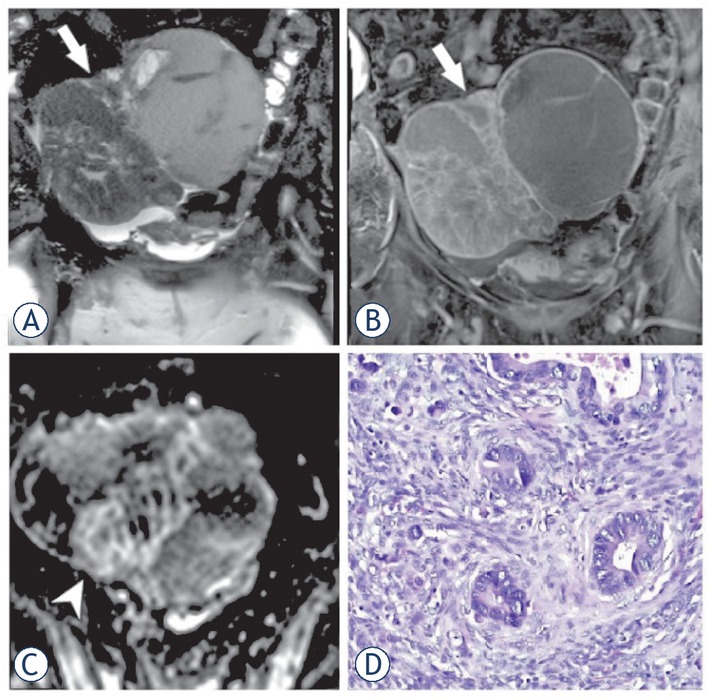
Figure 6
63- year old patient with right ovarian metastasis from adenocarcinoma with intestinal phenotype; complex septated mass with heterogeneous signal intensity on T2WI (A); enhancement mostly in wall and septi on T1WI fat sat with contrast (B); part of the mass (arrowhead) has restricted diffusion; (D) Microscopy preparation of the metastasis.
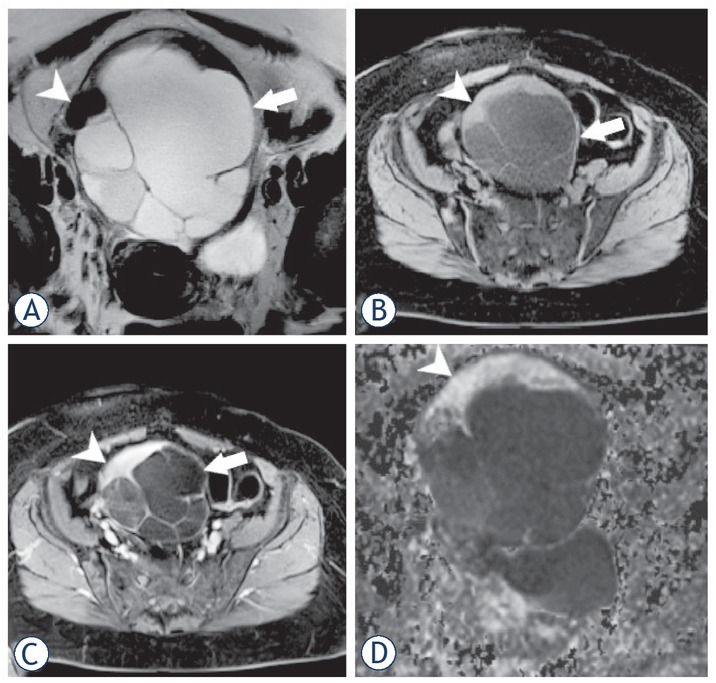
Figure 7
54- year old patient with mucinous cystadenoma (arrow) coexisting with benign Brenner tumor (arrowhead); mucinous cystadenoma has high signal intensity on T2WI (A) and low on T1WI fat sat (B); compared to it Brenner tumor has low signal intensity on T2WI (A) and high on T1WI fat sat (B); on T1 fat sat with contrast (C) only Brenner tumor shows enhancement and on DWI (D) only Brenner tumor shows restricted diffusion.