
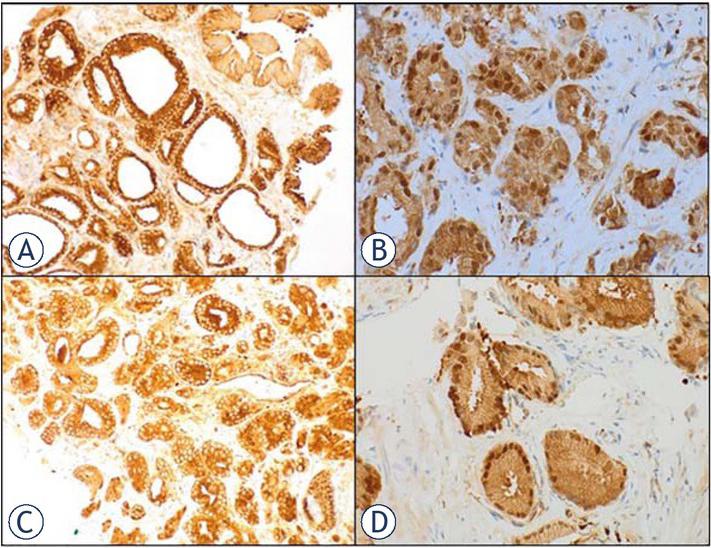
Figure 1
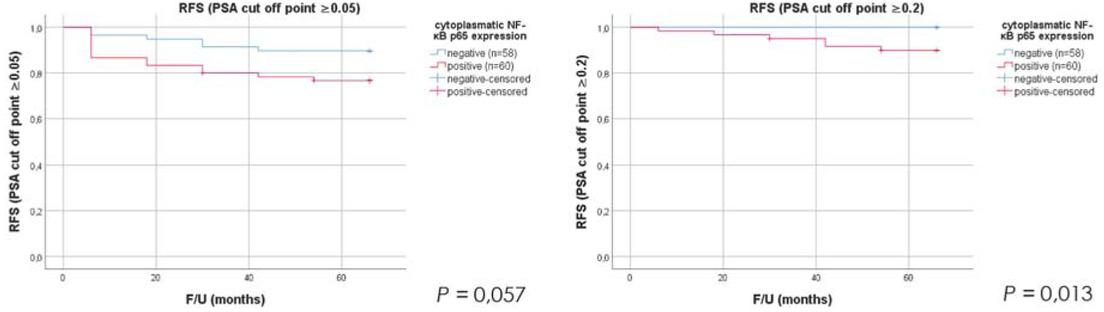
Figure 2
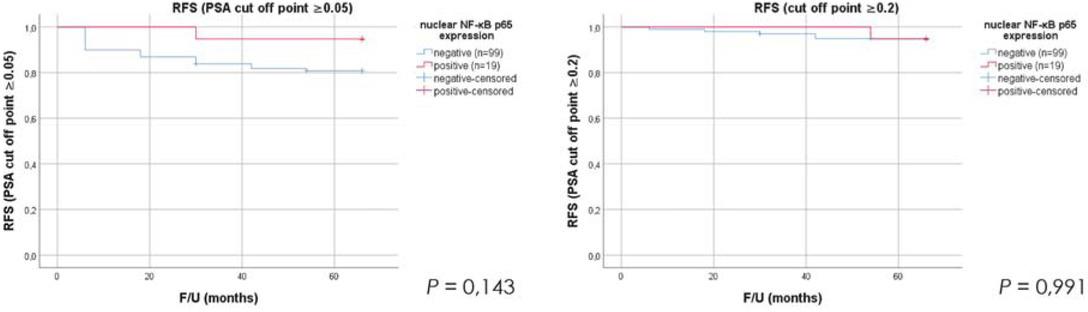
Figure 3
Nuclear factor-kappa beta (NF-κB) p65 expression status in biopsy group GS 6 and control biopsy group GS 7
| N | NF-κB p65 expression | P | ||
|---|---|---|---|---|
| negative | positive | |||
| 3+3=6 | 123 | 103 | 20 | |
| 3+4=7 | 30 | 24 | 6 | 0.596* |
| 4+3=7 | 30 | 17 | 13 | 0.003** |
Multivariate analysis of nuclear factor-kappa beta (NF-κB) p65 expression and other clinicopathologic variables associated with recurrence-free survival (RFS; recurrence defined as PSA ≥ 0_05)
| Hazard ratio (95% CI) | P | |
|---|---|---|
| NF-(negative κB p65 expression vs. positive) | 0.254 (0.034–1.915) | 0.184 |
| Postoperative score (6 vs. 7) Gleason | 1.078 (0.400–2.907) | 0.882 |
| Surgical (negative margin vs. positive) | 4.838 (1.674–13.983) | 0.004 |
| Pathologic (T2 vs. T3) stage | 1.232 (0.409–3.705) | 0.711 |
Association of nuclear factor-kappa beta (NF-κB) p65 expression status in cytoplasm with pathological findings
| N = 123 | N | NF-κB p65 expression | P | |
|---|---|---|---|---|
| negative | positive | |||
| pT status | ||||
| pT2 | 96 | 48 | 48 | |
| pT3 | 27 | 12 | 15 | 0.667* |
| Surg. m. | ||||
| Negative | 110 | 53 | 7 | |
| Positive | 13 | 7 | 6 | 0.774** |
| GS | ||||
| 3 + 3 = 6 | 79 | 39 | 40 | |
| 3 + 4 = 7 | 37 | 17 | 20 | |
| 4 + 3 = 7 | 7 | 5 | 2 | 0.465*** |
Association of nuclear factor-kappa beta (NF-κB) p65 expression status in nucleus with pathological findings
| N = 123 | N | NF-κB p65 expression | P | |
|---|---|---|---|---|
| negative | positive | |||
| pT status | ||||
| pT2 | 96 | 81 | 15 | |
| pT3 | 27 | 22 | 5 | 0.769* |
| Surg. m. | ||||
| Negative | 110 | 92 | 18 | |
| Positive | 13 | 11 | 2 | 1** |
| GS | ||||
| 3 + 3 = 6 | 79 | 66 | 13 | |
| 3 + 4 = 7 | 37 | 31 | 6 | |
| 4 + 3 = 7 | 7 | 6 | 1 | 0.989*** |
Multivariate analysis of cytoplasmic nuclear factor-kappa beta (NF-κB) p65 expression and other clinicopathologic variables associated with recurrence-free survival (RFS)
| Hazard ratio (95% CI) | P | |
|---|---|---|
| Cytoplasmic NF-κB p65 expression (negative vs. positive) | 2.367 (0.908–6.170) | 0.078 |
| Postoperative Gleason score (6 vs. 7) | 1.105 (0.406–3.008) | 0.845 |
| Surgical (negative margin vs. positive) | 4.845 (1.646–14.260) | 0.004 |
| Pathologic (T2 vs. T3) stage | 1.041 (0.339–3.194) | 0.944 |
Cytoplasmic nuclera factor-kappa beta (NF-κB) p65 expression status in biopsy group postoperative Gleason score (GS) 6 and control biopsy group postoperative GS 7
| N | NF-κB p65 expression | P | ||
|---|---|---|---|---|
| negative | positive | |||
| 3 + 3 = 6 | 123 | 60 | 63 | |
| 3 + 4 = 7 | 30 | 3 | 27 | <0.001* |
| 4 + 3 = 7 | 30 | 0 | 30 | <0.001** |
Patient characteristics
| General, N = 123 | |||
|---|---|---|---|
| Mean Age, year, (range) | 63.6 (50–75) | ||
| Mean init. PSA, ng/ml, (range) | 5.32 (1,32–9,51) | ||
| Mean Prostate V, ml, (range) | 38.3 (14–97) | ||
| Mean Biopsy cores, n, (range) | 9.6 (8–10) | ||
| Total Biopsy cores, n | 1.180 | ||
| Clinical stage | |||
| T1, n, (%) | 113 (91.9) | ||
| T2, n, (%) | 10 (8.1) | ||
| Biopsy GS 3+3=6, n, (%) | 123 (100) | ||
| Surgery | |||
| ELRP, n, (%) | 87 (70.7) | ||
| N-S ELRP, n, (%) | 36 (29.3) | ||