
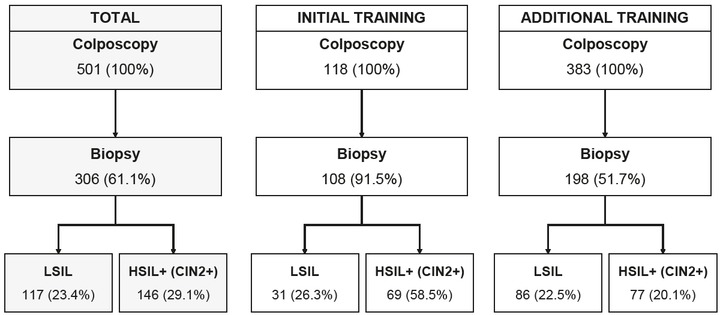
Figure 1
Study flow chart with histopathology follow-up results.
Table 1
p16/Ki-67 study results and CIN2+ outcome for students, senior cytotechnologist and reference
| Reviewer | Categories of p16/Ki67 dual staining result | Initial training (N = 118) | Additional training (N = 383) | ||
|---|---|---|---|---|---|
| p16/Ki67 dual staining result N, (%) | CIN2+ outcomes N (PV, %)* | p16/Ki67 dual staining result (N, %) | CIN2+ outcomes N (PV, %)* | ||
| positive | 91 (77.1) | 65 (71.4) | 171 (44.6) | 65 (38.0) | |
| S1 | suspicious | 7 (5.9) | 2 (28.6) | 7 (1.8) | 2 (28.6) |
| negative | 20 (16.9) | 2 (10.0) | 205 (53.5) | 10 (4.9) | |
| unsatisfactory | 0 (0.0) | 0 (0.0) | 0 (0.0) | 0 (0.0) | |
| positive | 92 (78.0) | 66 (71.7) | 129 (33.7) | 64 (49.6) | |
| S2 | suspicious | 2 (1.7) | 0 (0.0) | 1 (0.3) | 1 (100.0) |
| negative | 24 (20.3) | 3 (12.5) | 253 (66.1) | 12 (4.7) | |
| unsatisfactory | 0 (0) | 0 (0.0) | 0 (0.0) | 0 (0.0) | |
| positive | 83 (70.3) | 65 (78.3) | 143 (37.9) | 65 (45.5) | |
| suspicious | 2 (1.7) | 2 (100.0) | 5 (1.3) | 0 (0.0) | |
| SC (S1) | negative | 32 (27.1) | 2 (6.3) | 235 (61.4) | 12 (5.1) |
| unsatisfactory | 1 (0.8) | 0 (0.0) | 0 (0.0) | 0 (0.0) | |
| positive | 83 (70.3) | 65 (78.3) | 145 (37.9) | 64 (44.1) | |
| suspicious | 2 (1.7) | 2 (100.0) | 4 (1.0) | 0 (0.0) | |
| SC (S2) | negative | 32 (27.1) | 2 (6.3) | 234 (61.1) | 13 (5.6) |
| unsatisfactory | 1 (0.8) | 0 (0.0) | 0 (0.0) | 0 (0.0) | |
| positive | 78 (66.1) | 64 (82.1) | 114 (29.8) | 64 (56.1) | |
| Reference | suspicious | 2 (1.7) | 0 (0) | 13 (3.4) | 3 (23.1) |
| negative | 38 (32.2) | 5 (13.2) | 255 (66.6) | 10 (3.9) | |
| unsatisfactory | 0 (0.0) | 0 (0.0) | 1 (0.3) | 0 (0.0) | |
[i] N = number of cases; Reference = results of four cytopathologists at the Deptment of Cytopathology, Institute of Oncology Ljubljana; S1 = student 1; S2 = student 2; SC (S1) = senior cytotechnologist results obtained during revision of student 1 results; SC (S2) = senior cytotechnologist results obtained during revision of student 2 results; * PV = predictive value (number of CIN2+detected within specific category of p16/Ki-67 dual staining result divided by the number of test results in specific category)
Table 2
Individual comparison of p16/Ki-67 agreement and performance between students, senior technologist and reference
| Training | Reviewers | OPA | McNemar’s test p | κ (cohen) (95% CI) |
|---|---|---|---|---|
| S1/Reference | 81.4% | 0.000 | 0.512 (CI: 0.329–0,696) | |
| S2/Reference | 81.4% | 0.006 | 0.527 (CI: 0.349–0,705) | |
| Initial training | SC (S1)/ Reference | 94.1% | 0.131 | 0.859 (CI: 0.758–0.960) |
| (N = 118) | SC (S2)/ Reference | 94.1% | 0.131 | 0.859 (CI: 0.758–0.960) |
| SC (S1)/SC (S2) | 100.0% | / | 1.000 (CI: /) | |
| S1/Reference | 78.3% | 0.000 | 0.556 (Cl: 0.472–0.641) | |
| S2/Reference | 87.2% | 0.775 | 0.713 (Cl: 0.638–0.788) | |
| Addtional (N = 383) | SC (S1)/Reference | 86.2% | 0.006 | 0.700 (Cl: 0.625–0,775) |
| SC (S2)/Reference | 86.4% | 0.004 | 0.707 (Cl: 0.632–0.781) | |
| SC (S1)/SC (S2) | 98.7% | 1.000 | 0.973 (CI: 0.949–0.996) |
[i] N = number of cases; OPA = overall percent agreement; S1 = student 1; S2 = student 2; SC (S1) = senior cytotechnologist results obtained during revision of student 1 results; SC (S2) = senior cytotechnologist results obtained during revision of student 2 results; SC1/SC2 = intra-observer variability; Reference = results of four cytopathologists at the Deptment of Cytopathology, Institute of Oncology Ljubljana; * Scale for interpretation of κ values = below 0.20 (poor), 0.21-0.40 (fair), 0.41-0.60 (moderate), 0.61-0.80 (good), >0.81 (very good)10
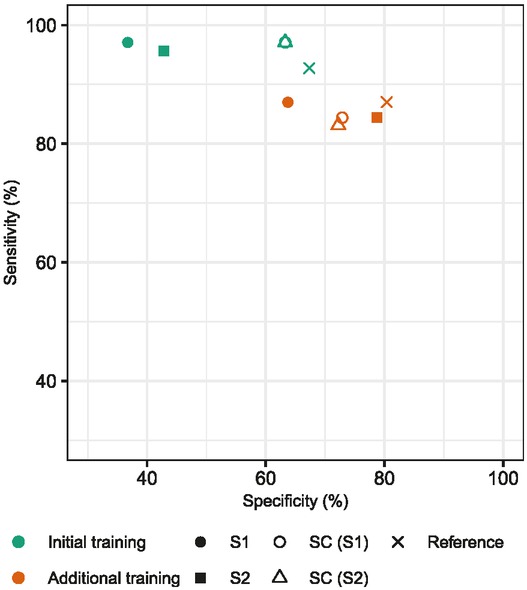
Figure 2
Sensitivity and specificity of p16/Ki-67 dual immunocytochemical staining (DS) for detecting CIN2+ for both students and the teacher (senior cytotechnologist).
S1= student 1; S2 = student 2; SC (S1) = senior cytotechnologist – slide review after S1; SC (S2) = senior cytotechnologist – slide review after S2
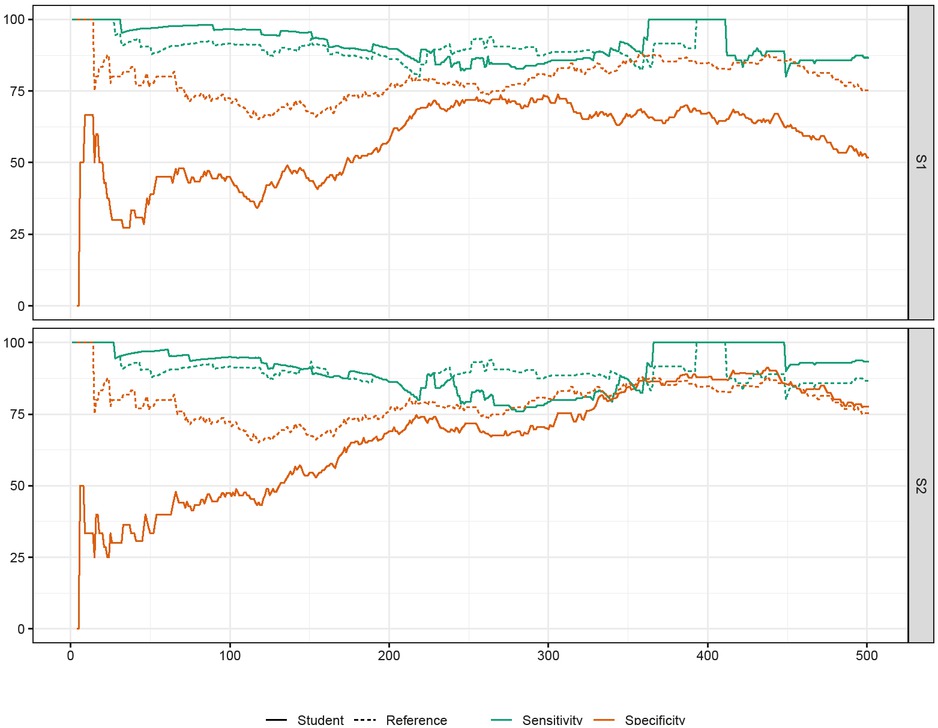
Figure 3
Sensitivity and specificity for the results of both students and the reference according to the number of evaluated slides.
S1 = student 1; S2 = student 2
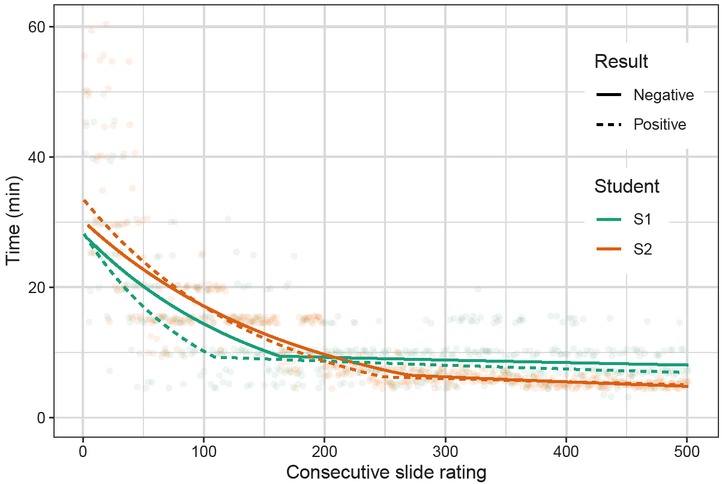
Figure 4
Joinpoint regression analysis of students’ screening times.
S1 = student 1; S2 = student 2