
Figure 1
Mean score (MS) and standard deviations (SD) for all EORTC QLQ-C30 dimensions and scales by age for general population
| 40–49 | 50–59 | 60–69 | 70 and older | p* | |||||
|---|---|---|---|---|---|---|---|---|---|
| MS | SD | MS | SD | MS | SD | MS | SD | ||
| Global health status/quality of life | 69.1 | 18.6 | 71.1 | 20.7 | 67.4 | 19.9 | 56.9 | 23.9 | .035 |
| Physical functioning | 86.2 | 12.9 | 83.9 | 16.9 | 81.8 | 21.7 | 61.2 | 30.2 | .000 |
| Role functioning | 86.1 | 20.6 | 85.9 | 20.2 | 80.8 | 28.6 | 69.1 | 37.2 | .128 |
| Emotional functioning | 71.9 | 22.4 | 78.2 | 19.7 | 78.6 | 19.7 | 66.7 | 26.4 | .034 |
| Cognitive functioning | 80.6 | 21.7 | 85.7 | 17.8 | 85.6 | 17.4 | 80.8 | 26.3 | .402 |
| Social functioning | 86.8 | 20.1 | 90.6 | 15.5 | 88.5 | 20.8 | 76.5 | 31.0 | .049 |
| Fatigue | 33.7 | 20.8 | 28.0 | 22.7 | 29.5 | 22.8 | 43.8 | 29.2 | .014 |
| Nausea/vomiting | 6.9 | 14.2 | 4.9 | 11.3 | 4.6 | 10.4 | 10.3 | 20.1 | .276 |
| Pain | 25.8 | 24.3 | 23.3 | 24.5 | 24.1 | 27.8 | 40.2 | 32.3 | .028 |
| Dyspnoea | 18.8 | 24.6 | 17.3 | 23.6 | 22.1 | 25.9 | 26.5 | 30.6 | .362 |
| Insomnia | 24.4 | 28.7 | 26.3 | 30.2 | 30.7 | 30.5 | 41.2 | 37.7 | .094 |
| Appetite loss | 6.9 | 15.2 | 5.3 | 13.7 | 8.2 | 15.6 | 24.5 | 34.1 | .001 |
| Constipation | 8.2 | 18.0 | 8.3 | 19.2 | 13.8 | 21.9 | 14.7 | 28.7 | .164 |
| Diarrhoea | 7.9 | 15.8 | 6.5 | 13.9 | 6.2 | 13.0 | 13.7 | 26.1 | .595 |
| Financial difficulties | 7.6 | 17.7 | 7.4 | 17.7 | 14.4 | 26.9 | 22.5 | 33.6 | .009 |
| Summary score | 83.1 | 12.5 | 85.8 | 12.2 | 82.9 | 15.0 | 72.6 | 23.7 | .030 |
Mean score (MS) and standard deviation (SD) for all QLQ-MY20 scales in multiple myeloma (MM) patients before and after chemotherapy and transplantation
| MM–before chemotherapy | MM–after chemotherapy | p* | MM–before transplantation | MM–after transplantation | p* | |||||
|---|---|---|---|---|---|---|---|---|---|---|
| MS | SD | MS | SD | MS | SD | MS | SD | |||
| Future perspective | 2.2 | 0.7 | 2.0 | 0.7 | .285 | 2.2 | 0.7 | 1.8 | 0.7 | .036 |
| Body image | 1.9 | 1.3 | 1.4 | 0.9 | .023 | 1.4 | 0.6 | 1.4 | 0.6 | 1.00 |
| Disease symptoms | 1.9 | 0.6 | 2.2 | 0.6 | .039 | 1.7 | 0.6 | 1.8 | 0.7 | .571 |
| Side effects of treatment | 2.1 | 0.7 | 1.8 | 0.4 | .361 | 1.9 | 0.6 | 1.5 | 0.3 | .144 |
Correlation between dimensions and scales in the EORTC QLQ-C30 and QLQ-MY20 (chemotherapy)
| FP | BI | DS | SET | GHS | PF | RF | EF | CF | SF | F | NV | P | D | I | AL | C | DIA | FD | |
| FP | 1 | .369 | .330* | .395* | -.213 | -.254 | -.443 | -.478 | -.057 | -.410 | .086 | .149 | .322* | .119 | -.104 | .309* | .004 | .017 | .264 |
| BI | .369 | 1 | .208 | .586 | -.135 | -.155 | -.333* | -.428 | -.101 | -.396 | 131 | .299* | .164 | -.044 | .107 | .186 | -.074 | .229 | .270 |
| DS | .330* | .208 | 1 | .669 | -.459 | -.678 | -.429 | -.369 | -.545 | -.400 | .642 | .289* | .779 | .255 | -.127 | .512 | .150 | .274 | .243 |
| SET | .395* | .586 | .669 | 1 | -.277 | -.513 | -.462 | -.579 | -.577 | -.568 | .560 | .599 | .482 | .116 | .305 | .644 | -.121 | .451 | .469 |
| GHS | -.213 | -.135 | -.459 | -.277 | 1 | .427 | .341* | .503 | .336* | .468 | -.399 | -.205 | -.332* | -.283* | .013 | -.528 | -.033 | -.489 | -.335* |
| PF | -.254 | -.155 | -.678 | -.513 | .427 | 1 | .588 | .367 | .524 | .430 | -.807 | -.277 | -.725 | -.337* | .165 | -.389 | -.156 | -.136 | -.147 |
| RF | -.443 | -.333* | -.429 | -.462 | .341* | .588 | 1 | .384 | .359* | .491 | -.564 | -.373 | -.554 | -.376 | -.094 | -.449 | -.113 | -.259 | -.316* |
| EF | -.478 | -.428 | -.369 | -.579 | .503 | .367 | .384 | 1 | .329* | .692 | -.266 | -.616 | -.408 | .115 | .048 | -.596 | -.117 | -.424 | -.414 |
| CF | -.057 | -.101 | -.545 | -.577 | .336* | .524 | .359* | .329* | 1 | .176 | -.625 | -.383 | -.502 | -.170 | -.088 | -.424 | .043 | -.349* | -.262 |
| SF | -.410 | -.396 | -.400 | -.568 | .468 | .430 | .491 | .692 | .176 | 1 | -.225 | -.498 | -.353* | -.134 | .007 | -.589 | .064 | -.304* | -.534 |
| F | .086 | .131 | .642 | .560 | -.399 | -.807 | -.564 | -.266 | -.625 | -.225 | 1 | .272 | .717 | .456 | .066 | .374 | .127 | .369 | .119 |
| NV | .149 | .299* | .289* | .599 | -.205 | -.277 | -.373 | -.616 | -.383 | -.498 | .272 | 1 | .227 | -.139 | .083 | .605 | .125 | .361* | .317* |
| P | .322* | .164 | .779 | .482 | -.332* | -.725 | -.554 | -.408 | -.502 | -.353* | .717 | .227 | 1 | .350* | -.178 | .389 | .161 | .222 | .182 |
| D | .119 | -.044 | .255 | .116 | -.283* | -.337* | -.376 | .115 | -.170 | -.134 | .456 | -.139 | .350* | 1 | .204 | .078 | -.187 | .206 | .160 |
| I | -.104 | .107 | -.127 | .305 | .013 | .165 | -.094 | .048 | -.088 | .007 | .066 | .083 | -.178 | .204 | 1 | .238 | -.186 | .271 | .194 |
| AL | .309* | .186 | .512 | .644 | -.528 | -.389 | -.449 | -.596 | -.424 | -.589 | .374 | .605 | .389 | .078 | .238 | 1 | .000 | .329* | .375 |
| C | .004 | -.074 | .150 | -.121 | -.033 | -.156 | -.113 | -.117 | .043 | .064 | .127 | .125 | .161 | -.187 | -.186 | .000 | 1 | -.089 | -.133 |
| DIA | .017 | .229 | .274 | .451 | -.489 | -.136 | -.259 | -.424 | -.349* | -.304* | .369 | .361* | .222 | .206 | .271 | .329* | -.089 | 1 | .517 |
| FD | .264 | .270 | .243 | .469 | -.335* | -.147 | -.316* | -.414 | -.262 | -.534 | .119 | .317* | .182 | .160 | .194 | .375 | -.133 | .517 | 1 |
Mean score (MS) and standard deviation (SD) for all EORTC QLQ-C30 dimensions and scales in multiple myeloma (MM) patients before and after chemotherapy and transplantation
| MM–before chemotherapy | MM–after chemotherapy | p* | MM–before transplantation | MM–after transplantation | p* | |||||
|---|---|---|---|---|---|---|---|---|---|---|
| MS | SD | MS | SD | MS | SD | MS | SD | |||
| Global health status/ quality of life | 53.3 | 21.4 | 49.7 | 22.5 | .283 | 64.4 | 15.7 | 74.7 | 18.0 | .008 |
| Physical functioning | 53.9 | 26.3 | 38.9 | 21.3 | .011 | 71.8 | 23.4 | 71.8 | 19.1 | .955 |
| Role functioning | 50.7 | 39.8 | 46.7 | 31.9 | .458 | 54.5 | 38.2 | 77.6 | 24.5 | .009 |
| Emotional functioning | 73.3 | 27.6 | 78.0 | 21.9 | .776 | 78.2 | 14.5 | 84.3 | 23.3 | .107 |
| Cognitive functioning | 78.0 | 27.1 | 57.3 | 28.1 | .007 | 86.0 | 14.9 | 91.0 | 14.3 | .083 |
| Social functioning | 57.3 | 37.6 | 787 | 26.6 | .007 | 62.8 | 30.7 | 78.0 | 26.1 | .026 |
| Fatigue | 43.1 | 27.3 | 64.0 | 22.3 | .001 | 39.1 | 21.5 | 40.2 | 24.6 | .782 |
| Nausea/vomiting | 7.3 | 15.3 | 5.3 | 13.4 | .603 | 7.7 | 12.7 | 0.0 | 0.0 | .010 |
| Pain | 39.3 | 36.9 | 54.7 | 25.2 | .039 | 37.2 | 30.3 | 31.4 | 28.0 | .323 |
| Dyspnoea | 28.0 | 32.9 | 33.3 | 30.4 | .590 | 26.9 | 26.7 | 17.9 | 23.5 | .100 |
| Insomnia | 40.0 | 36.0 | 14.7 | 23.7 | .010 | 23.1 | 27.9 | 20.5 | 31.4 | .637 |
| Appetite loss | 28.0 | 38.1 | 21.3 | 35.8 | .463 | 15.4 | 30.2 | 7.7 | 17.1 | .286 |
| Constipation | 16.0 | 32.1 | 20.0 | 28.9 | .564 | 11.5 | 18.7 | 1.3 | 6.5 | .011 |
| Diarrhoea | 9.3 | 22.6 | 6.7 | 19.2 | .414 | 10.3 | 18.3 | 1.3 | 6.5 | .035 |
| Financial diffuclities | 41.3 | 41.1 | 14.7 | 28.9 | .005 | 37.2 | 33.1 | 20.5 | 29.9 | .018 |
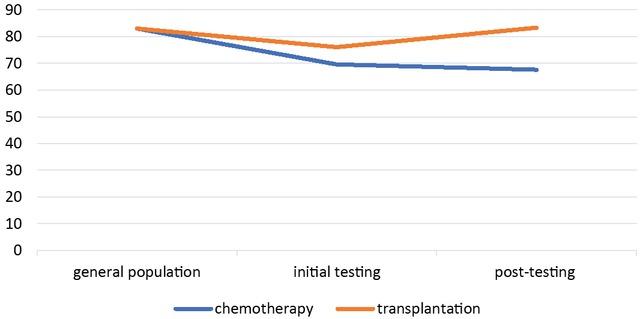
| Summary score | 69.6 | 19.5 | 67.7 | 14.5 | .181 | 76.0 | 15.7 | 83.3 | 9.7 | .097 |
Correlation between dimensions and scales in the EORTC QLQ-C30 and QLQ-MY20 (transplantation)
| FP | BI | DS | SET | GHS | PF | RF | EF | CF | SF | F | NV | P | D | I | AL | C | DIA | FD | |
| FP | 1 | .451** | .029 | .289 | -.383 | -.246 | -.203 | -.499 | -,106 | -.333* | .287* | .238 | -.035 | .145 | .296* | .371 | .309* | .049 | .053 |
| BI | .451 | 1 | -.142 | .026 | -.109 | -.047 | -.009 | -.083 | ,105 | .016 | .038 | -.006 | -.151 | -.048 | .333* | .109 | .053 | -.029 | -.195 |
| DS | .029 | -.142 | 1 | .447 | -.312* | -.589 | -.449 | -.339* | ,228 | -.397 | .527 | -.051 | .707 | .406 | .145 | .035 | -.060 | -.072 | .188 |
| SET | .289 | .026 | .447 | 1 | -.615 | -.710 | -.627 | -.397 | -,299 | -.455 | .570 | .597 | .519 | .642 | .377* | .523 | .470 | .485 | .337* |
| GHS | -.383 | -.109 | -.312* | -.615 | 1 | .629 | .518 | .349* | ,159 | .498 | -.436 | -.467 | -.423 | -.443 | -.071 | -.192 | -.429 | -.371 | -.370 |
| PF | -.246 | -.047 | -.589 | -.710 | .629 | 1 | .562 | .403 | ,147 | .506 | -.645 | -.375 | -.643 | -.447 | -.379 | -.325* | -.232 | -.171 | -.443 |
| RF | -.203 | -.009 | -.449 | -.627 | .518 | .562 | 1 | .346* | -,015 | .580 | -.563 | -.341* | -.626 | -.403 | -.194 | -.200 | -.209 | -.127 | -.421 |
| EF | -.499 | -.083 | -.339* | -.397 | .349* | .403 | .346* | 1 | ,188 | .378 | -.347* | -.217 | -.146 | -.191 | -.395 | -.120 | -.123 | -.054 | -.258 |
| CF | -.106 | .105 | .228 | -.299 | .159 | .147 | -.015 | .188 | 1 | .024 | -.002 | -.348* | .023 | -.041 | -.105 | -.033 | -.304* | -.143 | -.250 |
| SF | -.333* | .016 | -.397 | -.455 | .498 | .506 | .580 | .378 | ,024 | 1 | -.539 | -.245 | -.376 | -.178 | -.188 | -.078 | -.158 | -.080 | -.292* |
| F | .287* | .038 | .527 | .570 | -.436 | -.645 | -.563 | -.347* | -,002 | -.539 | 1 | .299* | .563 | .294* | .423 | .441 | .154 | .266 | .336* |
| NV | 238 | -.006 | -.051 | .597 | -.467 | -.375 | -.341* | -.217 | -,348* | -.245 | .299* | 1 | .258 | .263 | .197 | .587 | .660 | .464 | .299* |
| P | -.035 | -.151 | .707 | .519 | -.423 | -.643 | -.626 | -.146 | ,023 | -.376 | .563 | .258 | 1 | .563 | .077 | .182 | .188 | .143 | .376 |
| D | .145 | -.048 | .406 | .642 | -.443 | -.447 | -.403 | -.191 | -,041 | -.178 | .294* | .263 | .563 | 1 | .149 | .346* | .190 | .356 | .178 |
| I | .296* | .333* | .145 | .377* | -.071 | -.379 | -.194 | -.395 | -,105 | -.188 | .423 | .197 | .077 | .149 | 1 | .398 | .123 | .264 | .288* |
| AL | .371** | .109 | .035 | .523 | -.192 | -.325* | -.200 | -.120 | -,033 | -.078 | .441 | .587 | .182 | .346* | .398 | 1 | .271 | .363 | .148 |
| C | .309* | .053 | -.060 | .470 | -.429 | -.232 | -.209 | -.123 | -,304* | -.158 | .154 | .660 | .188 | .190 | .123 | .271 | 1 | .540 | .152 |
| DIA | .049 | -.029 | -.072 | .485 | -.371 | -.171 | -.127 | -.054 | -,143 | -.080 | .266 | .464 | .143 | .356 | .264 | .363 | .540 | 1 | .104 |
| FD | .053 | -.195 | .188 | .337* | -.370 | -.443 | -.421 | -.258 | -,250 | -.292* | .336* | .299* | .376 | .178 | .288* | .148 | .152 | .104 | 1 |
Mean score (MS) and standard deviation (SD) for all EORTC QLQ-C30 dimensions and scales in general population and multiple myeloma (MM) patients at diagnosis at the time of setting the diagnosis
| MM patients at diagnosis | General population | ||||
|---|---|---|---|---|---|
| MS | SD | MS | SD | P* | |
| Global health status/ quality of life | 58.9 | 19.4 | 68.2 | 20.6 | .003 |
| Physical functioning | 63.0 | 26.2 | 81.7 | 20.1 | .000 |
| Role functioning | 52.6 | 38.6 | 83.1 | 25.1 | .000 |
| Emotional functioning | 75.8 | 21.7 | 75.1 | 21.6 | .820 |
| Cognitive functioning | 82.0 | 22.0 | 83.5 | 20.1 | .725 |
| Social functioning | 60.1 | 34.0 | 87.4 | 20.6 | .000 |
| Fatigue | 41.0 | 24.3 | 31.9 | 23.4 | .014 |
| Nausea/vomiting | 7.5 | 13.9 | 6.2 | 13.3 | .346 |
| Pain | 38.2 | 33.4 | 26.1 | 26.5 | .020 |
| Dyspnoea | 27.5 | 29.6 | 19.7 | 25.2 | .078 |
| Insomnia | 31.4 | 32.9 | 28.3 | 30.9 | .556 |
| Appetite loss | 21.6 | 34.5 | 8.5 | 18.7 | .010 |
| Constipation | 13.7 | 25.9 | 10.1 | 20.8 | .392 |
| Diarrhoea | 9.8 | 20.3 | 7.7 | 16.2 | .712 |
| Financial difficulties | 39.2 | 36.9 | 10.6 | 22.6 | .000 |
| Summary score | 72.9 | 17.8 | 83.0 | 14.8 | .000 |