
Figure 1
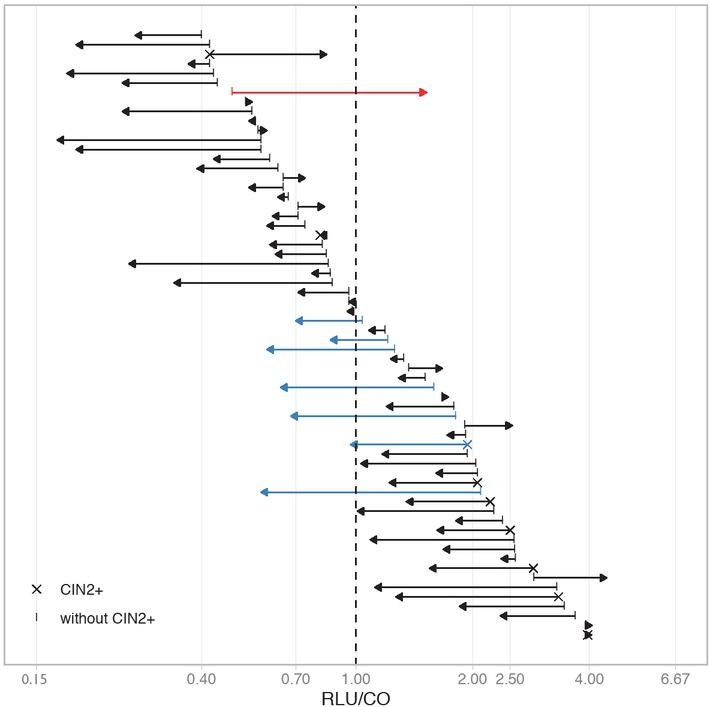
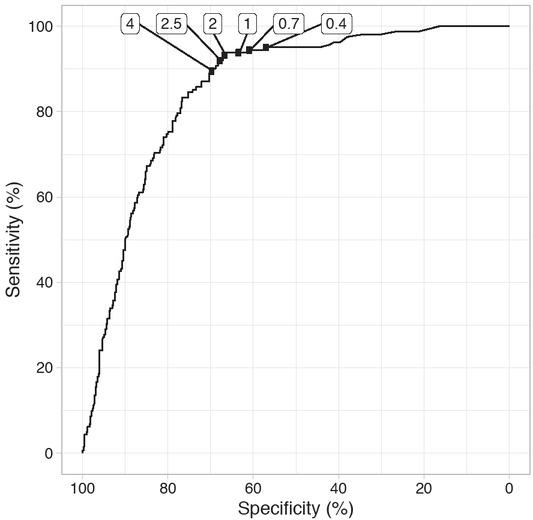
Figure 2
The distribution of women with a CIN2+/3+ diagnosis and the risk for CIN2+/3+ based on the RLU/CO values of their HPV test results
| RLU/CO value | N and % women (Ntot = 594) | N and % CIN2+ (Ntot = 162) | Risk for CIN2+ (%) | N and % CIN3+ (Ntot = 114) | Risk for CIN3+ (%) |
|---|---|---|---|---|---|
| RLU/CO < 0.4 | 253 (42.6) | 8 (4.9) | 3.2 | 2 (1.8) | 0.8 |
| 0.4 ≤ RLU/CO < 0.7 | 18 (3.0) | 1 (0.6) | 5.6 | 1 (0.9) | 5.6 |
| 0.7 ≤ RLU/CO < 1.0 | 12 (2.0) | 1 (0.6) | 8.3 | 1 (0.9) | 8.3 |
| 1.0 ≤ RLU/CO ≤ 2.0 | 15 (2.5) | 1 (0.6) | 6.7 | 1 (0.9) | 6.7 |
| 2.0 < RLU/CO ≤ 2.5 | 8 (1.3) | 3 (1.9) | 37.5 | 2 (1.8) | 25.0 |
| 2.5 < RLU/CO ≤ 4.0 | 11 (1.9) | 3 (1.9) | 27.3 | 2 (1.8) | 18.2 |
| 4.0 < RLU/CO ≤ 10.0 | 26 (4.4) | 7 (4.3) | 26.9 | 6 (5.3) | 23.1 |
| 10.0 < RLU/CO ≤ 100 | 112 (18.9) | 48 (29.6) | 42.9 | 33 (28.9) | 29.5 |
| 100 < RLU/CO ≤ 1000 | 105 (17.7) | 68 (42.0) | 64.8 | 53 (46.5) | 50.5 |
| 1000 < RLU/CO | 34 (5.7) | 22 (13.6) | 64.7 | 13 (11.4) | 38.2 |
Number of HPV test results according to “grey zones” proposed by the manufacturer (PreservCyt)I, Seme et al_ (STM)II, and the Department of Cytopathology at Institute of Oncology Ljubljana (STM)Ill
| RLU/CO value I | N and % women (Ntot = 594) |
|---|---|
| < 1.0 | 283 (47.6) |
| 1.0–2.5 | 23 (3.9) |
| > 2.5 | 288 (48.5) |