
Figure 1
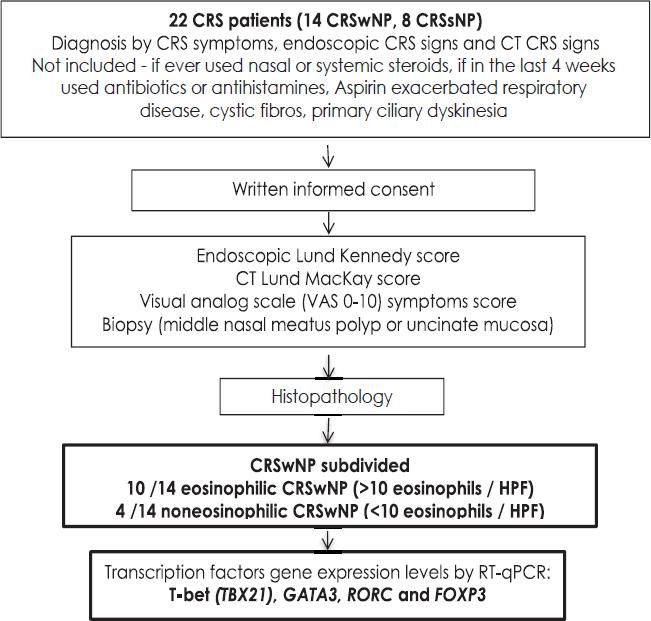
Figure 2
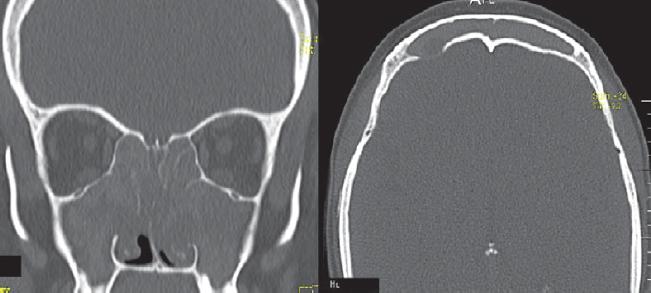
Figure 3
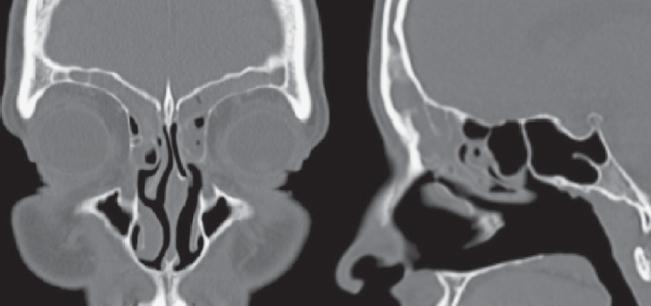
Figure 4
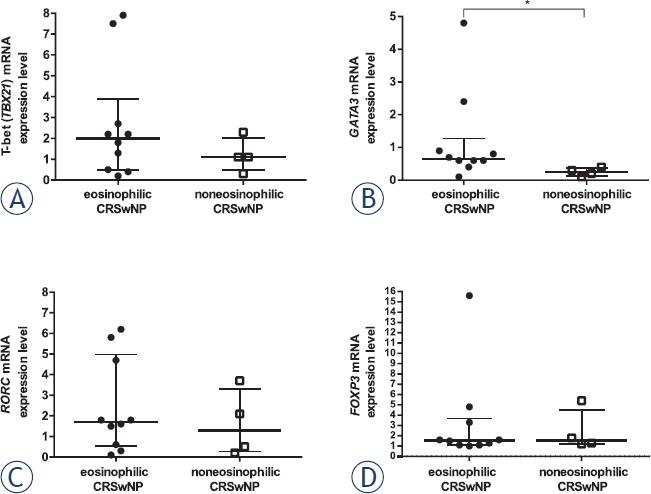
Figure 5
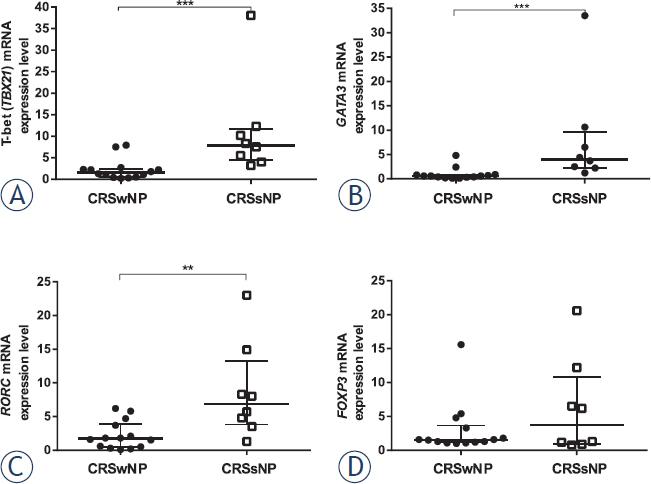
T-bet (TBX21), GATA3, RORC and FOXP3 gene expression (relative mRNA levels) in CRS nasal mucosa
| CRSwNP study population (n = 14) | CRSwNP (n =14) | CRSsNP study population (n = 8) | P* | |||
|---|---|---|---|---|---|---|
| eosinophilic CRSwNP (n = 10) | noneosinophilic CRSwNP (n = 4) | P | ||||
| T-bet | 1.6 (0.5–2.4) | 2.0 (0.5–3.9) | 1.1 (0.5–2.0) | 0.43 | 7.9 (4.4–11.8) | 0.0003 |
| GATA3 | 0.6 (0.3–0.8) | 0.7 (0.6–1.3) | 0.3 (0.1–0.4) | 0.02 | 4.1 (2.3–9.6) | 0.0003 |
| RORC | 1.7 (0.5–4.0) | 1.7 (0.5–5.0) | 1.3 (0.3–3.3) | 0.71 | 6.9 (3.8–13.3) | 0.006 |
| FOXP3 | 1.6 (1.2–3.7) | 1.6 (1.1–3.7) | 1.6 (1.2–4.5) | 0.76 | 3.8 (1.0–10.8) | 0.73 |
Demographic features, investigations and histopathological findings
| CRSwNP (n = 14) | ||||||
|---|---|---|---|---|---|---|
| Demographic features, investigations and histopathology | CRSwNP study population (n = 14) | eosinophilic CRSwNP (n = 10) | noneosinophilic CRSsNP (n = 4) | P | CRSwNP study population (n = 8) | P* |
| Age (years) | 52.1 (39.3–62.4) | 49.4 (39.3–58.4) | 63.3 (37.6–68.3) | 0.18 | 45.2 (33.3–51.3) | 0.23 |
| Female sex, no. (%) | 5 (35.7) | 4 (40) | 1 (25) | 0.60 | 4 (50) | 0.51 |
| Allergy, no. (%) | 3 (21.4) | 1 (10) | 2 (50) | 0.10 | 1 (12.5) | 0.60 |
| Asthma, no. (%) | 3 (21.4) | 1 (10) | 2 (50) | 0.31 | 1 (12.5) | 0.84 |
| COPD, no. (%) | 1 (7.1) | 1 (10) | 0 (0) | 0.89 | 0 (0) | 0.71 |
| Smoking, no. (%) | 3 (21.4) | 3 (30) | 0 (0) | 0.22 | 1 (12.5) | 0.60 |
| CRS duration (y) | 4 (3–10) | 5.5 (2.5–10) | 4 (3–10) | 0.91 | 3 (2.3–9.3) | 0.37 |
| VAS (0–10) at inclusion | 8 (7.8–9.3) | 8.5 (7.8–10) | 8 (5.8–8.8) | 0.42 | 9.5 (7.3–10) | 0.38 |
| CT Lund MacKay score at inclusion | 15 (12.8–18) | 14.5 (12.8–18) | 17.5 (12.8–23) | 0.36 | 12 (8.3–12.8) | N.A. |
| Endoscopic Lund Kennedy score at inclusion | 8 (7–9.3) | 8 (7–8.3) | 9 (8–10) | 0.15 | 4 (3–4) | N.A. |
| Tissue eosinophilia > 10 / HPF, no. (%) | 10 (71.4) | 10 (100) | 0 (0) | N.A. | 1 (13) | 0.008 |
| Neutrophil infiltration, no. (%) | 6 (42.9) | 4 (40) | 2 (50) | 0.73 | 2 (25) | 0.40 |
| Basement membrane thickening ≥ 7.5μm, no. (%) | 11 (78.6) | 10 (100) | 1 (25) | 0.002 | 8 (100) | 0.16 |
| Moderate / severe subepithelial oedema, no. (%) | 12 (85.7) | 9 (90) | 3 (75) | 0.47 | 1 (12.5) | 0.002 |
| Hyperplastic / papillary change, no. (%) | 5 (35.7) | 4 (40) | 1 (25) | 0.51 | 2 (25) | 0.53 |
| Squamous metaplasia, no. (%) | 4 (28.6) | 3 (30) | 1 (25) | 0.85 | 4 (50) | 0.31 |
| Fibrosis, no. (%) | 10 (71.4) | 7 (70) | 3 (75) | 0.85 | 7 (87.5) | 0.39 |