
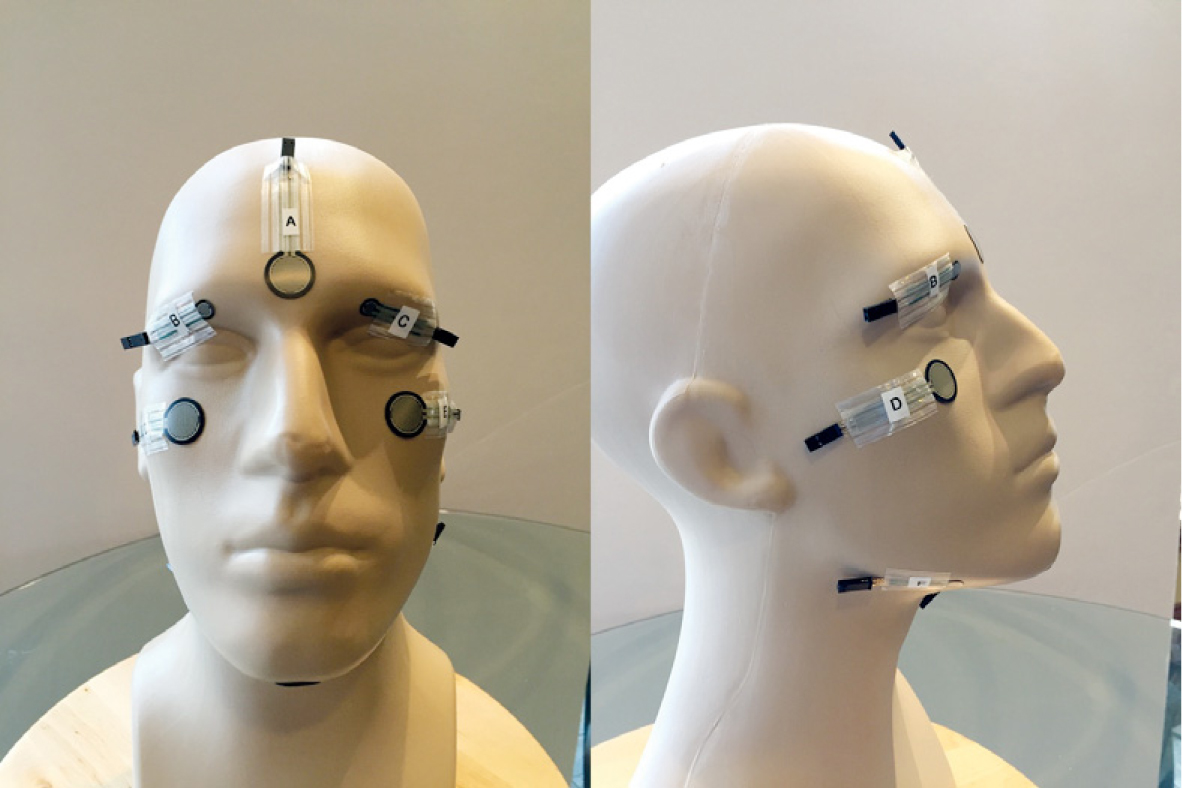
Figure 1
Mannequin with FSR 400 sensors mounted at forehead (A), supra-orbital ridge (B & C), malar eminence (D & E) and chin (F).
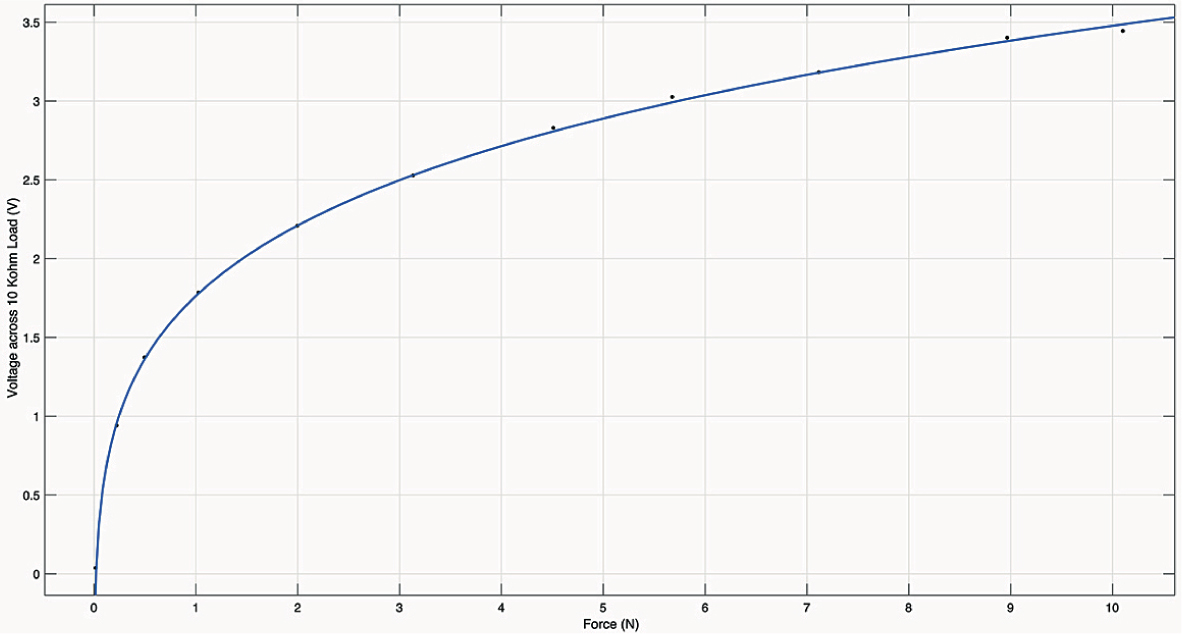
Figure 2
Force response curve for a FSR 400 with a 5 V supply and 10 K resistive load.5
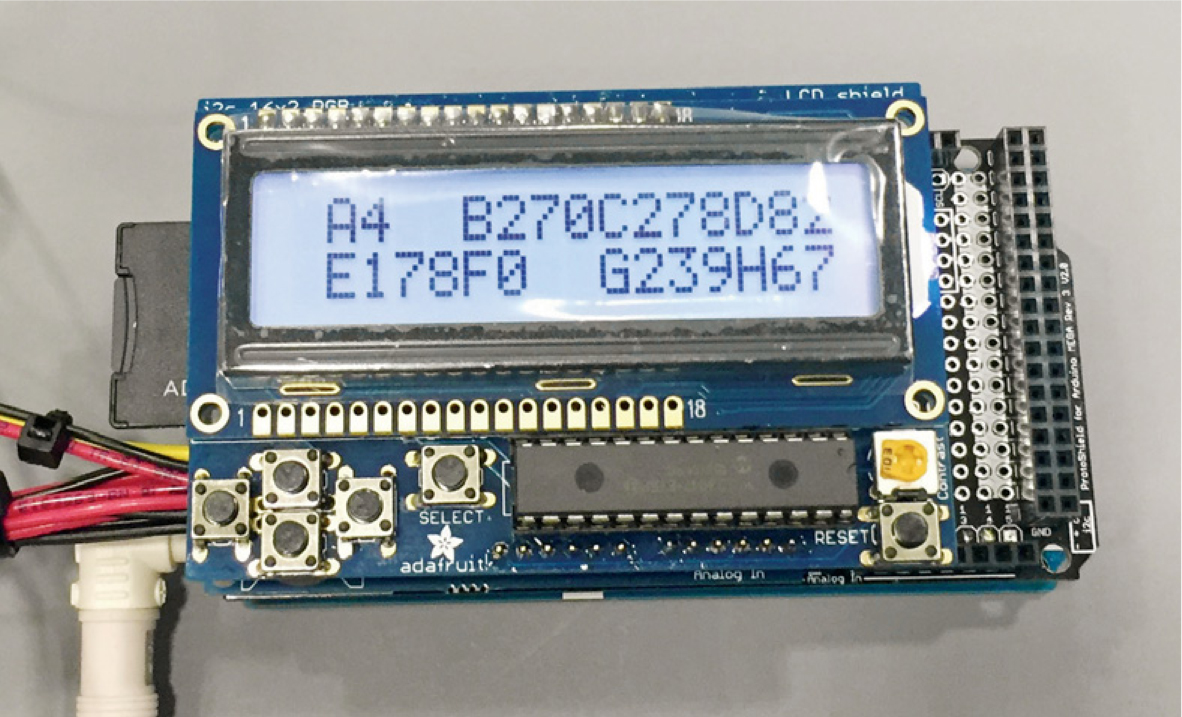
Figure 3
Data-logger assembly to record sensor data together with mask temperature and timestamp.
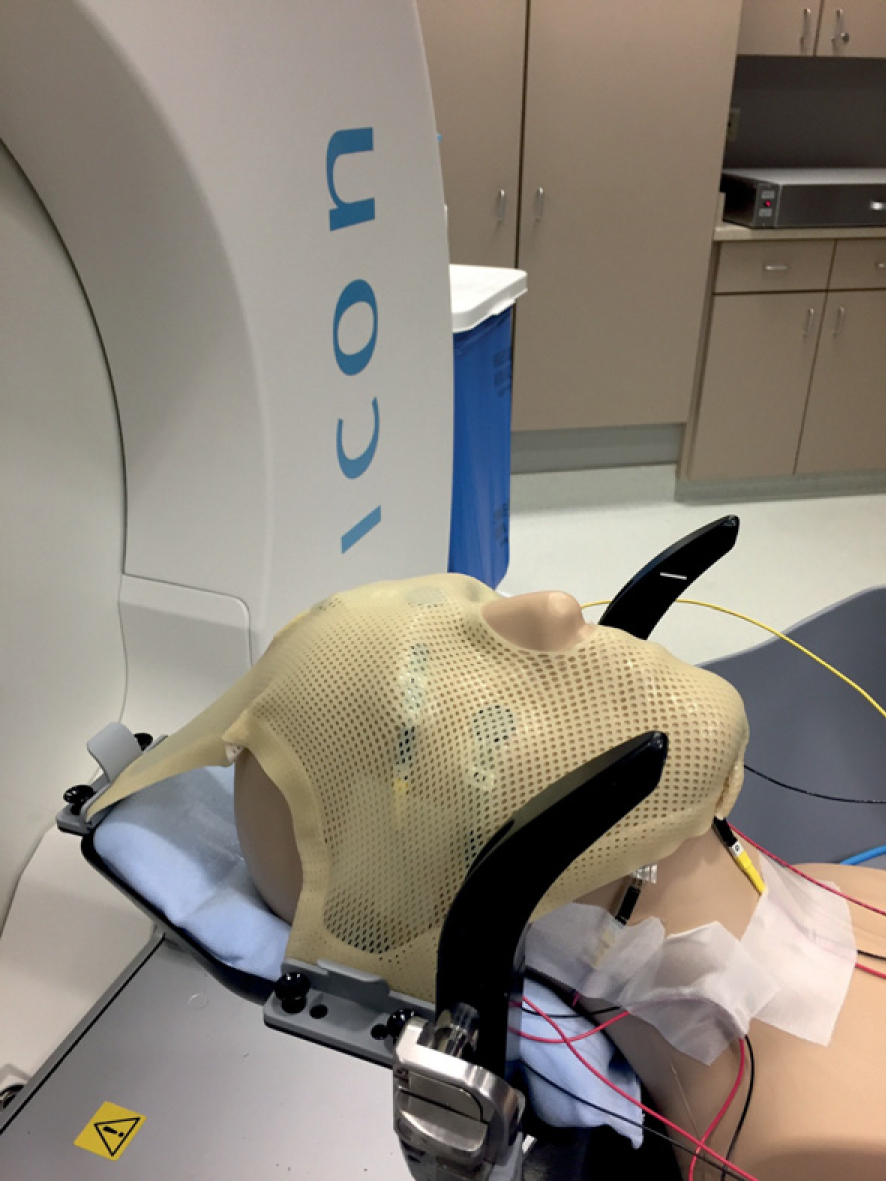
Figure 4
Mannequin in position for measurement.
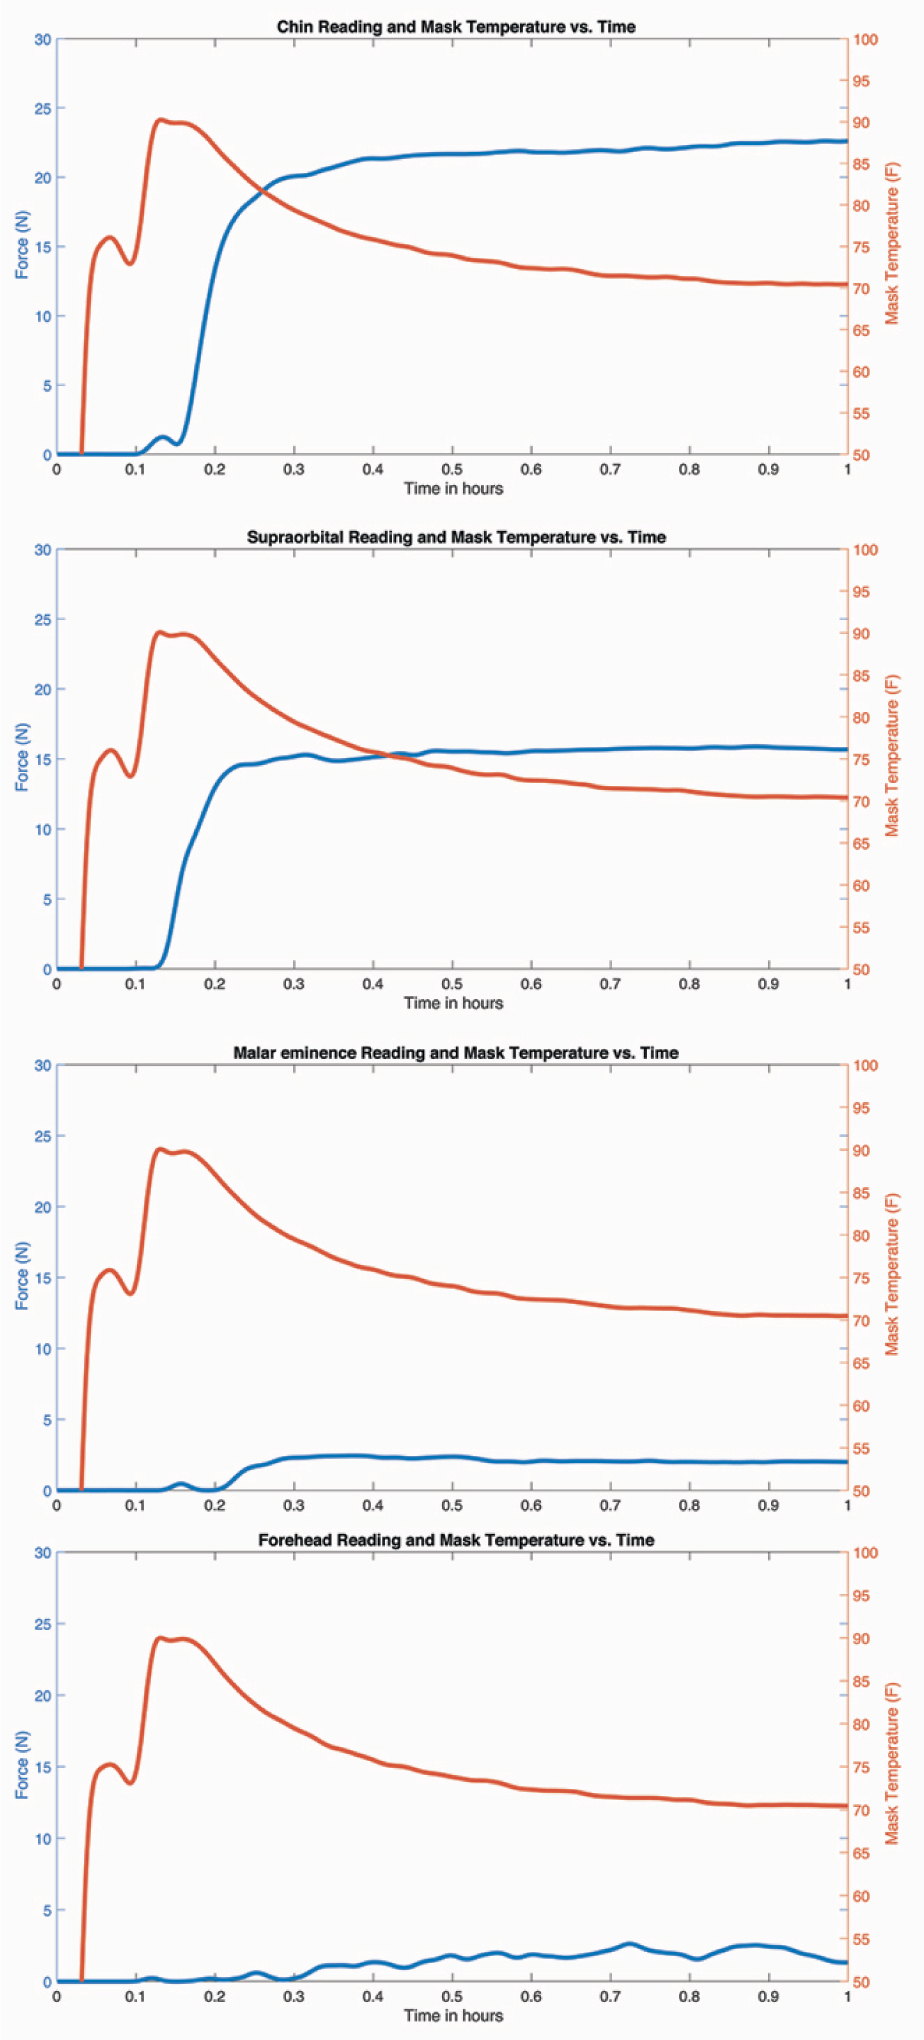
Figure 5
First hour force readings at the chin, supra-orbital ridges, malar eminences and forehead (50 °F = 10 °C; 100 °F = 37.8 °C).
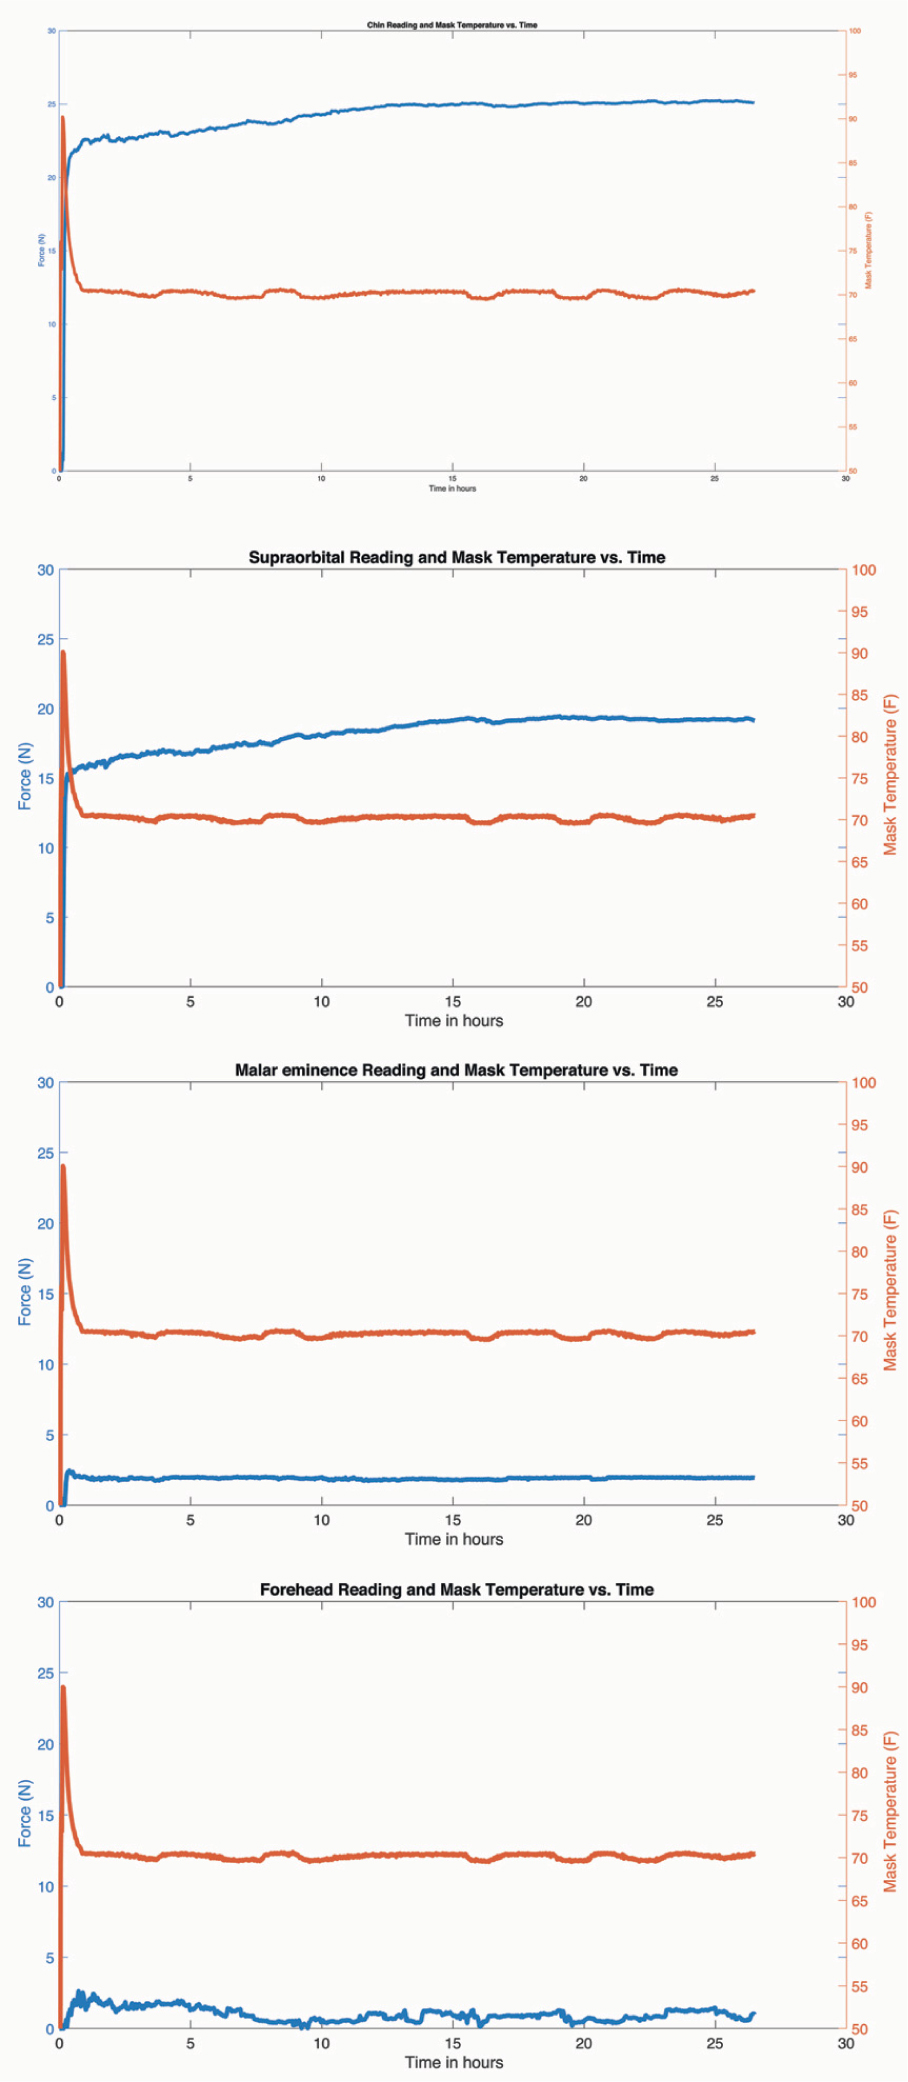
Figure 6
Extended 24-hour force recordings at the chin, supra-orbital ridges, malar eminences and forehead (50 °F = 10 °C; 100 °F = 37.8 °C).