
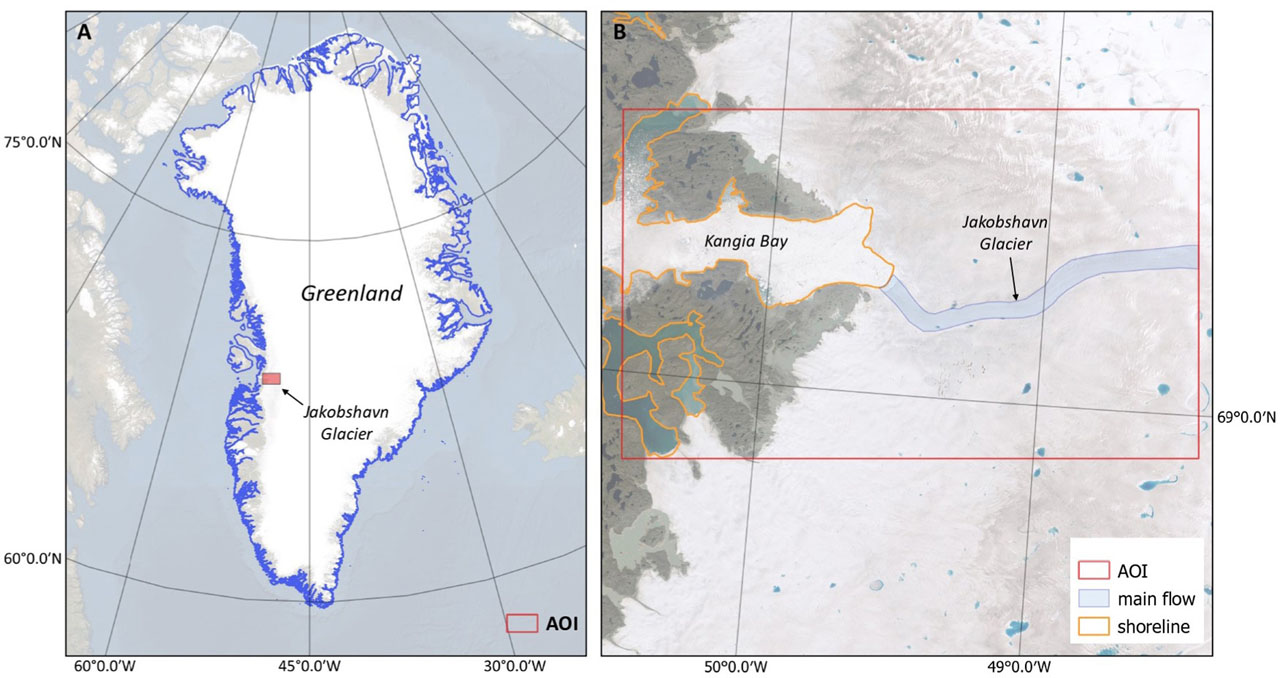
Fig. 1
Location of the area of interest (AOI): A) position of the Jakobshavn glacier on the Greenland map, B) precise location of the glacier near Kangia Bay.
Table 1
Description of data used in the study.
| No. | Data of image acquisition | Orbit number | Time baseline [days] | Period |
|---|---|---|---|---|
| 1 | 31.01.2017 | 127 | 16 | Winter 2017 |
| 06.02.2017 | 127 | |||
| 2 | 31.01.2017 | 127 | 24 | |
| 24.02.2017 | 127 | |||
| 3 | 30.07.2017 | 127 | 6 | August 2017 |
| 05.08.2017 | 127 | |||
| 4 | 30.07.2017 | 127 | 30 | |
| 29.08.2017 | 127 | |||
| 5 | 03.01.2021 | 25 | 6 | Winter 2021 |
| 09.01.2021 | 25 | |||
| 6 | 01.08.2021 | 25 | 6 | August 2021 |
| 07.08.2021 | 25 |
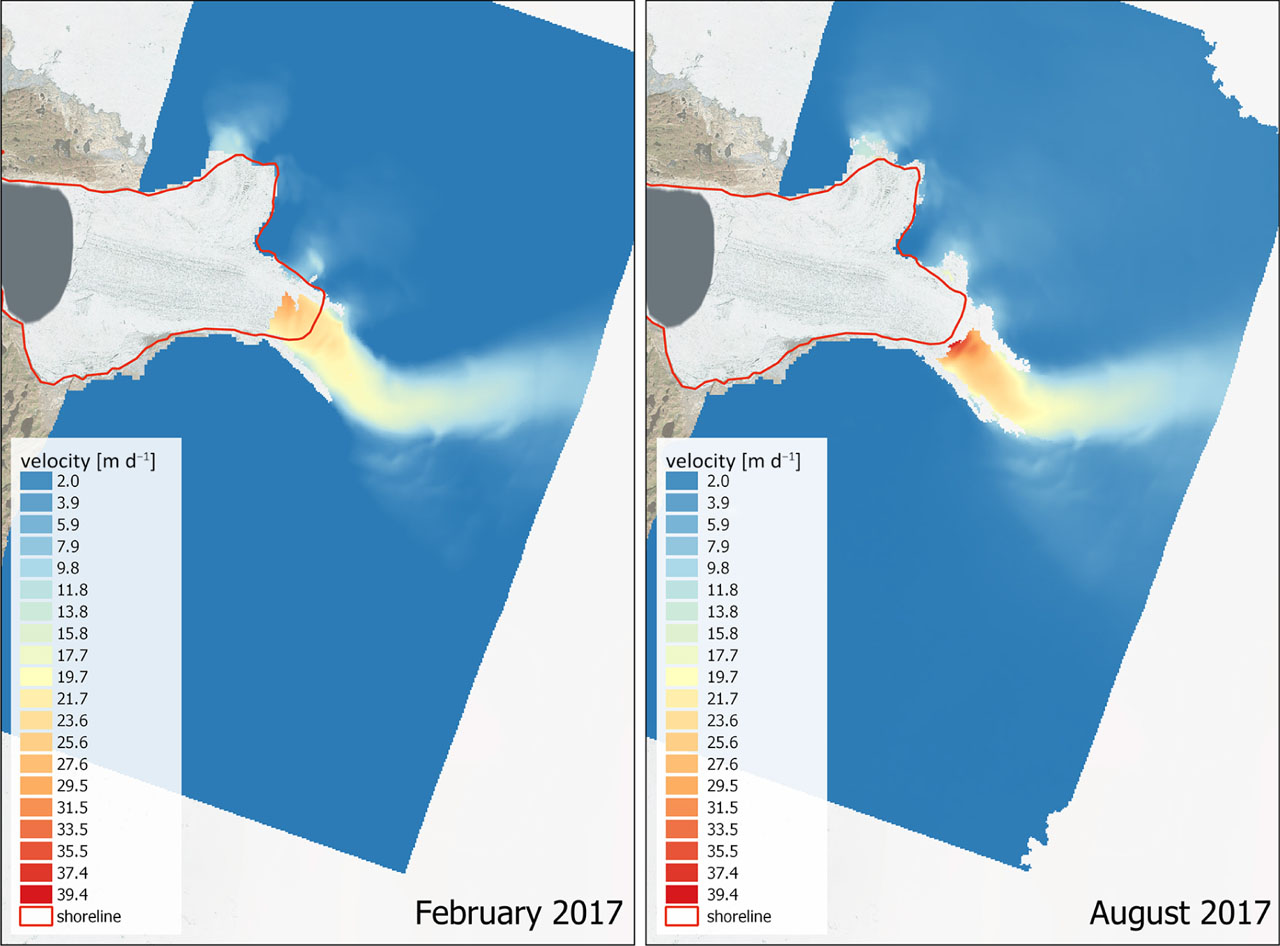
Fig. 2
Velocities of the Jakobshavn Glacier from the MEaSUREs database.
Table 2
Parameters for the offset-tracking procedure.
| Parameters | |
|---|---|
| DTM | ACE30 |
| Grid size | 20 × 20 pxl (200 × 200 m) |
| Searching window | 128 × 128 pxl |
| Max velocity | 40 m d−1 |
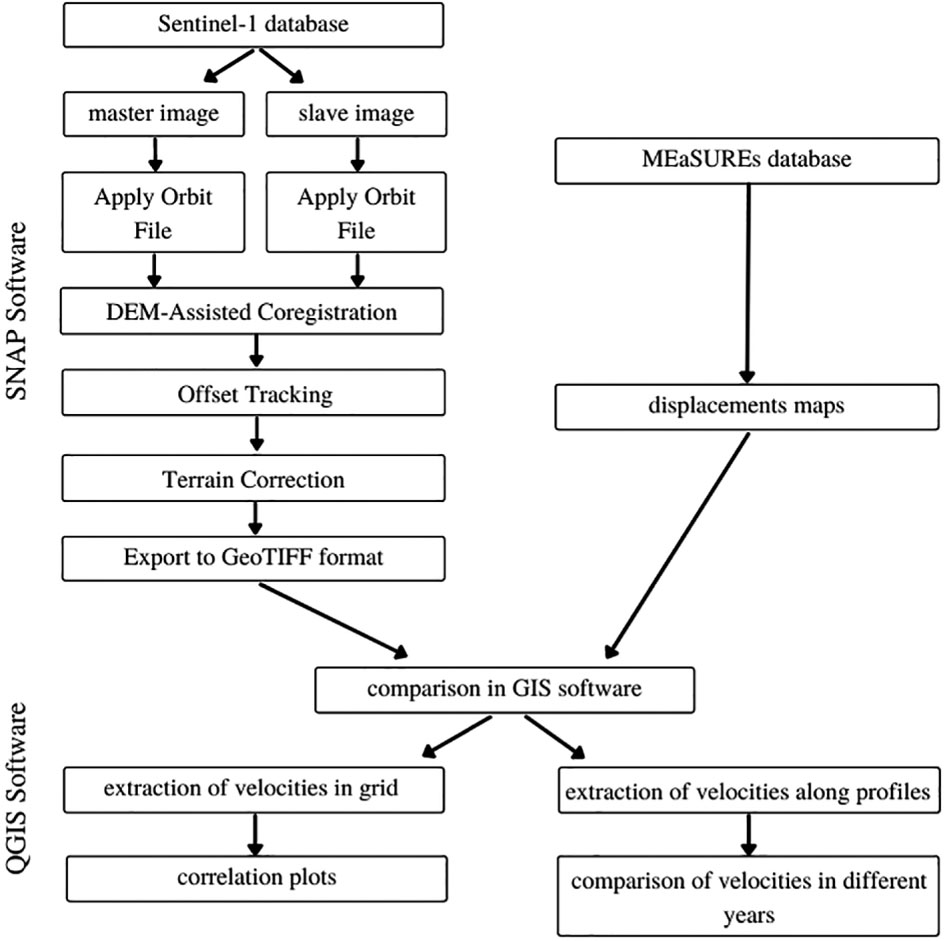
Fig. 3
Workflow.
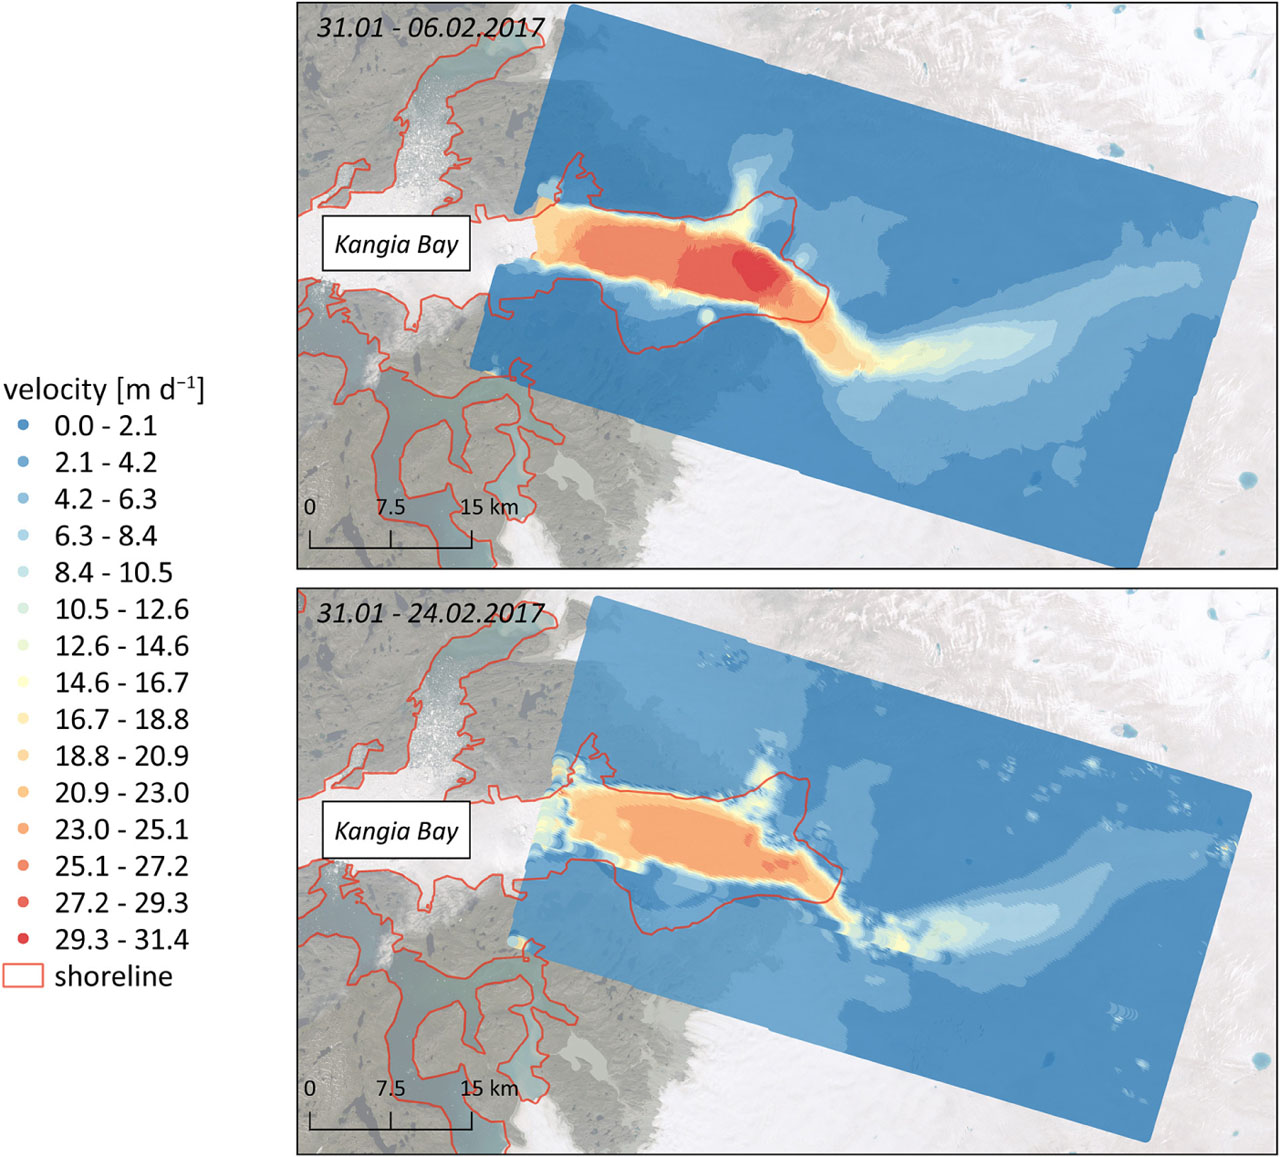
Fig. 4
Velocities for winter 2017 obtained from short and long intervals.
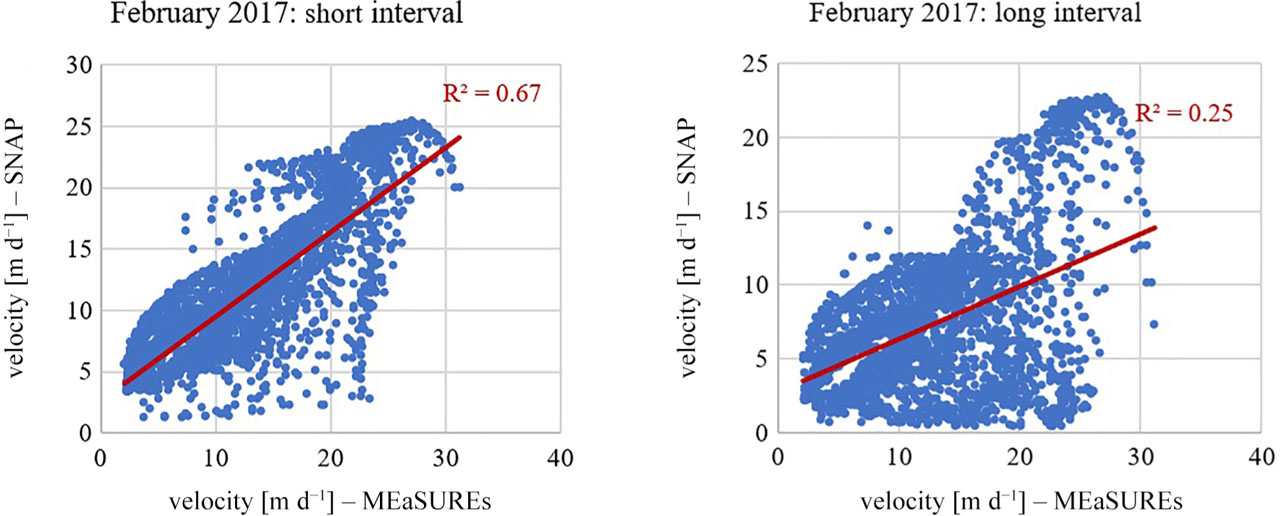
Fig. 5
Correlation plots for winter 2017.
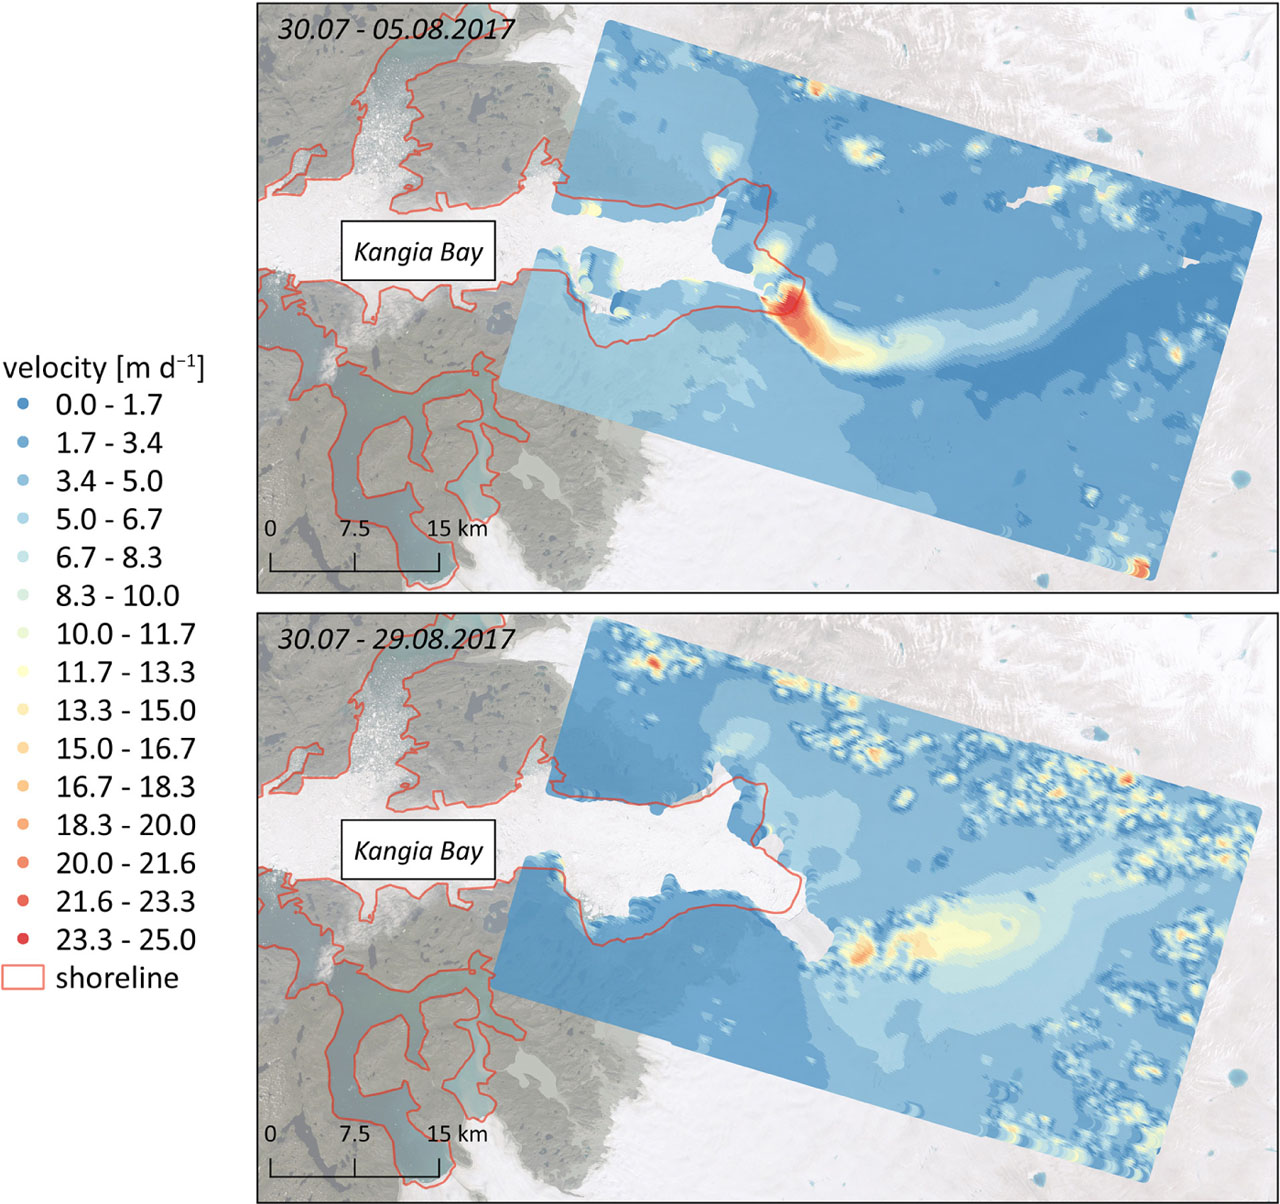
Fig. 6
Velocities for summer 2017 obtained from long and short calculation intervals.
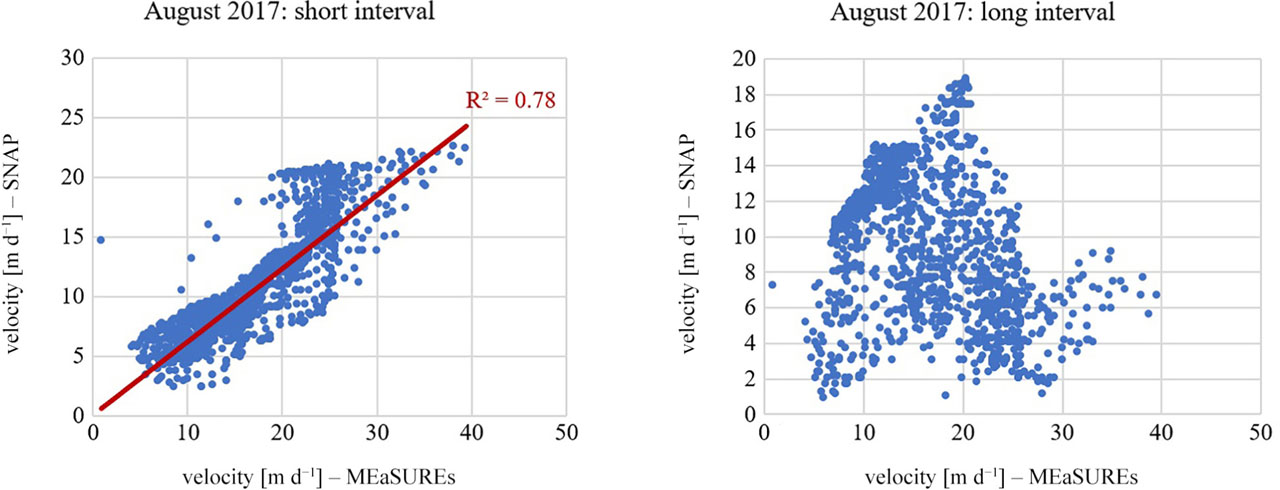
Fig. 7
Correlation plots for summer 2017.
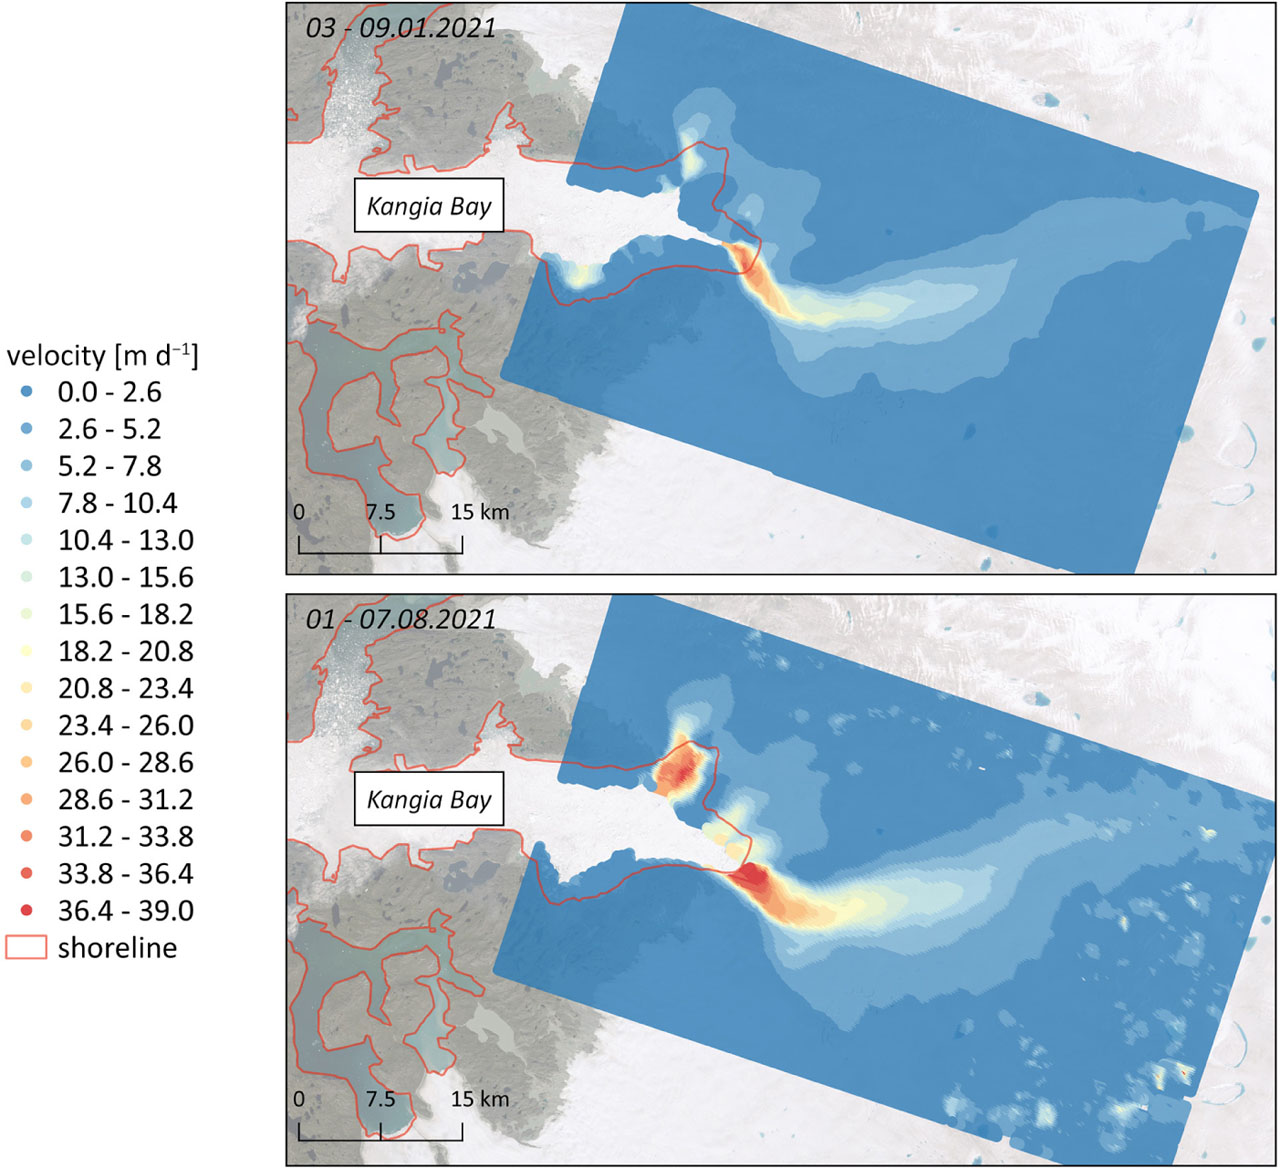
Fig. 8
Velocities of the Jakobshavn Glacier in winter and summer 2021.
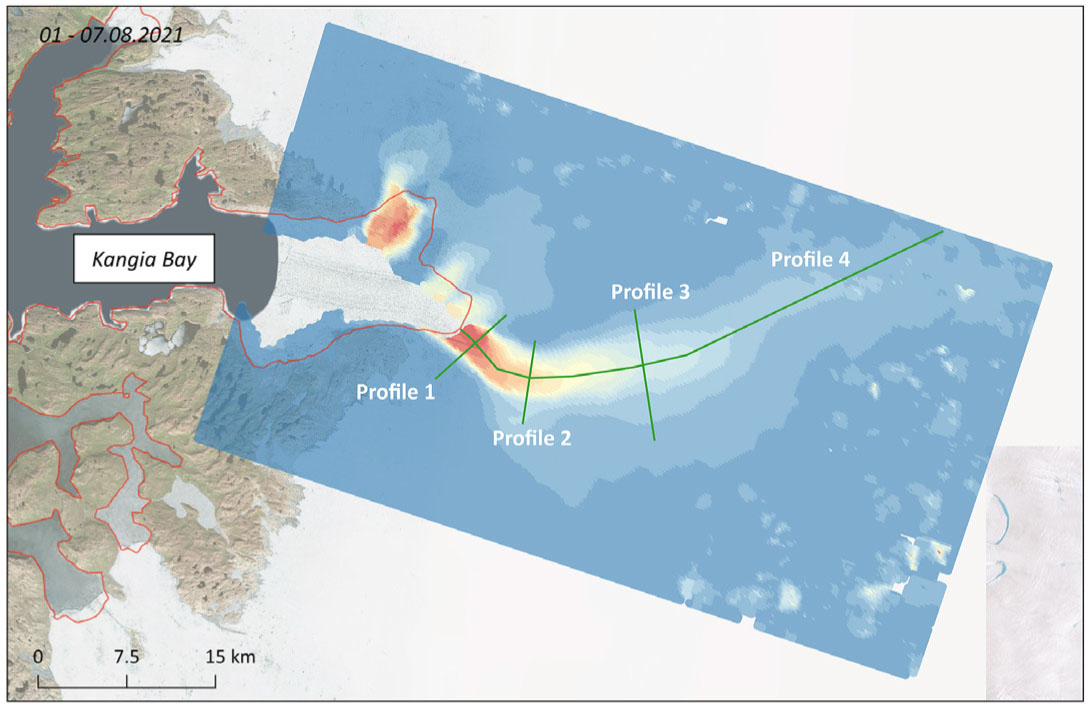
Fig. 9
Location of profiles.
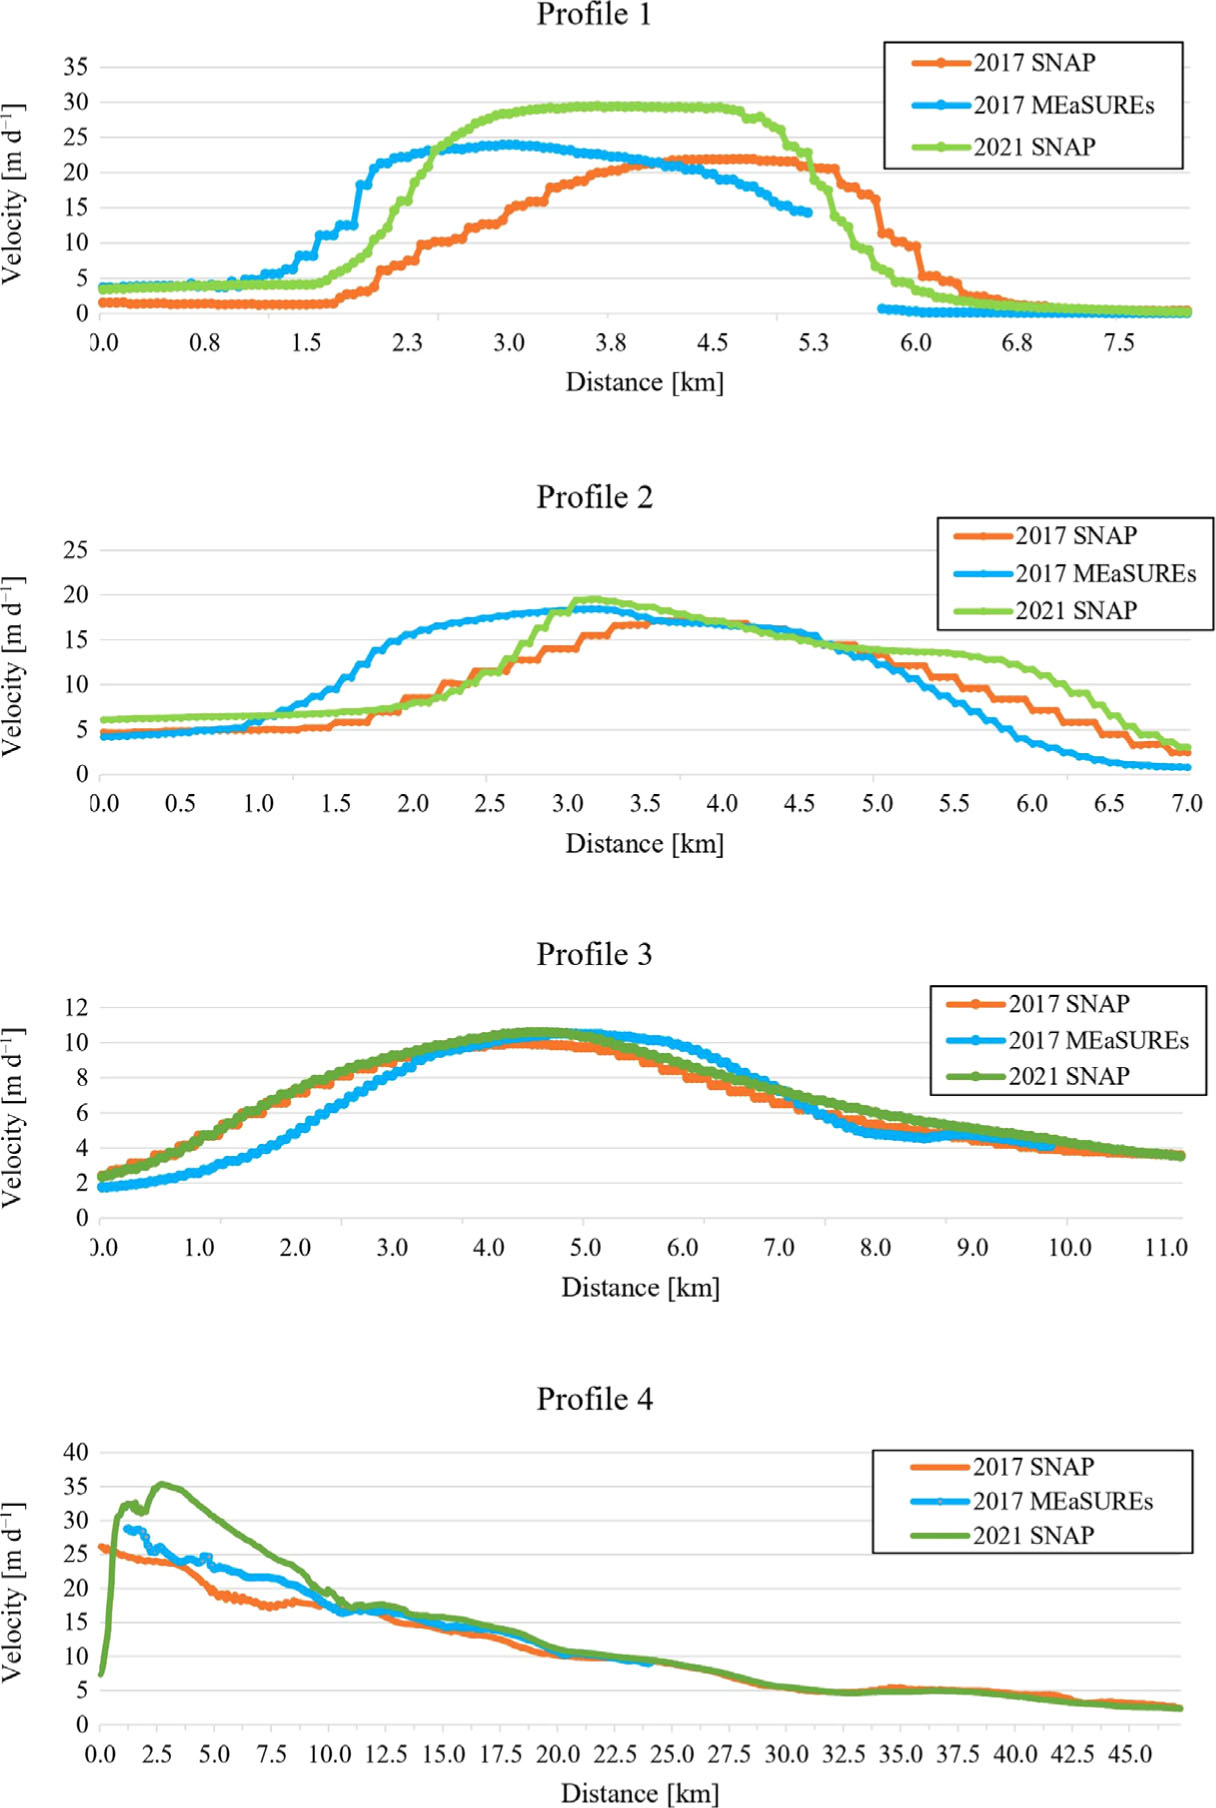
Fig. 10
Winter profiles presenting velocity values.
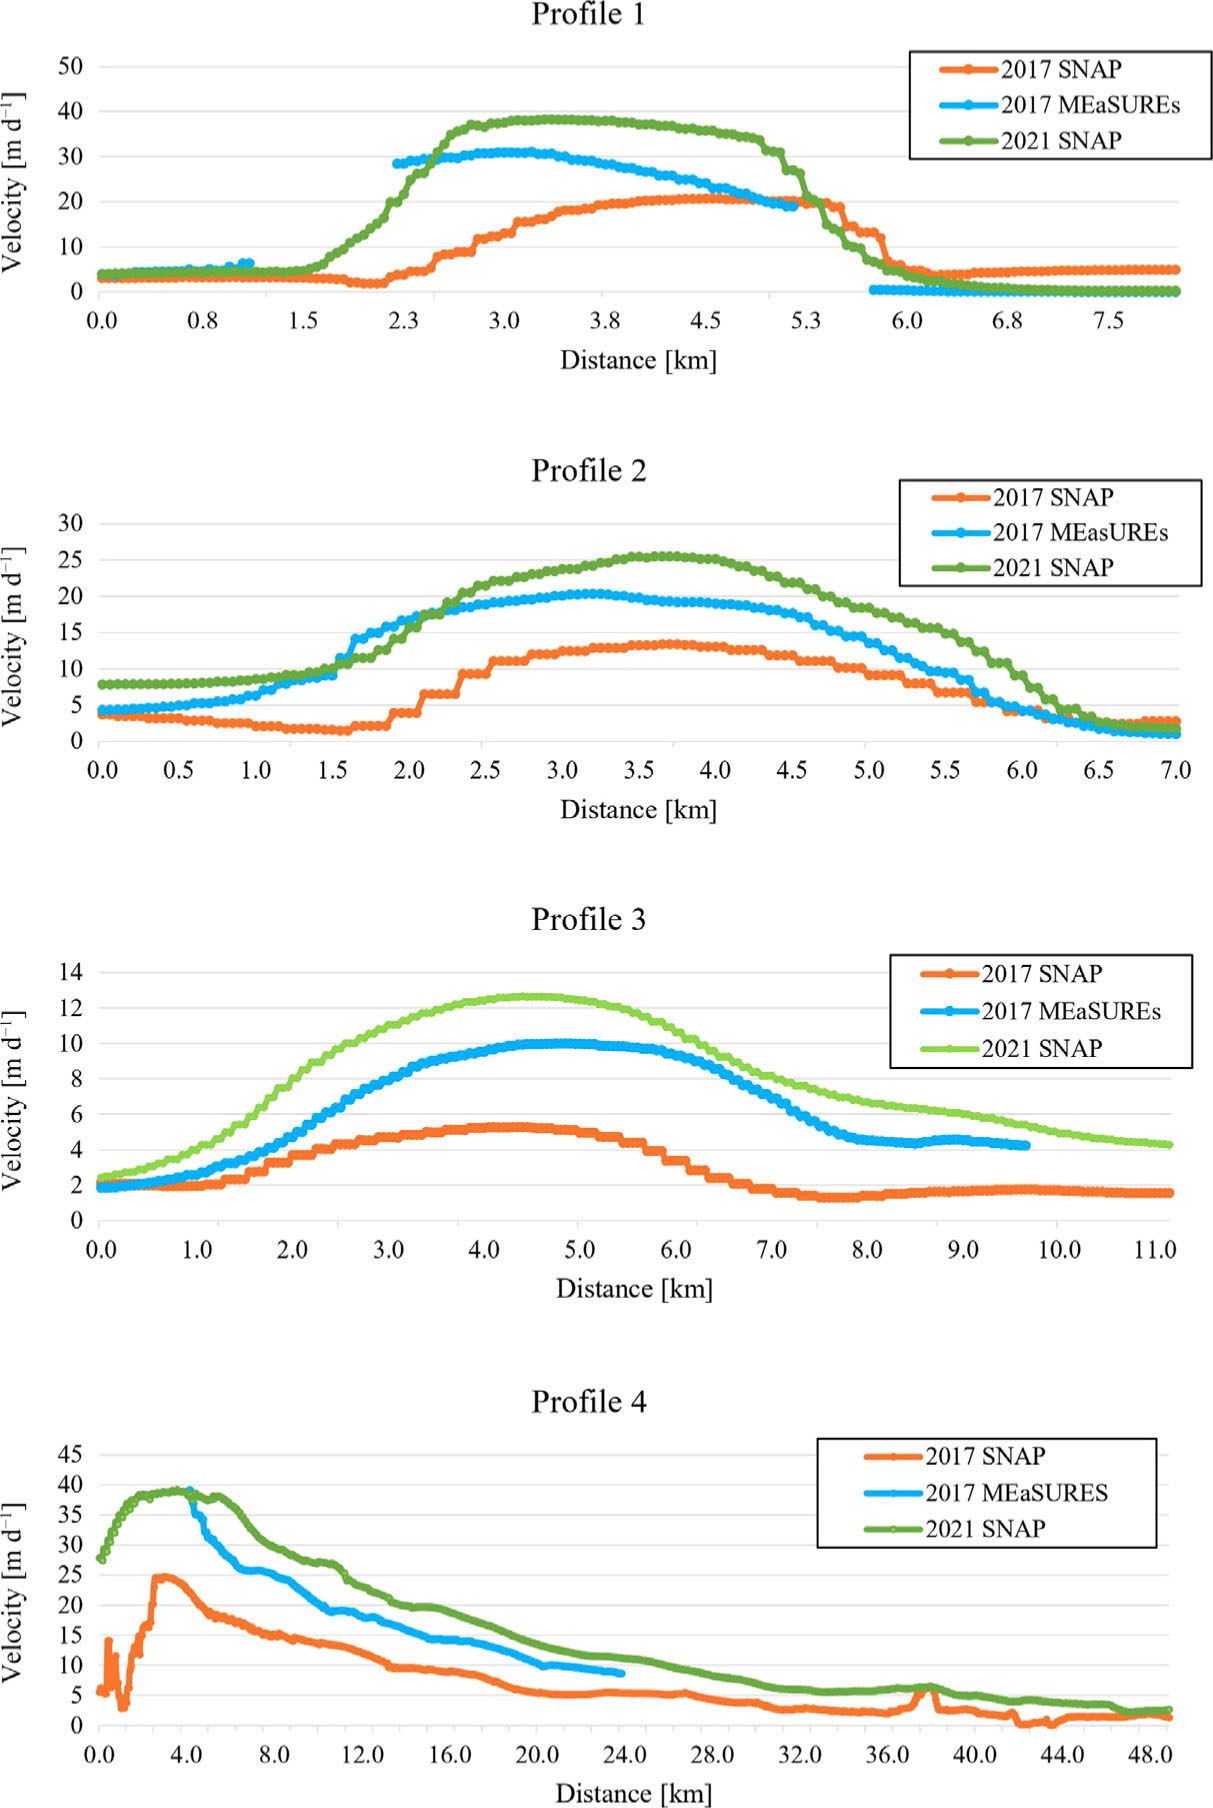
Fig. 11
Summer profiles presenting velocity values.