
Fig. 1
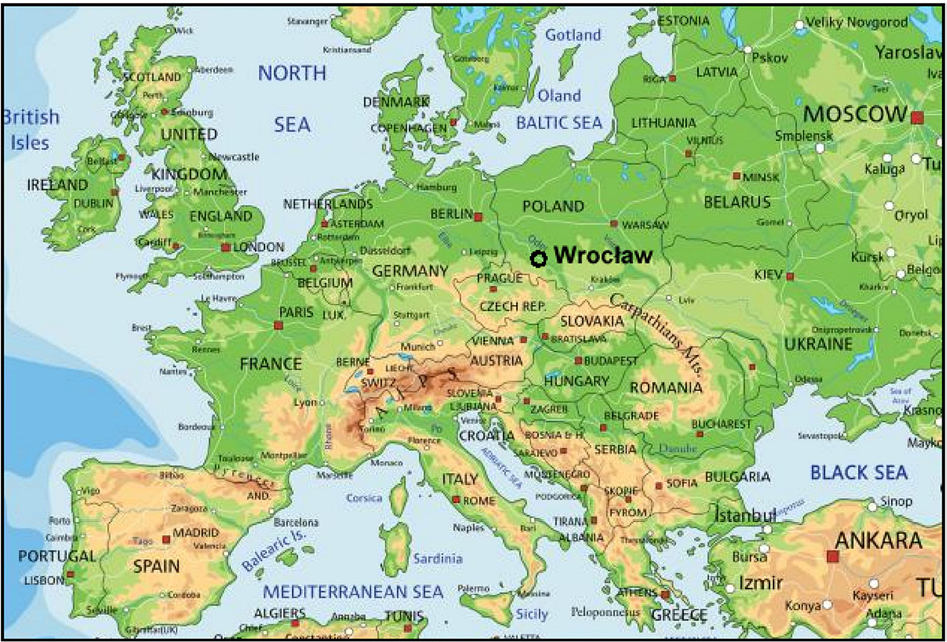
The geographical position of Wrocław in Europe.
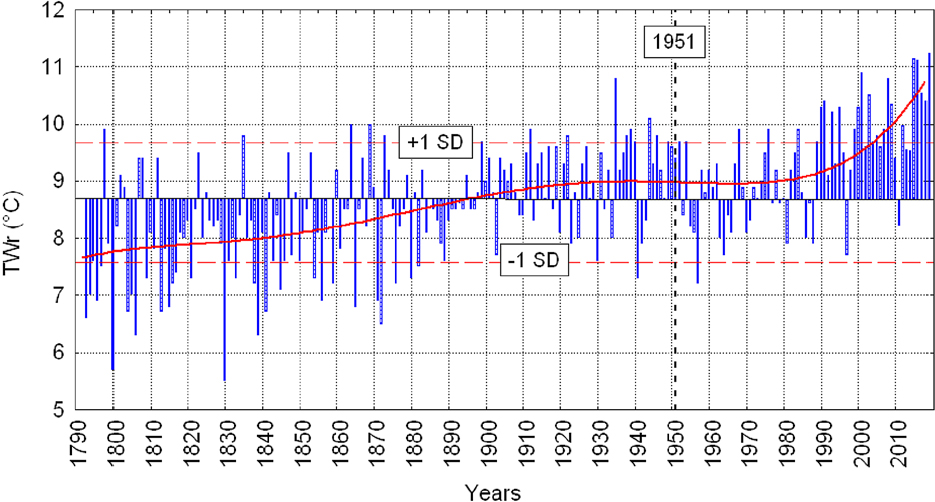
Fig. 2
The course of the annual air temperature in Wrocław (TWr) in the years 1791–2018 as a deviation from the long-term average. Continuous curve – adjustment of the polynomial to the power of 5 to the empirical courses. The year 1951 (vertical dotted line) is marked, the initial year of the period 1951–2018 analysed in detail. Horizontal dashed lines mark limits of the ±1 SD. SD – standard deviation.
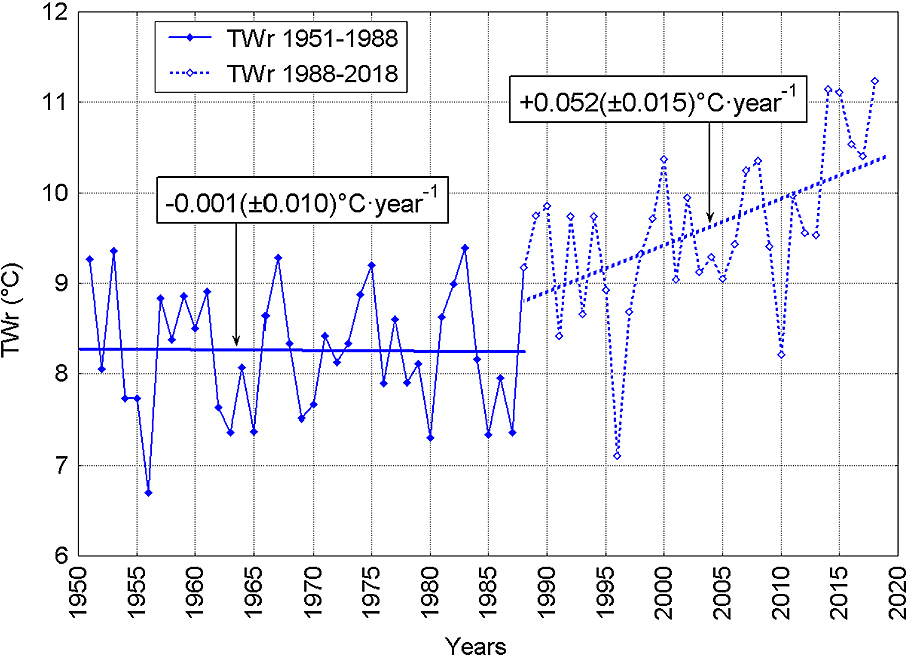
Fig. 3
The course of the annual air temperature in Wrocław (TWr) in the years 1951–2018. Significantly different courses in the periods 1951–1988 and 1988–2018 can be seen. Marked trends and their values in both periods.
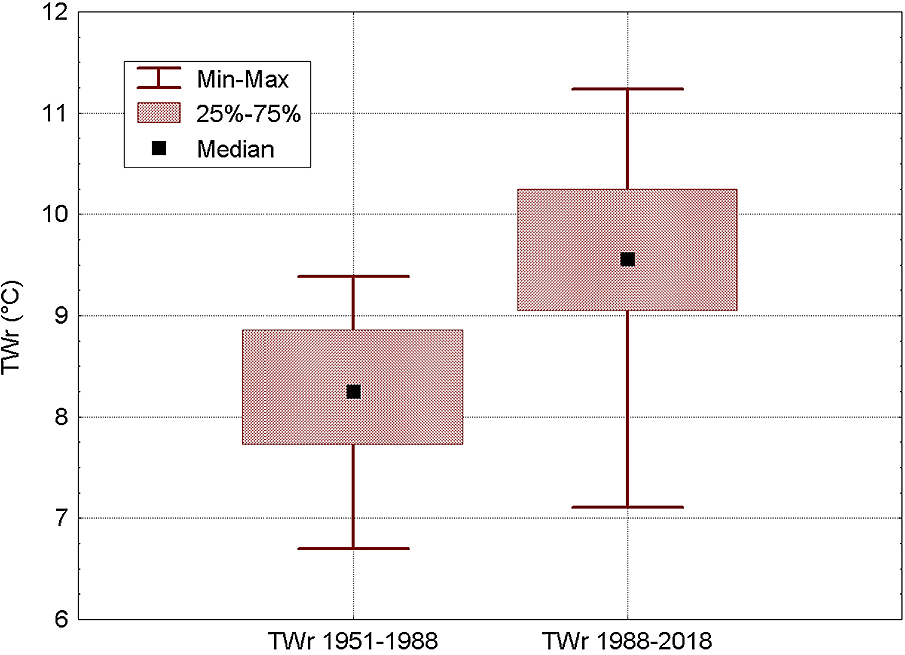
Fig. 4
Variation ranges of the annual air temperature in Wrocław (TWr) in both periods: 1951–1988 and 1988–2018. It appears noteworthy that in the second period, the lower limit of the second quartile is higher than the upper limit of the third quartile in the previous period, and the median in the second period is above the absolute maximum in the first period.
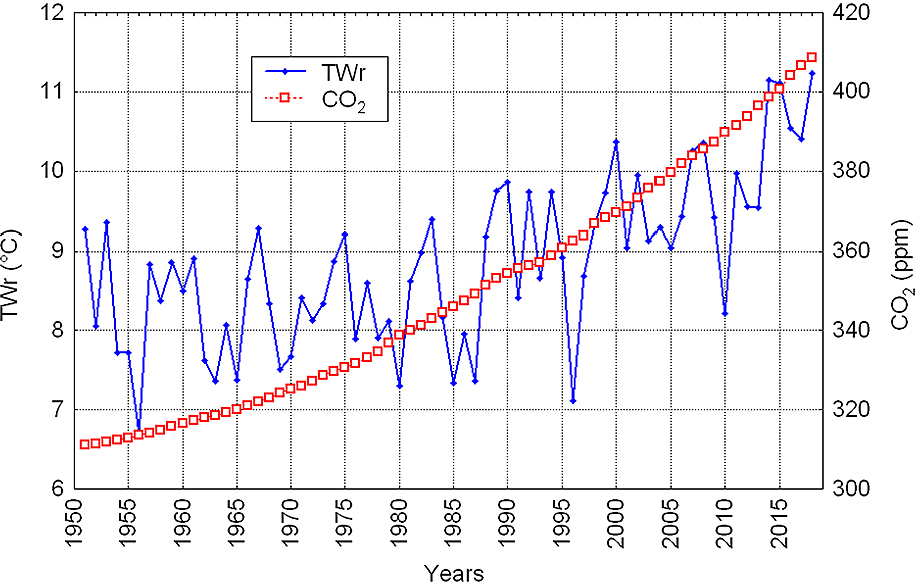
Fig. 5
The courses of the annual air temperature in Wrocław (TWr) and the average annual values of CO2 concentration in the atmosphere.
Table 1
Values of correlation coefficients (r) between monthly and annual cloudiness in Wrocław and air temperature in Wrocław (TWr) and their statistical significance (p). Analysis period: 1951–2018.
| Jan | Feb | Mar | Apr | May | Jun | Jul | Aug | Sep | Oct | Nov | Dec | Year | Jan |
|---|---|---|---|---|---|---|---|---|---|---|---|---|---|
| r | 0.100 | 0.210 | −0.180 | −0.340 | −0.380 | −0.330 | −0.520 | −0.24 | −0.450 | 0.010 | 0.090 | 0.130 | 0.120 |
| p | 0.401 | 0.092 | 0.152 | −0.004 | 0.001 | 0.006 | 0.000 | 0.053 | 0.000 | 0.929 | 0.477 | 0.280 | 0.344 |
[i] Significant correlations (p < 0.05) are in bold type. The values of p described as 0.000 mean that p < 0.001.
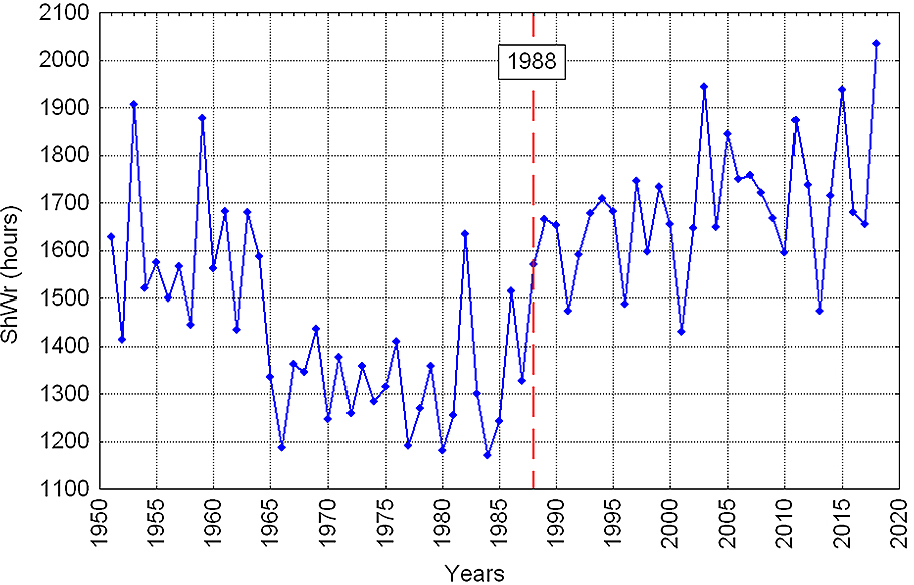
Fig. 6
The course of annual sunshine duration in Wroclaw ShWr. The vertical dashed line (1988) marks the moment of transition of significantly different courses of ShWr.
Table 2
Values of correlation coefficients (r) between monthly and annual sunshine, and monthly and annual air temperature in Wrocław (1951–2018) along with their statistical significance (p).
| Jan | Feb | Mar | Apr | May | Jun | Jul | Aug | Sep | Oct | Nov | Dec | Year | Jan |
|---|---|---|---|---|---|---|---|---|---|---|---|---|---|
| r | 0.070 | −0.110 | 0.270 | 0.640 | 0.620 | 0.660 | 0.810 | 0.740 | 0.610 | 0.140 | 0.020 | 0.140 | 0.610 |
| p | 0.583 | 0.381 | 0.025 | 0.000 | 0.000 | 0.000 | 0.000 | 0.000 | 0.000 | 0.248 | 0.847 | 0.239 | 0.000 |
[i] Symbols as in Table 1.
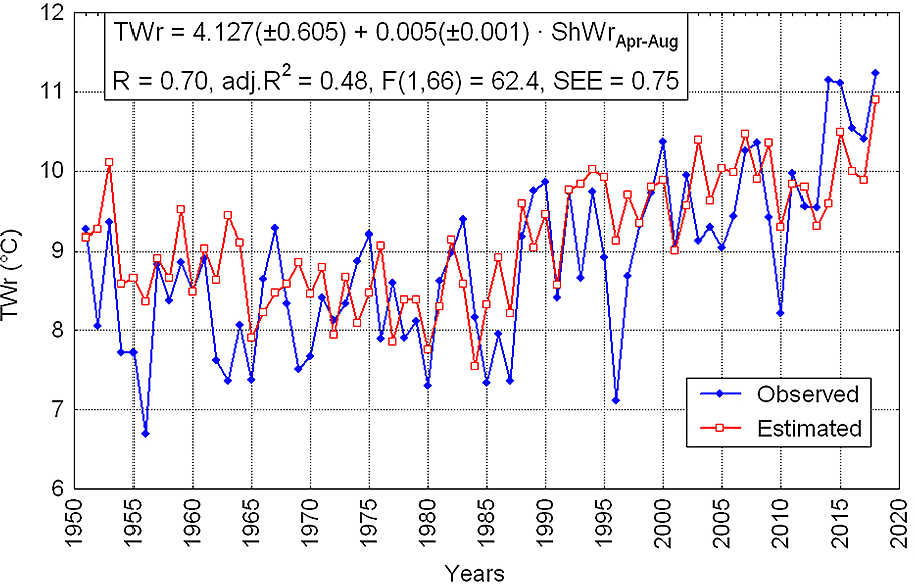
Fig. 7
The course of annual air temperature in Wrocław (TWr) and annual air temperature estimated based on long-day months of sunshine duration in Wroclaw (ShWrApr–Aug). The relationship between TWr and ShWrApr–Aug and its statistical characteristics are in the upper frame of the figure.
Table 3
Values of correlation coefficients (r) and their statistical significance (p) between (DJFM) winter NAO Hurrell index and monthly and annual air temperature in Wrocław (1951–2018).
| Month | Jan | Feb | Mar | Apr | May | Jun | Jul | Aug | Sep | Oct | Nov | Dec | Year |
|---|---|---|---|---|---|---|---|---|---|---|---|---|---|
| r | 0.570 | 0.460 | 0.610 | 0.190 | 0.190 | 0.020 | 0.210 | 0.320 | 0.230 | 0.140 | −0.160 | 0.240 | 0.580 |
| p | 0.000 | 0.000 | 0.000 | 0.114 | 0.125 | 0.895 | 0.080 | 0.008 | 0.058 | 0.258 | 0.198 | 0.052 | 0.000 |
[i] Symbols as in Table 1.
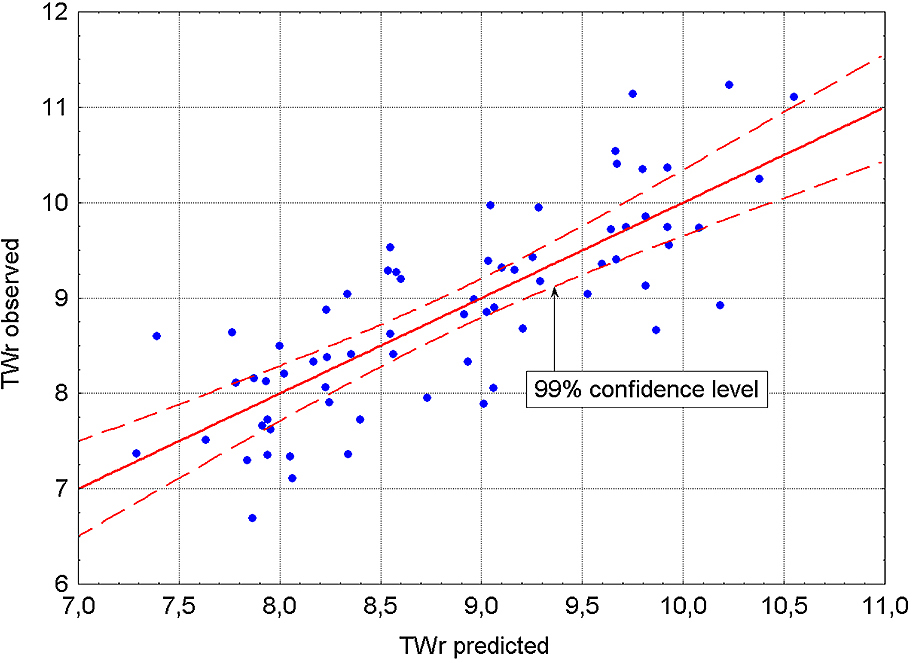
Fig. 8
The predicted (from Eq. (2)) values of annual air temperature in Wrocław (TWr) in relation to the observed values. The dotted line indicates 99% confidence interval (1951–2018).
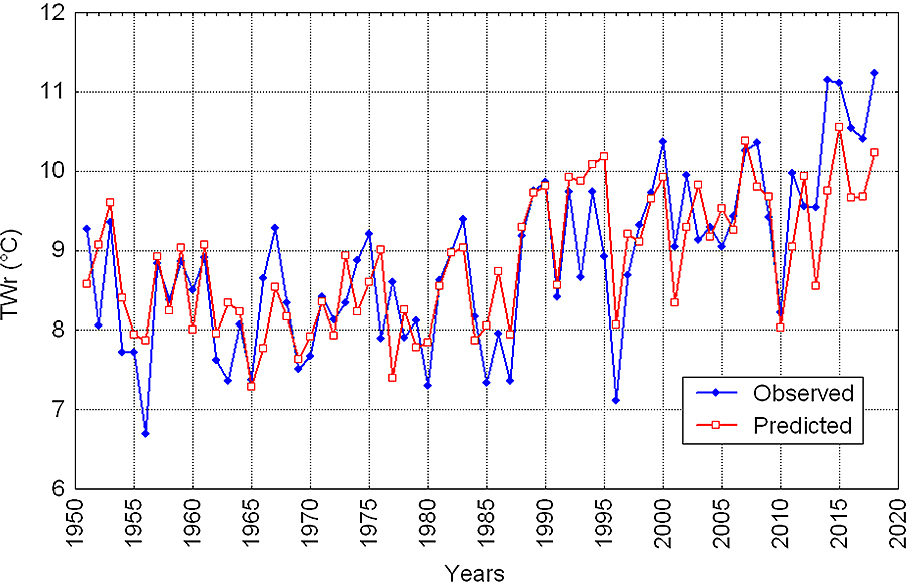
Fig. 9
The courses of the observed and predicted (from Eq. (2)) values of annual air temperature in Wrocław (TWr) in 1951–2018.
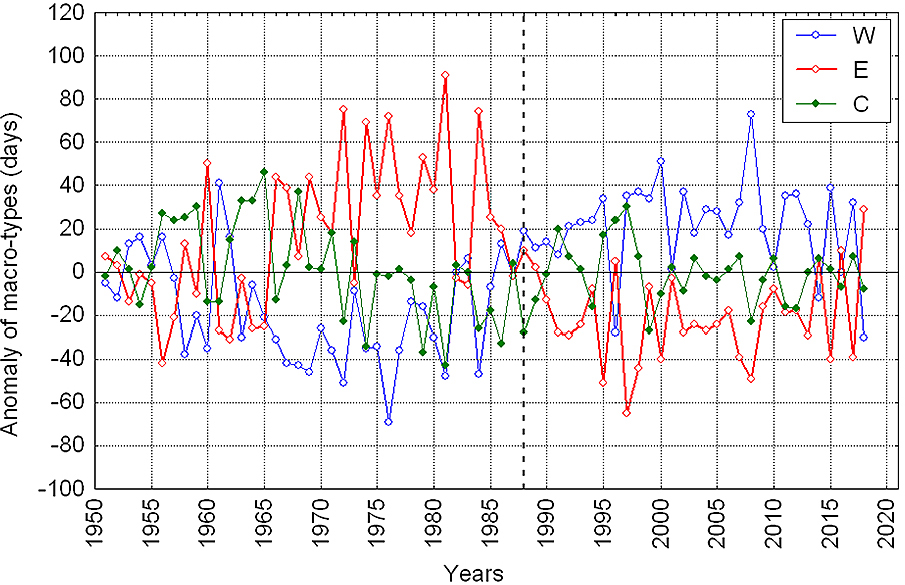
Fig. 10
The course of the anomaly of the annual frequency of W, E and C macro-types of the middle-tropospheric circulation according to the classification by Wangengejm-Girs. The anomalies are calculated with reference to averages from the period 1951–2015. The vertical dashed line marks the moment of transition of circulation epoch E to circulation epoch W.
Table 4
Values of correlation coefficients (r) and their statistical significance (p) between the annual frequency of W, E and C macro-types of the middle-tropospheric circulation and annual air temperature (TWr), annual sunshine duration (ShWr) and sunshine duration of the long-day months. (ShWrApr–Aug) and annual precipitation (PWr) in Wrocław (1951–2018). Markings as in Table 1.
| Macro-types | TWr | ShWr | ShWrApr–Aug | PWr | |
|---|---|---|---|---|---|
| W | r p | 0.470 0.000 | 0.620 0.000 | 0.630 0.000 | −0.310 0.010 |
| E | r p | −0.300 0.014 | −0.600 0.000 | −0.590 0.000 | 0.330 0.005 |
| C | r p | −0.240 0.047 | 0.090 0.488 | 0.040 0.729 | −0.100 0.431 |