
Table 1
Types of data, data collection techniques and instruments/data sources.
| No | Data | Collection method | Instrument/data sources |
|---|---|---|---|
| 1 | Palaeochannel location | Observation | GPS, geological compass, digital camera |
| Documentation | Documentation of Indonesian Topographical Map (Peta Rupabumi Indonesia or RBI Map) published by National Coordinator for Survey and Mapping Agency of Indonesia (2000) | ||
| Remote sensing image interpretation | Quickbird Imagery (2015) | ||
| 2 | Location of actual river valley | Observation | GPS, geological compass, digital camera |
| Documentation | Documentation of Indonesian Topographical Map (Peta Rupabumi Indonesia) | ||
| Remote sensing image interpretation | Quickbird Imagery (2015) | ||
| 3 | Morphography and morphometry of the landform at palaeochannel | Observation | Abney level, digital camera, observation guide |
| 4 | Geomorphological process | Observation | Digital camera, observation guide |
| 5 | Rock type | Literature study | Newhall et al. (2000), Andreastuti et al. (2000), Gertisser et al. (2012) |
| Observation | Geological hammer, geological compass | ||
| 6 | Land use | Documentation | Documentation of Indonesian Topographical Map (Peta Rupabumi Indonesia) |
| Observations | Digital camera, observation guide |
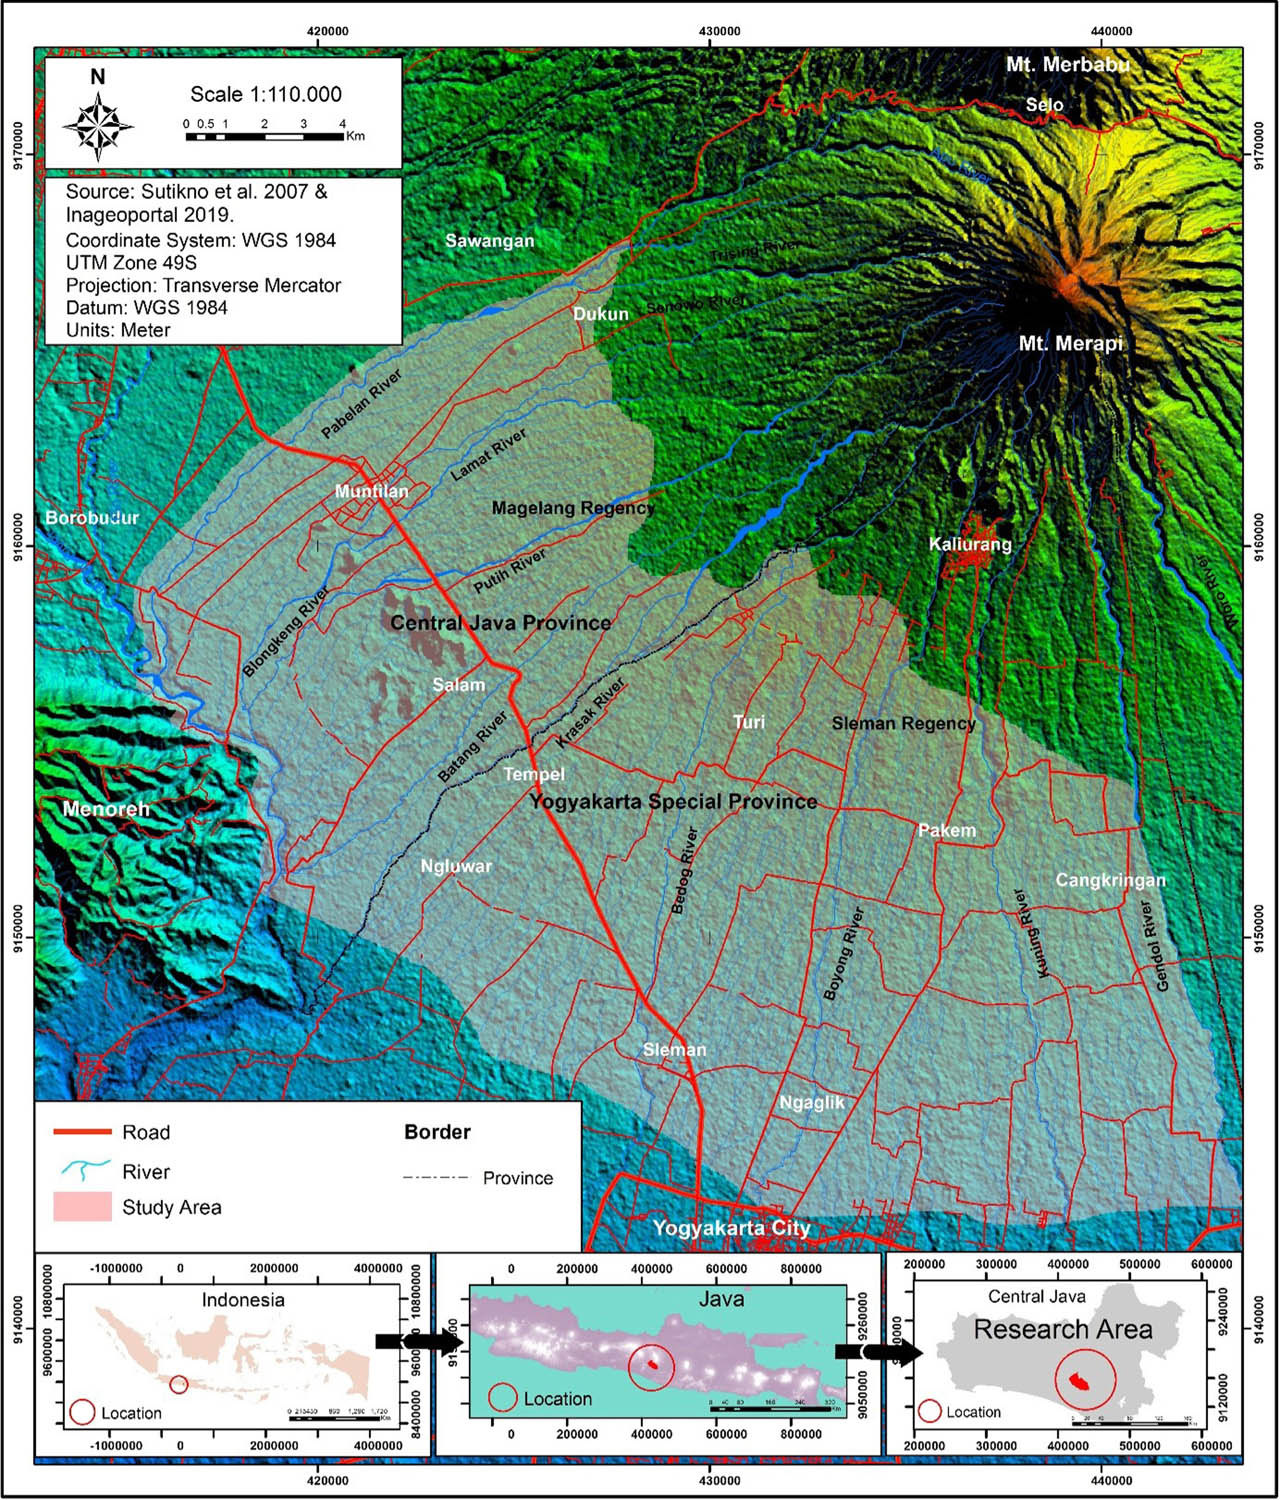
Fig. 1
Study area.
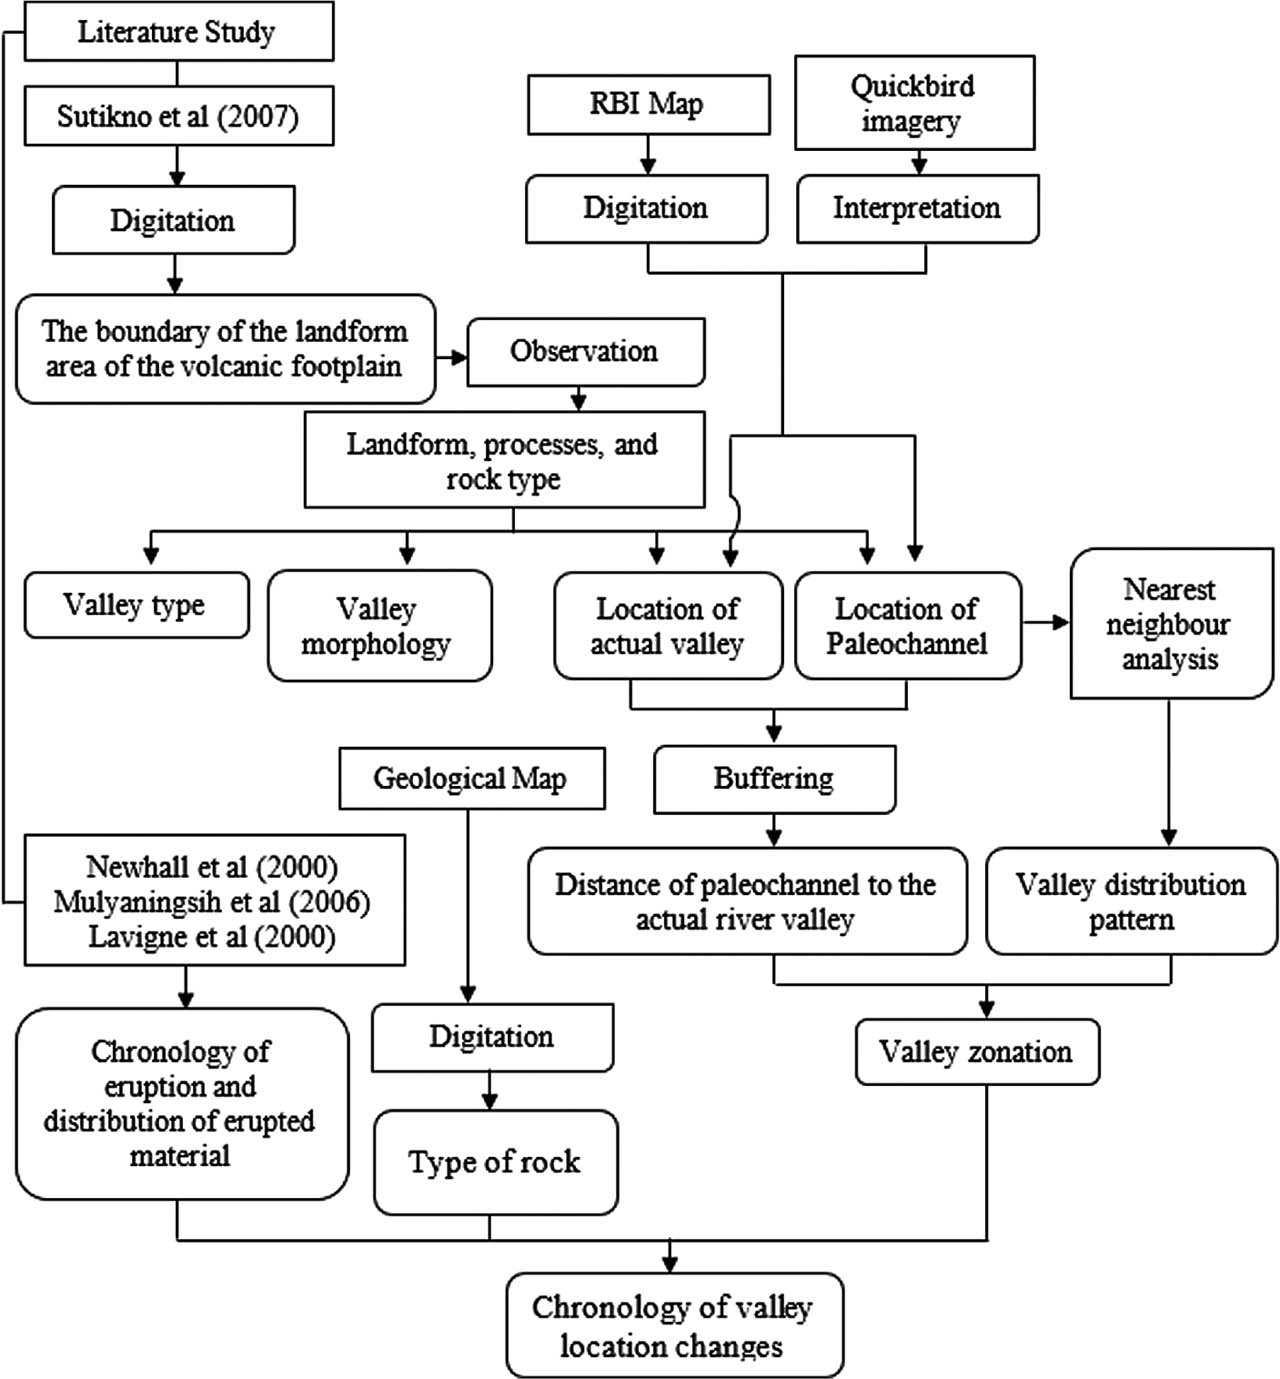
Fig. 2
Research procedure.
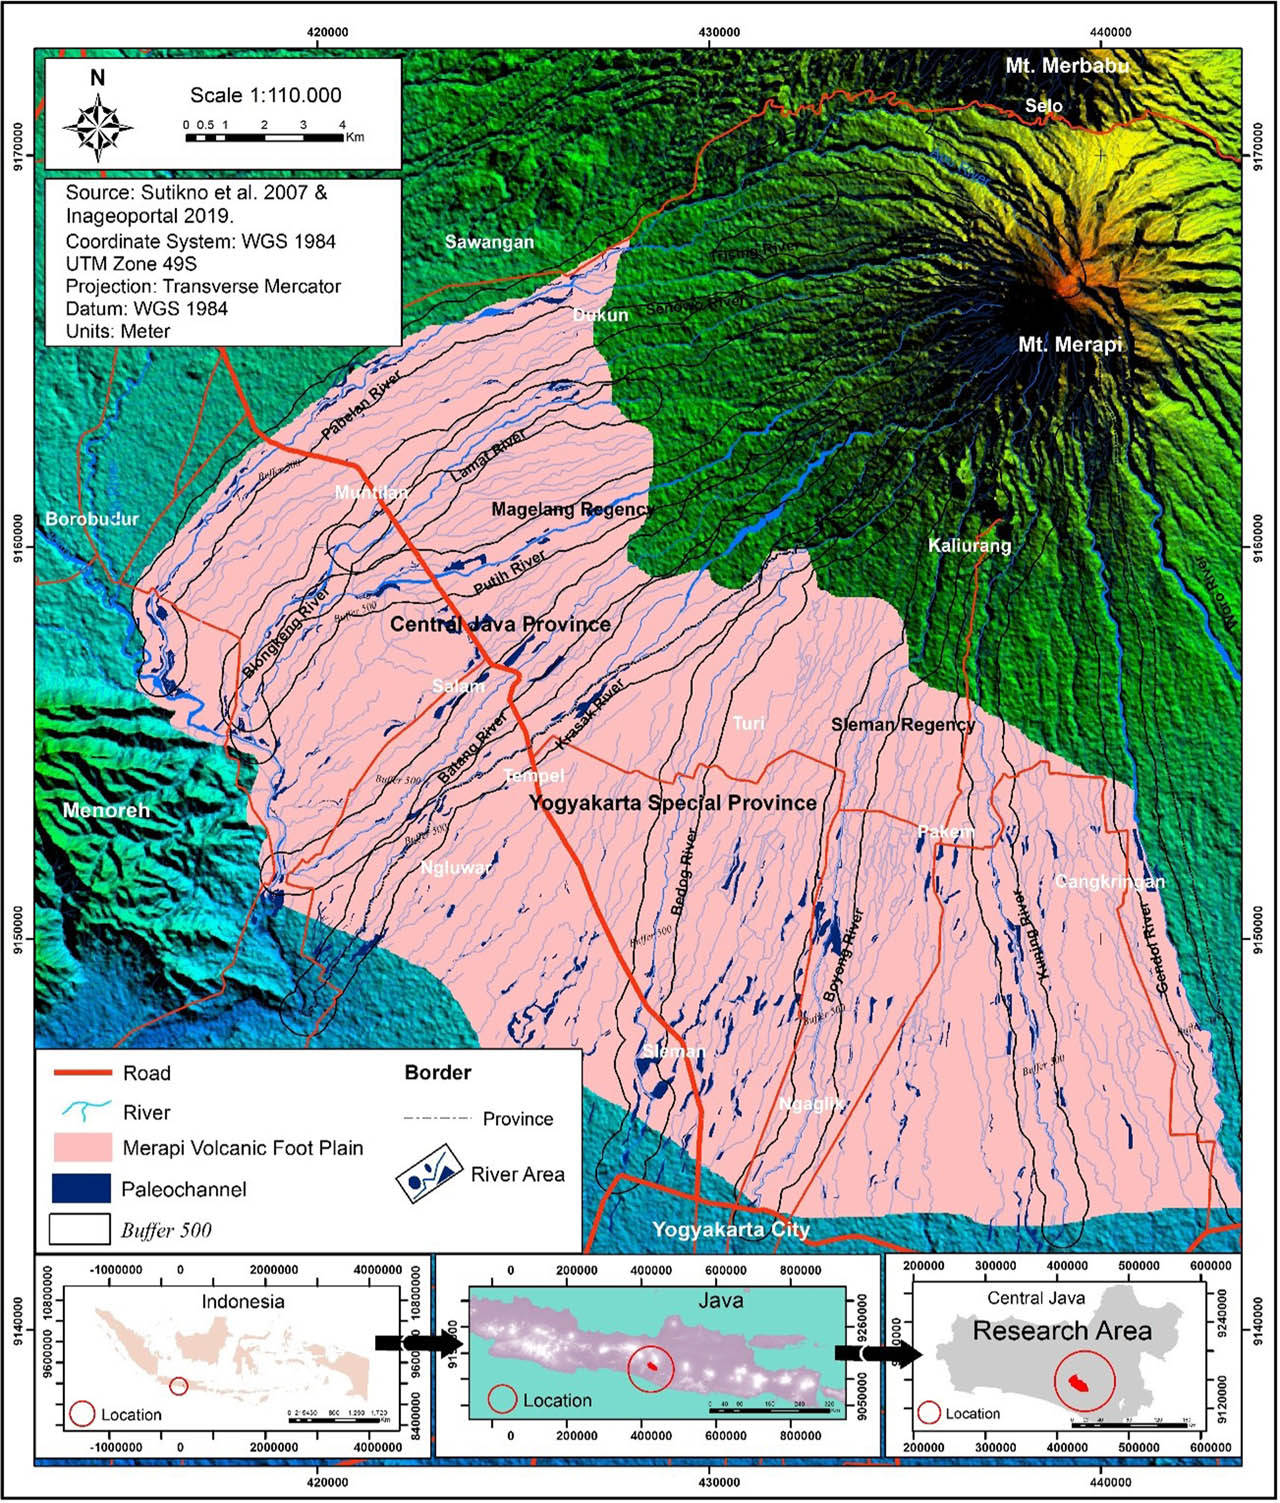
Fig. 3
Distribution of palaeochannel in study area.
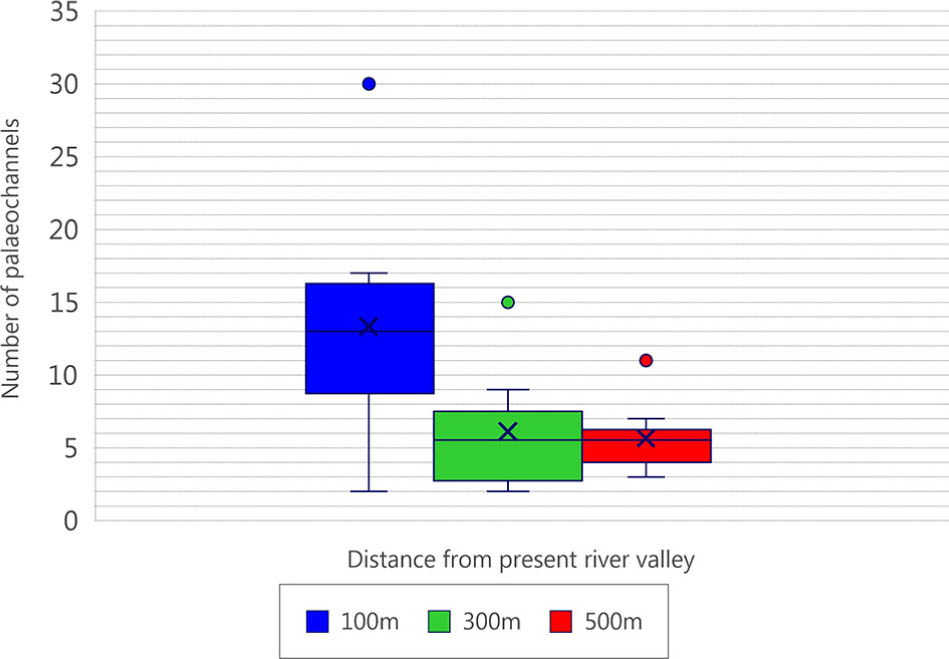
Fig. 4
The boxplot for the number of palaeochannels in the study area based on the distance from the present river valley.
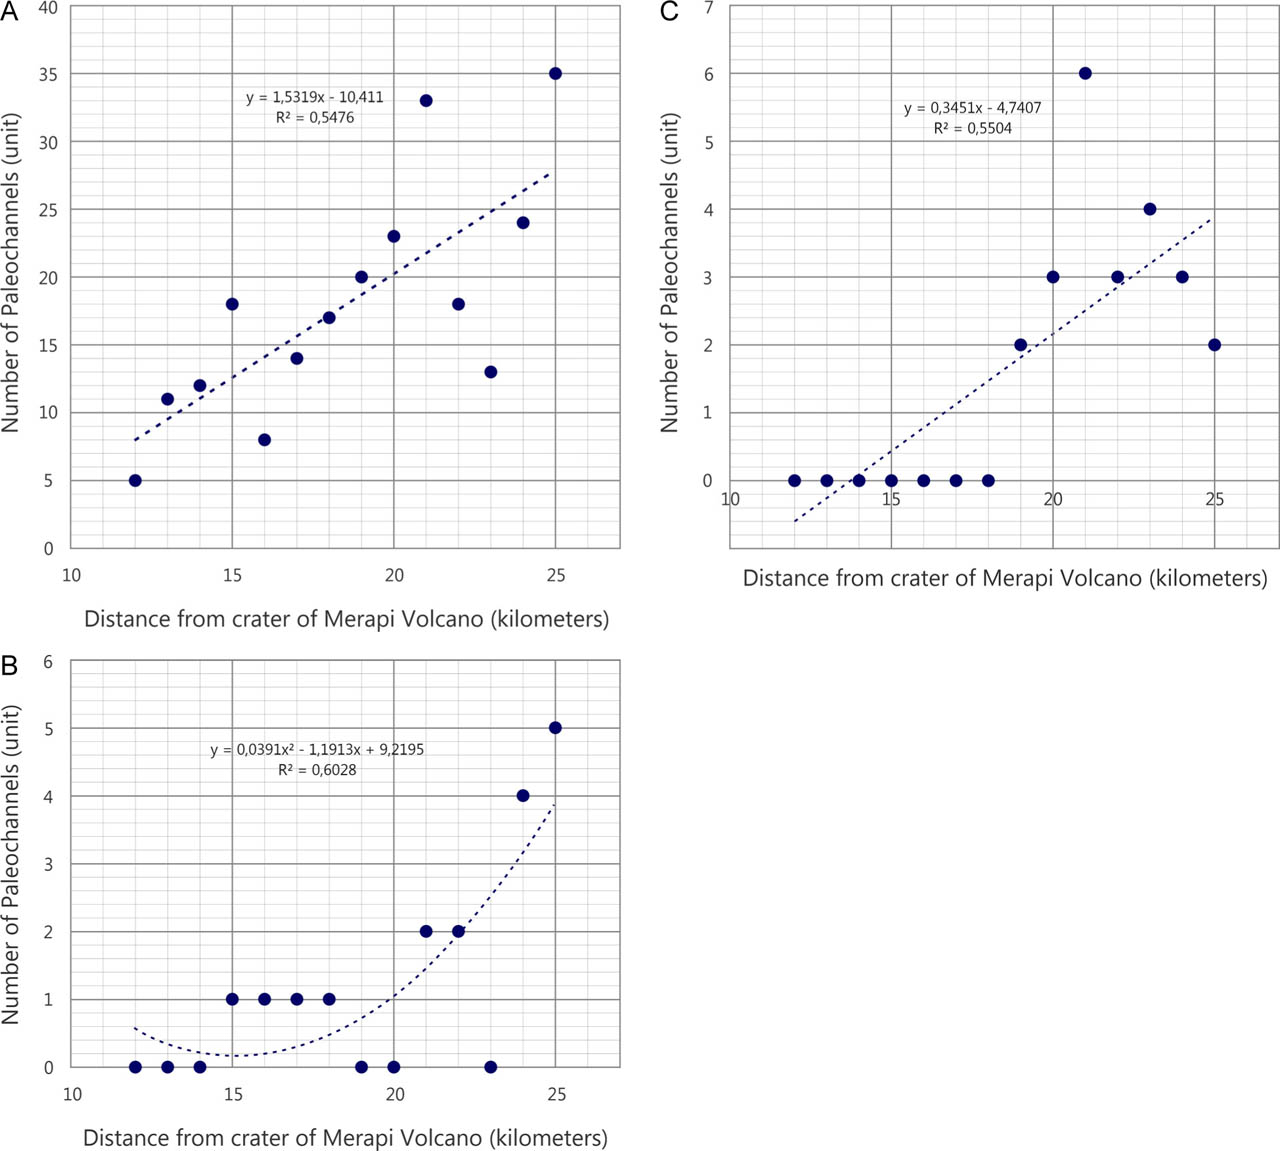
Fig. 5
The trend of the number of palaeochannels to the distance from the eruption center. (A) Entire area, (B) polynomial type from Batang River, (C) Linear type from Bedog River. Polynomial type indicates a change between increase and no increase in the number of palaeochannels, at each increase of downstream distance. Linear type shows that at each increase of downstream distance, there is an increase in the number of palaeochannels.
Table 2
The number of palaeochannels based on the distance from the eruption center.
| No. | River | The distance from crater [km] | Total | |||||||||||||
|---|---|---|---|---|---|---|---|---|---|---|---|---|---|---|---|---|
| 12 | 13 | 14 | 15 | 16 | 17 | 18 | 19 | 20 | 21 | 22 | 23 | 24 | 25 | |||
| 1 | Gendol | 0 | 0 | 0 | 4 | 0 | 0 | 2 | 4 | 7 | 3 | 0 | 0 | 9 | 0 | 20 |
| 2 | Kuning | 0 | 0 | 5 | 5 | 1 | 3 | 5 | 2 | 1 | 1 | 0 | 1 | 1 | 0 | 25 |
| 3 | Boyong | 0 | 0 | 0 | 1 | 2 | 6 | 4 | 2 | 2 | 2 | 0 | 1 | 2 | 2 | 24 |
| 4 | Bedog | 0 | 0 | 0 | 0 | 0 | 0 | 0 | 2 | 3 | 6 | 3 | 4 | 3 | 2 | 23 |
| 5 | Krasak | 0 | 0 | 0 | 1 | 1 | 1 | 0 | 2 | 2 | 5 | 2 | 0 | 2 | 10 | 26 |
| 6 | Batang | 0 | 0 | 0 | 1 | 1 | 1 | 1 | 0 | 0 | 2 | 2 | 0 | 4 | 5 | 17 |
| 7 | Putih | 0 | 0 | 1 | 2 | 2 | 1 | 2 | 2 | 3 | 4 | 1 | 2 | 3 | 1 | 24 |
| 8 | Lamat | 0 | 5 | 2 | 1 | 0 | 0 | 0 | 0 | 2 | 2 | 0 | 0 | 0 | 0 | 12 |
| 9 | Blongkeng | 0 | 4 | 2 | 2 | 0 | 0 | 0 | 2 | 2 | 5 | 2 | 2 | 7 | 1 | 29 |
| 10 | Pabelan | 5 | 2 | 2 | 1 | 1 | 2 | 3 | 4 | 1 | 3 | 8 | 3 | 2 | 14 | 51 |
| Total | 5 | 11 | 12 | 18 | 8 | 14 | 17 | 20 | 23 | 33 | 18 | 13 | 14 | 35 | 251 | |
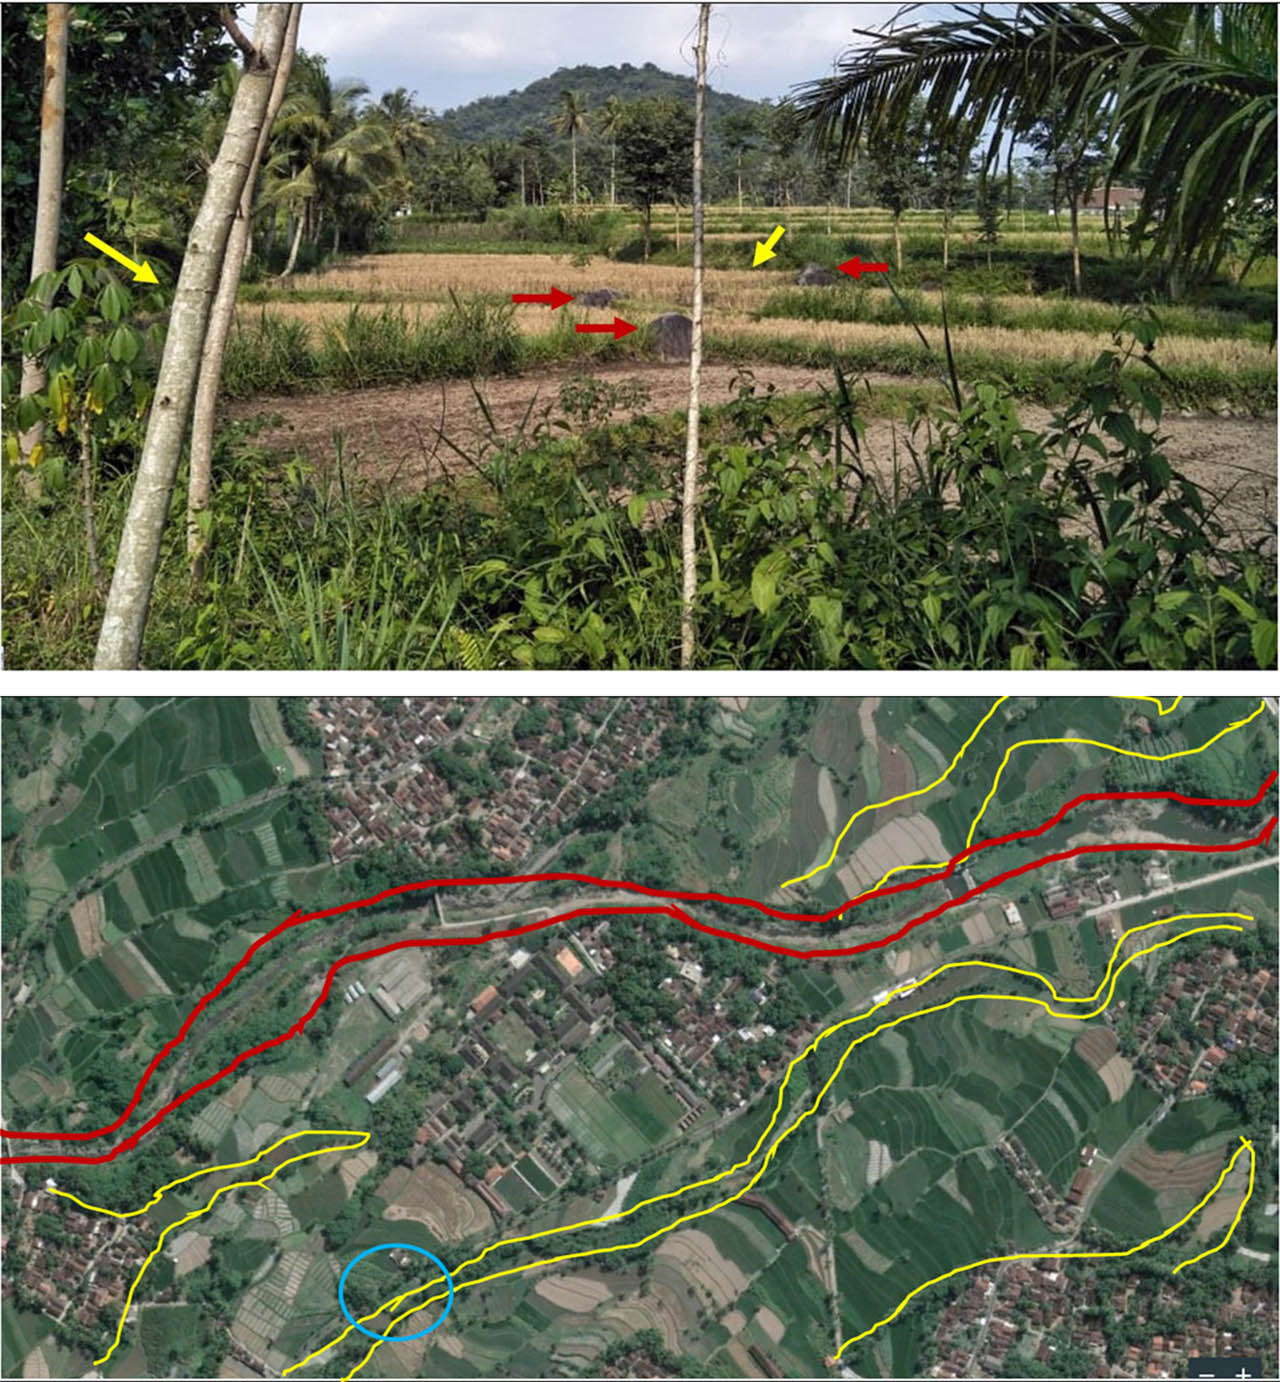
Fig. 6
The morphological characteristics of one of the palaeochannels in the Putih River. Above: The field situation (2019) shows a concave morphology (yellow arrow) with a depth of 1 m and base material of lahar deposits (red arrow). Below: plan view on Google Earth image (2019) shows several palaeochannels (yellow lines) around the current Putih River valleys (red lines).
Table 3
The morphometrical measurement of the palaeochannel in the research area.
| River area | Depth [m] | Width [m] | Slope [%] | |||||||||||||||
|---|---|---|---|---|---|---|---|---|---|---|---|---|---|---|---|---|---|---|
| n | Mean | Median | SD | Max | Min | N | Mean | Median | SD | Max | Min | n | Mean | Median | SD | Max | Min | |
| Gendol | 4 | 1.25 | 1.0 | 0.5 | 2.0 | 1.0 | 4 | 88.00 | 67.0 | 64.02 | 180 | 38 | 4 | 5.00 | 5 | 0.00 | 5 | 5 |
| Kuning | 5 | 2.00 | 2.0 | 0.71 | 3.0 | 1.0 | 5 | 69.00 | 65.0 | 9.72 | 83 | 60 | 5 | 4.20 | 5 | 1.10 | 5 | 3 |
| Boyong | 7 | 1.14 | 1.0 | 0.38 | 2.0 | 1.0 | 7 | 67.43 | 60.0 | 25.01 | 112 | 44 | 7 | 9.86 | 10 | 4.26 | 18 | 5 |
| Bedog | 5 | 2.00 | 2.0 | 1.00 | 3.0 | 1.0 | 5 | 75.40 | 87.0 | 45.81 | 122 | 21 | 5 | 3.40 | 3 | 1.67 | 5 | 1 |
| Krasak | 11 | 2.00 | 2.0 | 1.20 | 4.0 | 0.5 | 11 | 169.27 | 162.0 | 53.89 | 277 | 91 | 11 | 3.73 | 3 | 1.01 | 5 | 3 |
| Batang | 7 | 1.14 | 1.0 | 0.63 | 2.0 | 0.5 | 7 | 96.57 | 82.0 | 57.57 | 179 | 11 | 7 | 2.71 | 3 | 0.76 | 3 | 1 |
| Putih | 8 | 1.19 | 1.0 | 1.16 | 4.0 | 0.5 | 8 | 66.88 | 54.5 | 39.24 | 155 | 33 | 8 | 3.25 | 3 | 0.71 | 5 | 3 |
| Lamat | 5 | 1.20 | 1.0 | 0.45 | 2.0 | 1.0 | 5 | 36.40 | 25.0 | 26.68 | 83 | 19 | 5 | 8.80 | 7 | 2.49 | 12 | 7 |
| Blong keng | 4 | 0.50 | 0.5 | 0.00 | 0.5 | 0.5 | 4 | 65.50 | 64.0 | 26.71 | 96 | 38 | 4 | 3.00 | 3 | 0.00 | 3 | 3 |
| Pabelan | 4 | 0.88 | 1.0 | 0.25 | 1.0 | 0.5 | 4 | 58.25 | 55.0 | 22.02 | 88 | 35 | 4 | 9.75 | 10 | 2.22 | 12 | 7 |
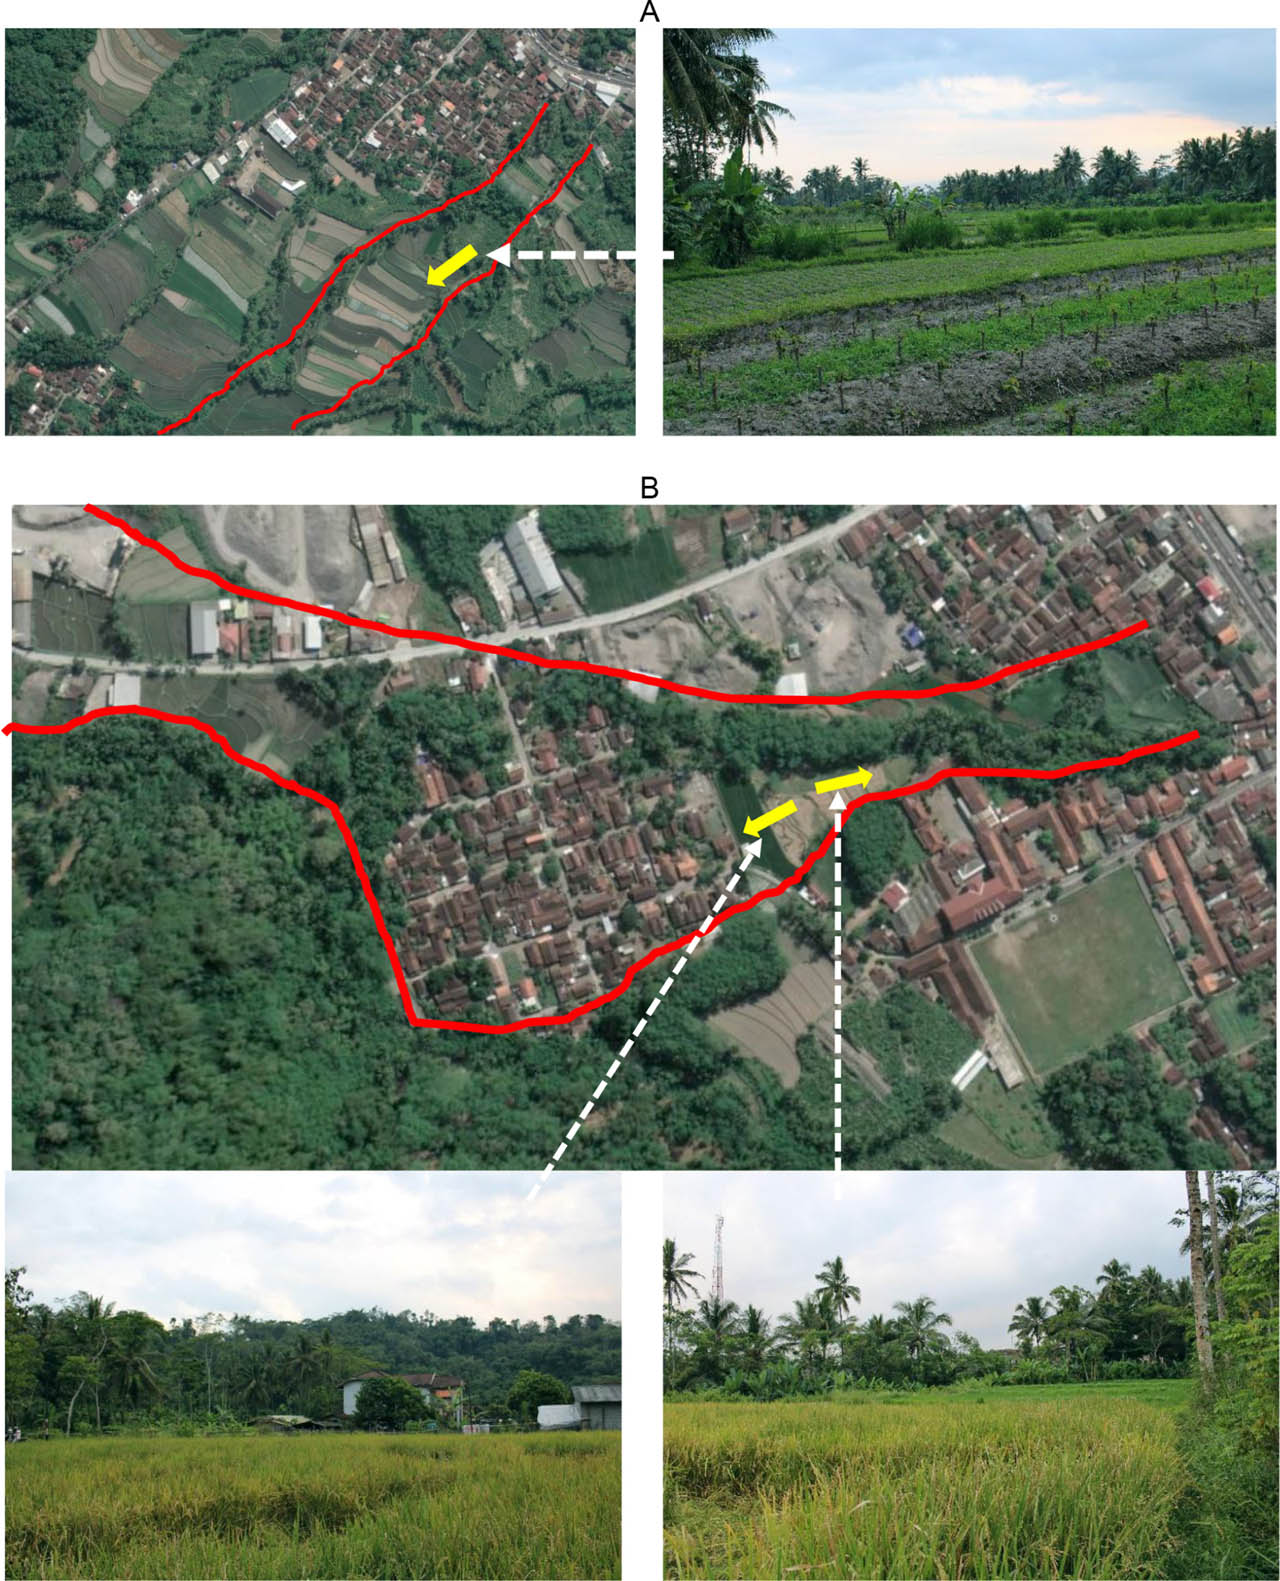
Fig. 7
The influences of topography on palaeochannel distribution in the southwest sector of Merapi volcanic foot. (A) palaeochannel which is deflected from NNE–SSW to ESE–WNW by Gendol Hill (bounded by red lines), located 230 m at the eastern of the Putih River, precisely at the north bank of Gendol Hill with altitude of 359 masl., (B) a non-deflected palaeochannel, NE–SW direction (bounded by red lines), located 400 m from the eastern edge of the Gendol Hills and 304 m at the western of the actual Batang River with altitude of 355 m a.s.l. Yellow arrows show the orientation of the field photograph. Source: Google Earth (2021).