
Table 1
Methodology for calculating the innovation attractiveness index.
| Indicator | Calculation method and impact on attractiveness for migration of highly qualified personnel | Data source, period |
|---|---|---|
| Level of innovation activity, % | Calculated as share of innovative companies in total number of companies in region; Enables assessing market of employers who are potentially interested in highly qualified specialists and representatives of creative class; | The efficiency of the Russian economy. Rosstat. https://rosstat.gov.ru/folder/11186, 2011–2018 |
| Number of high-performance workplaces per employed, units | Calculated as ratio of number of high-performance workplaces to average number of employees; It provides estimate of jobs created at enterprises whose employees receive average monthly wage above threshold value necessary to ensure development of economy; For individual entrepreneurs, average revenue is taken into account; | The efficiency of the Russian economy. Rosstat. https://rosstat.gov.ru/folder/11186, 2013–2019 |
| Coefficient of inventive activity, units per 10,000 people | Calculated as number of domestic patent applications for inventions filed in Russia per 10,000 people; Evaluates creativity of labour resources in region; | The efficiency of the Russian economy. Rosstat. https://rosstat.gov.ru/folder/11186, 2011–2018 |
| Researchers under age of 39 per total number of researchers, % | Calculated as share of researchers under age of 39 in total number of researchers; Evaluates human resources potential of science, which is of decisive importance for generation of scientific and technical knowledge as basis for innovation; | Target indicators for the implementation of the Strategy for innovative development of the Russian Federation for the period up to 2020. Rosstat. https://rosstat.gov.ru/folder/14477#, 2011–2018 |
| Average nominal wages, units | Calculated as ratio of average nominal wage in region to average nominal wage in Russia; Evaluates attractiveness of region's labour market. | Average monthly nominal and real wages of employees of organisations. Rosstat. https://rosstat.gov.ru/labor_market_employment_salaries, 2013–2019 |
[i] Source: calculation by the authors.
Table 2
Gross migration and balance of migration in coastal and inland regions of Russia in 1993–2018.
| Migration intensity coefficient, per 1,000 people | Share of total value in Russia, % | |||||||||||||||
|---|---|---|---|---|---|---|---|---|---|---|---|---|---|---|---|---|
| International | Interregional | International | Interregional | |||||||||||||
| 1993–1996 | 1997–2002 | 2003–2010 | 2011–2018 | 1993–1996 | 1997–2002 | 2003–2010 | 2011–2018 | 1993–1996 | 1997–2002 | 2003–2010 | 2011–2018 | 1993–1996 | 1997–2002 | 2003–2010 | 2011–2018 | |
| Gross migration | ||||||||||||||||
| Coastal regions | 9.9 | 3.8 | 1.7 | 7.4 | 23.9 | 17.7 | 13.8 | 32.7 | 25.4 | 22.8 | 20.4 | 31.5 | 28.9 | 27.9 | 26.6 | 29.0 |
| Inland regions | 8.6 | 3.8 | 1.9 | 5.0 | 17.2 | 13.3 | 11.2 | 25.0 | 74.6 | 77.2 | 79.6 | 68.5 | 71.1 | 72.1 | 73.4 | 71.0 |
| Inland regions excluding Moscow | 8.9 | 3.9 | 2.0 | 5.2 | 17.7 | 13.5 | 11.4 | 24.4 | 71.4 | 72.1 | 74.2 | 63.4 | 67.0 | 66.6 | 67.1 | 61.7 |
| Moscow | 4.6 | 2.9 | 1.3 | 3.3 | 13.5 | 11.7 | 9.8 | 29.7 | 3.2 | 5.1 | 5.4 | 5.0 | 4.4 | 5.5 | 6.4 | 9.3 |
| Russia | 8.9 | 3.8 | 1.9 | 5.6 | 18.8 | 14.3 | 11.8 | 26.9 | 100.0 | 100.0 | 100.0 | 100.0 | 100.0 | 100.0 | 100.0 | 100.0 |
| Migration balance | ||||||||||||||||
| Coastal regions | 13.0 | 5.5 | 7.0 | 15.7 | −7.2 | −7.3 | −1.8 | 8.9 | 18.9 | 14.5 | 17.9 | 24.1 | – | – | – | – |
| Inland regions | 16.3 | 9.5 | 9.3 | 15.3 | 3.6 | 3.1 | 0.6 | –2.8 | 81.1 | 85.5 | 82.1 | 75.9 | – | – | – | – |
| Inland regions excluding Moscow | 17.6 | 9.8 | 9.7 | 16.2 | 3.1 | 0.8 | −3.3 | −9.2 | 80.7 | 80.2 | 76.9 | 71.5 | – | – | – | – |
| Moscow | 1.1 | 6.8 | 5.8 | 8.2 | 4.9 | 27.3 | 35.7 | 48.8 | 0.4 | 5.3 | 5.2 | 4.4 | – | – | – | – |
| Russia | 15.6 | 8.6 | 8.8 | 15.4 | – | – | – | – | 100.0 | 100.0 | 100.0 | 100.0 | – | – | – | – |
[i] Source: calculated by the authors.
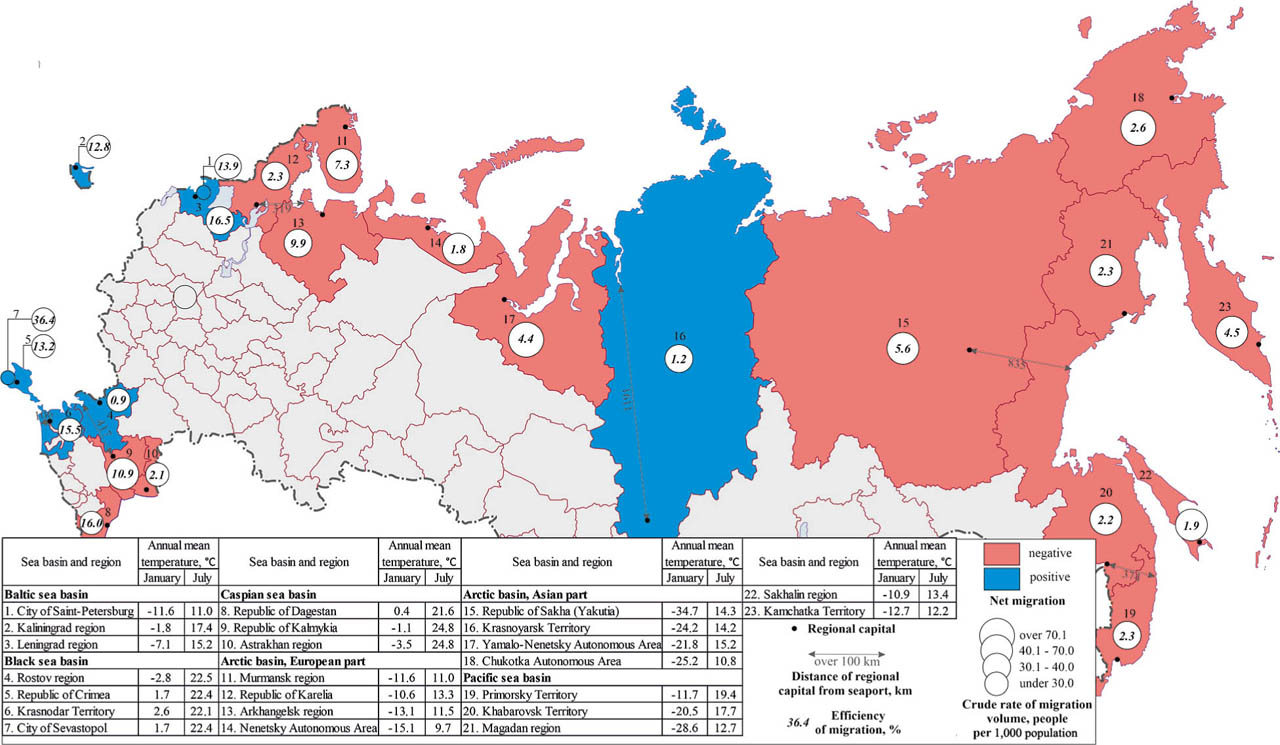
Fig. 1
The effectiveness of permanent migration in Russian coastal regions on average, 2011–2018.
Table 3
Russian coastal regions by the crude rate of net migration for 2011–2018.
| Crude rate of net migration, per 1,000 people | Centre of migrants’ attraction from other countries (>10.0) | Centre of migrants’ attraction from other countries (>10.0) with compensation for interregional outflow, % | Territories with average (5.0–9.9) and low (0.0–4.9) level of attraction of migrants from other countries with compensation for interregional outflow, % | |||||||||
|---|---|---|---|---|---|---|---|---|---|---|---|---|
| 100 | 50–75 | 30–40 | 0–20 | 100 | 30–40 | 0–20 | ||||||
| Centre of migrants’ attraction from other regions of Russia (>10.0) | LEN | SEV | KDA | |||||||||
| KGD | SPE | |||||||||||
| Average (5.0–9.9) and low (0.0–4.9) level of attraction of migrants from other regions of Russia | CR | |||||||||||
| Low (−4.9 to 0.0) and medium (−14.9 to −5.0) outflow of migrants to other regions of Russia | KYA | ROS | ||||||||||
| Strong outflow of migrants to other regions of Russia (<−15.0) | SAK | AST | KHA | MUR | PRI | SA | KL | |||||
| YAN | KAM | CHU | MAG | KR | DA | ARK | ||||||
| NEN | ||||||||||||
[i] Note: The benchmark for determining the severity of migration processes are the national average values of the crude rate of net migration. The abbreviated names of the regions of the Russian Federation are given in accordance with the classification of the ISO. The blue frame stands for regions of a ‘core’ of migrants’ attraction; the regions with an extremely weak manifestation of the specifics of migration processes are highlighted in the green frame; yellow frame – regions that combine the pronounced roles of the centre of migrants’ attraction from other countries and the outflow area to other Russian regions with a high share of replacement of the outflow by the inflow (more than 50%); red frame – regions of the outflow area of migrants.
[ii] Source: developed by the authors.
[iii] ISO – International Organization for Standardization.
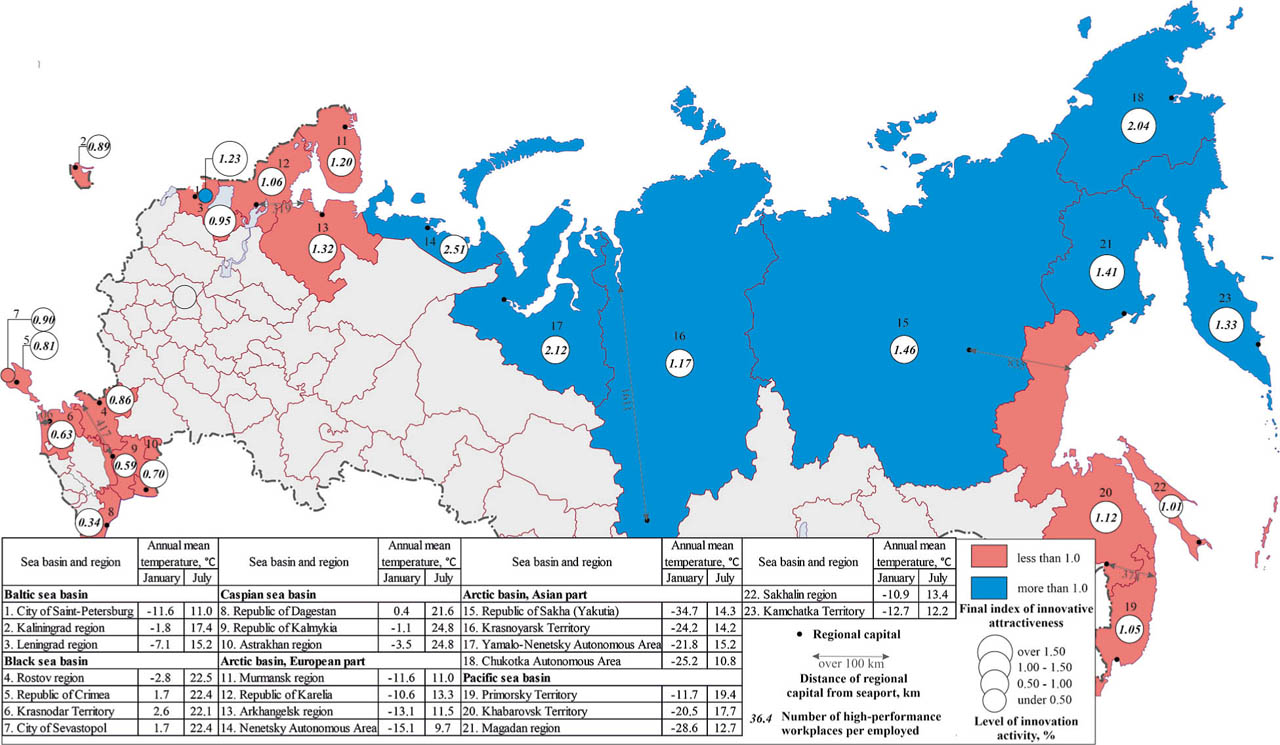
Fig. 2
The innovation performance of the coastal regions of Russia, 2011–2018.
Table 4
Assessment of the coastal regions of Russia by some indicators of innovative attractiveness, 2011–2019.
| Region | Level of innovation activity, % | Coefficient of inventive activity, units per 10,000 people | Researchers under age of 39 per total number of researchers, % | Number of high-performance workplaces per employed | Average nominal wages |
|---|---|---|---|---|---|
| Russian Federation | 9.29 | 1.82 | 41.46 | 0.25 | – |
| Arkhangelsk region | 5.81 | 0.72 | 49.58 | 0.33 | 1.03 |
| Astrakhan region | 8.55 | 0.82 | 41.66 | 0.17 | 0.75 |
| Sevastopol | 3.68 | 1.24 | 32.06 | 0.22 | 0.51 |
| St. Petersburg | 17.20 | 3.37 | 41.28 | 0.31 | 1.32 |
| Kaliningrad region | 4.14 | 0.65 | 39.55 | 0.22 | 0.80 |
| Kamchatka Krai | 14.45 | 0.34 | 42.30 | 0.33 | 1.65 |
| Krasnodar region | 7.71 | 0.95 | 39.73 | 0.16 | 0.78 |
| Krasnoyarsk region | 8.62 | 1.33 | 48.36 | 0.29 | 1.02 |
| Leningrad region | 9.35 | 0.67 | 29.80 | 0.24 | 0.98 |
| Magadan region | 17.16 | 0.49 | 30.90 | 0.35 | 1.92 |
| Murmansk region | 8.99 | 0.45 | 36.68 | 0.30 | 1.32 |
| Nenets Autonomous Okrug | 6.15 | 0.23 | 63.00 | 0.63 | 1.97 |
| Primorsky Krai | 7.68 | 0.97 | 34.48 | 0.26 | 0.98 |
| Republic of Dagestan | 5.65 | 1.67 | 31.10 | 0.08 | 0.57 |
| Republic of Kalmykia | 2.35 | 0.72 | 44.94 | 0.15 | 0.59 |
| Republic of Karelia | 7.64 | 0.47 | 40.28 | 0.26 | 0.90 |
| Republic of Crimea | 5.27 | 0.31 | 32.54 | 0.20 | 0.48 |
| Republic of Sakha (Yakutia) | 7.45 | 0.78 | 38.33 | 0.36 | 1.48 |
| Rostov region | 8.32 | 1.57 | 46.71 | 0.21 | 0.72 |
| Sakhalin region | 3.70 | 0.17 | 47.64 | 0.25 | 1.74 |
| Khabarovsk region | 10.49 | 1.10 | 35.11 | 0.28 | 1.10 |
| Chukotka Autonomous District | 16.04 | 0.20 | 67.27 | 0.51 | 2.31 |
| Yamalo-Nenets Autonomous District | 7.46 | 0.50 | 50.53 | 0.53 | 2.26 |
[i] Source: developed by the authors based on Table 1.
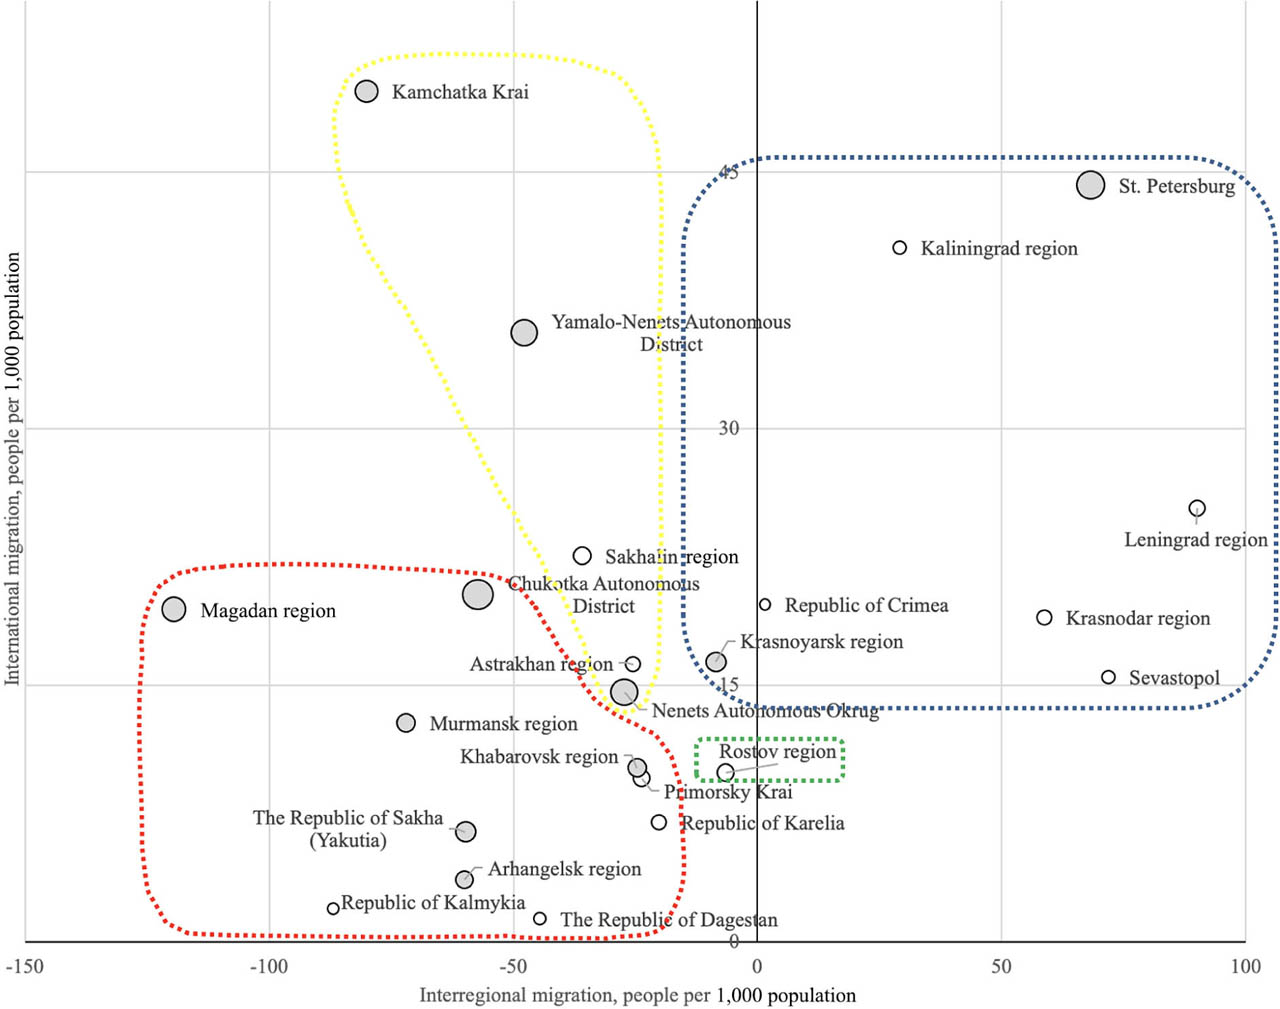
Fig. 3
The ratio of the final index of innovative performance and indicators of interregional and international migration in 2011–2018.
Note: The circle diameter indicates the value of the innovation performance index. Regions with an index greater than 1 are shown in grey. The blue frame is used for migration core regions attracting the majority of people; the regions with an extremely weak manifestation of the specifics of migration processes are in the green frame; yellow frame shows regions that combine the pronounced roles of the centre of migration from other countries and the outflow to other Russian regions with a high share of replacement of the outflow by the inflow (more than 50%); red frame shows regions of the outflow area of migrants.