
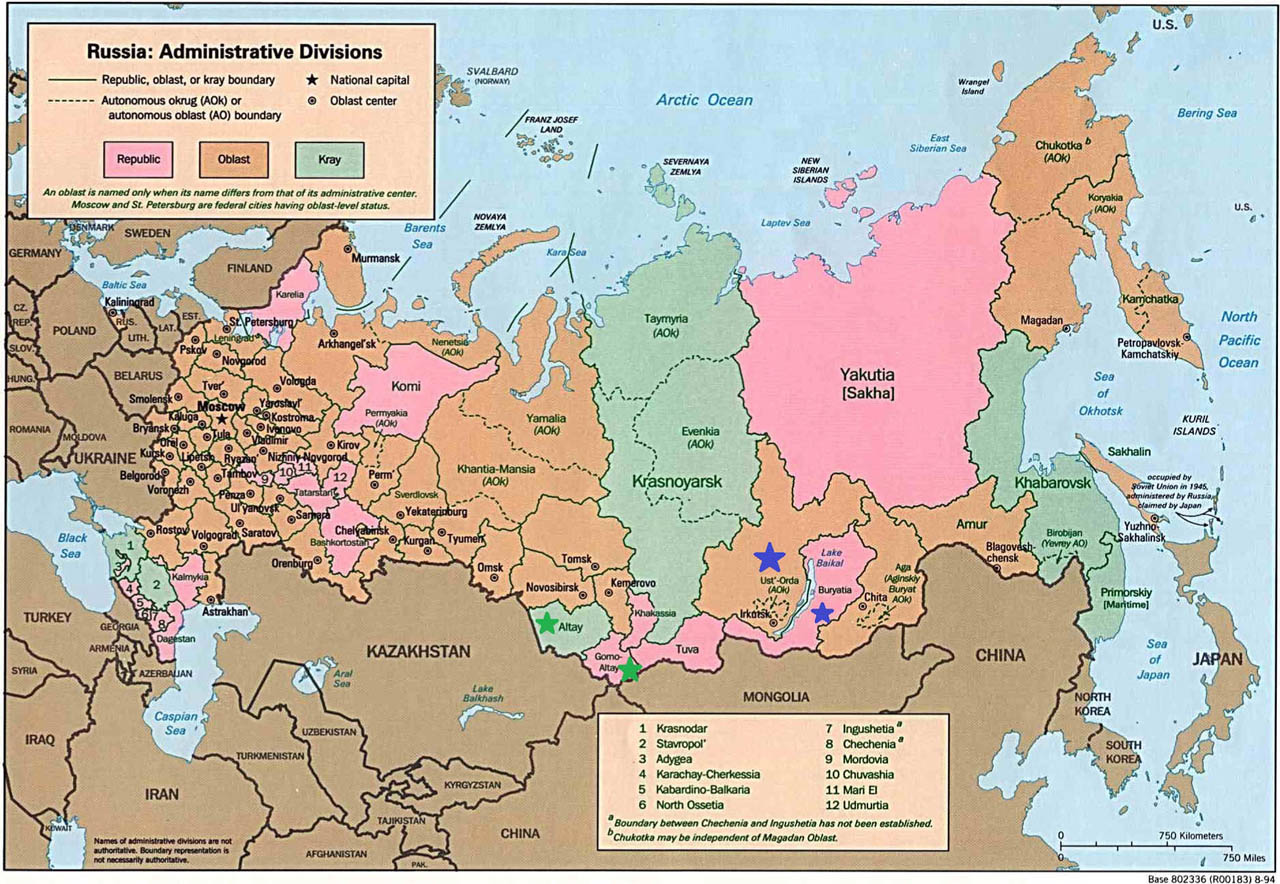
Fig. 1
Remote regions of Russia containing the Altai Mountains and Lake Baikal.
Source: http://www.maps-of-europe.net/maps/maps-of-russia/administrative-map-of-russia.jpg.
Table 1
Total area and the selected population indicators in the Altai Mountains.
| Total area in km2 | Population estimate at end of 2019; in thousands | Density of population | Urban population | Rural population | |
|---|---|---|---|---|---|
| Altai Krai | 169,100 | 2,317 | 13.7/km2 | 56.9% | 43.1% |
| Republic of Altai | 92,600 | 220 | 2.4/km2 | 29.3% | 70.7% |
[i] Source: Federal State Statistics Service. Regions of Russia. Socio-economic indicators, 2020. https://gks.ru/bgd/regl/b20_14p/Main.htm (accessed: 7 March 2021).
Table 2
The analysis of selected tourism indicators in the Altai Mountains.
| Indicators | 2012 | 2013 | 2014 | 2015 | 2016 |
|---|---|---|---|---|---|
| No. of hotels in Altai Krai | 116 | 112 | 111 | 114 | 158 |
| Hotel expenditures in Altai Krai (in roubles) | 647,001.9 | 692,124.8 | 657,055 | 656,999 | 805,592.8 |
| Share of hotel expenditures in Altai Krai in overall hotel expenditures in Russia | 0.52% | 0.51% | 0.39% | 0.38% | 0.40% |
| Hotel revenues Altai Krai | 797,659.3 | 818,728.8 | 830,791.6 | 773,316.6 | 892,461.1 |
| Share of hotel revenues in Altai Krai in overall hotel revenues in Russia | 0.59% | 0.52% | 0.52% | 0.45% | 0.39% |
| No. of bed places in hotels in Altai Krai | 4,409 | 4,769 | 4,729 | 4,727 | 5,807 |
| No. of guests in hotels in Altai Krai | 258,703 | 283,243 | 250,717 | 245,125 | 256,160 |
| No. of travel agencies in Altai Krai | 144 | 147 | 161 | 167 | 133 |
| Share of bed places in hotels in Altai Krai in overall number of bed places in Russia | 1.00% | 0.87% | 0.87% | 0.62% | 0.71% |
| No. of hotels in Republic of Altai | 49 | 49 | 48 | 48 | 54 |
| Hotel expenditures in Republic of Altai (in roubles) | 113,545.6 | 113,545.6 | 338,257 | 489,229.3 | 815,300.7 |
| Share of hotel expenditures in Republic of Altai in overall hotel expenditures in Russia | 0.09% | 0.08% | 0.20% | 0.28% | 0.41% |
| Hotel revenues in Republic of Altai (in roubles) | 168,745.6 | 168,745.6 | 284,314.4 | 528,466 | 970,089 |
| Share of hotel revenues in Republic of Altai in overall hotel revenues in Russia | 0.0012 | 0.0011 | 0.0018 | 0.0031 | 0.0043 |
| No. of bed places in hotels in Republic of Altai | 1,462 | 1,462 | 1,353 | 1,829 | 2,286 |
[i] Source: own processing by using data from https://www.ceicdata.com/en/country/russia (accessed: 1 June 2019).
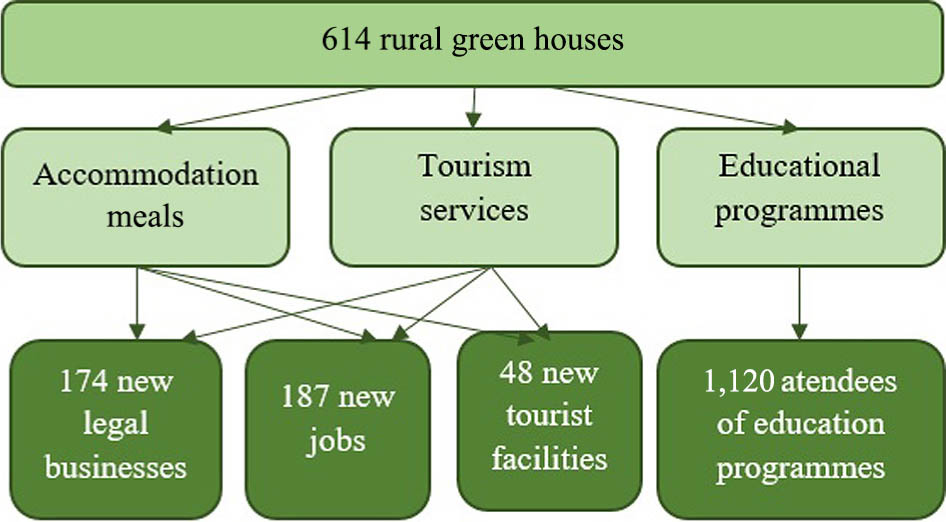
Fig. 2
Structure of activities in rural tourism in the Altai Mountains.
Source: authors.
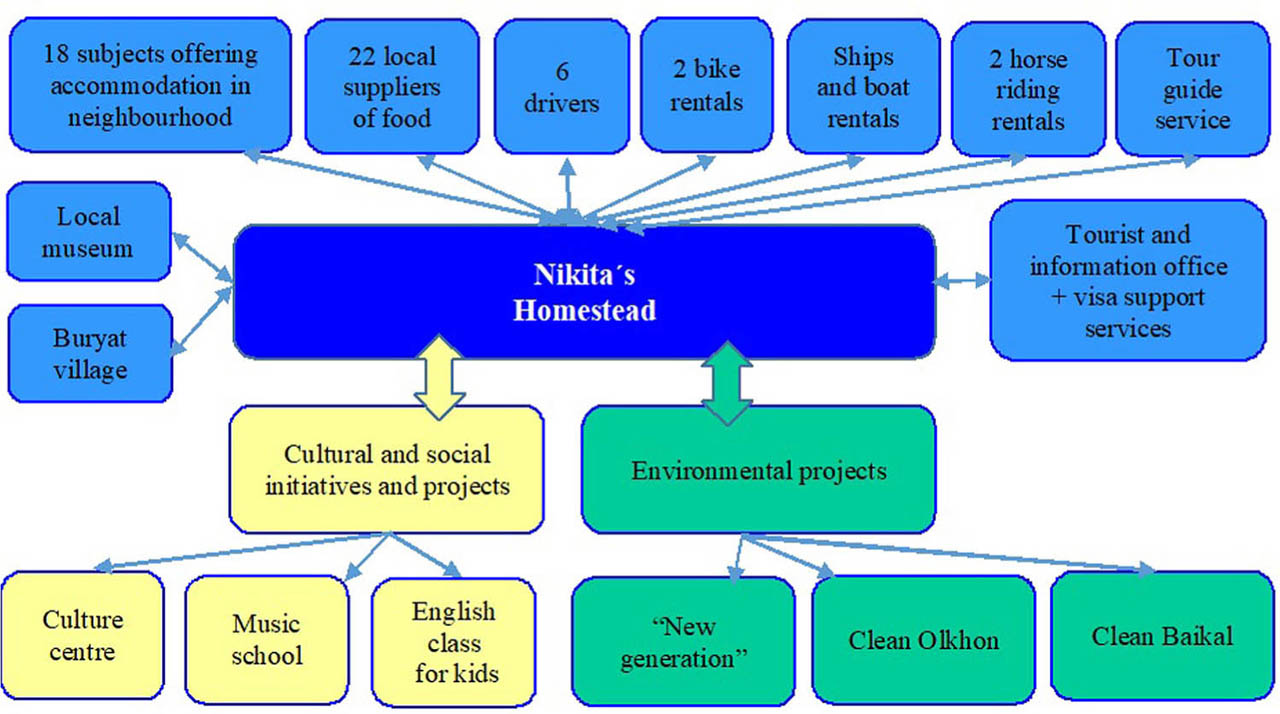
Fig. 3
Community-based tourism development on Olkhon Island in Lake Baikal.
Source: Borseková et al. 2018: 187.
Table 3
Total area and selected population indicators in the Baikal region.
| Total area in km2 | Population estimate at end of 2019; in thousands | Density of population | Urban population | Rural population | |
|---|---|---|---|---|---|
| Irkutsk region | 767,900 | 2,391 | 3.1/km2 | 78.1 % | 21.9 % |
| Republic of Buryatia | 351,300 | 986 | 2.8/km2 | 59.2 % | 40.8 % |
[i] Source: Federal State Statistics Service. Regions of Russia. Socio-economic indicators, 2020. https://gks.ru/bgd/regl/b20_14p/Main.htm (accessed: 7 March 2021).
Table 4
Analysis of selected tourism indicators in Lake Baikal.
| Indicators | 2012 | 2013 | 2014 | 2015 | 2016 |
|---|---|---|---|---|---|
| No. of hotels in Irkutsk region | 90 | 91 | 90 | 84 | 114 |
| Hotel expenditures in Irkutsk region (in roubles) | 1,129,771 | 1,320,342.1 | 1,429,268.9 | 1,424,787.4 | 1,658,996.3 |
| Share of hotel expenditures in Irkutsk region in overall hotel expenditures in Russia | 0.91% | 0.98% | 0.85% | 0.82% | 0.83% |
| Hotel revenues Irkutsk (in roubles) | 1,433,166.4 | 1,585,494.3 | 1,463,655.2 | 1,674,270.4 | 2,105,162 |
| Share of hotel revenues in Irkutsk region in overall hotel revenues in Russia | 1.06% | 1.00% | 0.91% | 0.98% | 0.93% |
| No. of guests in hotels in Irkutsk region | 357,580 | 364,981 | 331,475 | 344,367 | 461,106 |
| No. of travel agencies in Irkutsk region | 158 | 202 | 182 | 135 | 197 |
| No. of bed places in hotels Irkutsk region | 5,460 | 5,488 | 5,868 | 5,959 | 7,464 |
| Share of bed places in hotels in Irkutsk region in overall number of bed places in Russia | 1.24% | 1.00% | 1.09% | 0.79% | 0.91% |
| No. of hotels in Republic of Buryatia | 93 | 108 | 102 | 104 | 143 |
| Hotel expenditures in Republic of Buryatia (in roubles) | 360,449.8 | 517,364.1 | 538,957 | 288,858.3 | 295,961.9 |
| Share of hotel expenditures in Republic of Buryatia in overall hotel expenditures in Russia | 0.29% | 0.38% | 0.32% | 0.17% | 0.15% |
| Hotel revenues in Republic of Buryatia (in roubles) | 539,895.9 | 553,811.8 | 485,435.6 | 467,839.9 | 665,641.6 |
| Share of hotel revenues in Republic of Buryatia in overall hotel revenues in Russia | 0.40% | 0.35% | 0.30% | 0.27% | 0.29% |
| No. of bed places in hotels in Republic of Buryatia | 2,746 | 2,683 | 5,151 | 3,044 | 4,272 |
| Share of bed places in hotels in Republic of Buryatia in overall number of bed places in Russia | 0.63% | 0.49% | 0.95% | 0.40% | 0.52% |
| No. of guests in hotels in Republic of Buryatia | 208,4700 | 208,462 | 173,956 | 166,510 | 200,877 |
| No. of travel agencies in Republic of Buryatia | 57 | 42 | 42 | 51 | 54 |
[i] Source: own processing by using data from https://www.ceicdata.com/en/country/russia (accessed: 1 June 2019).
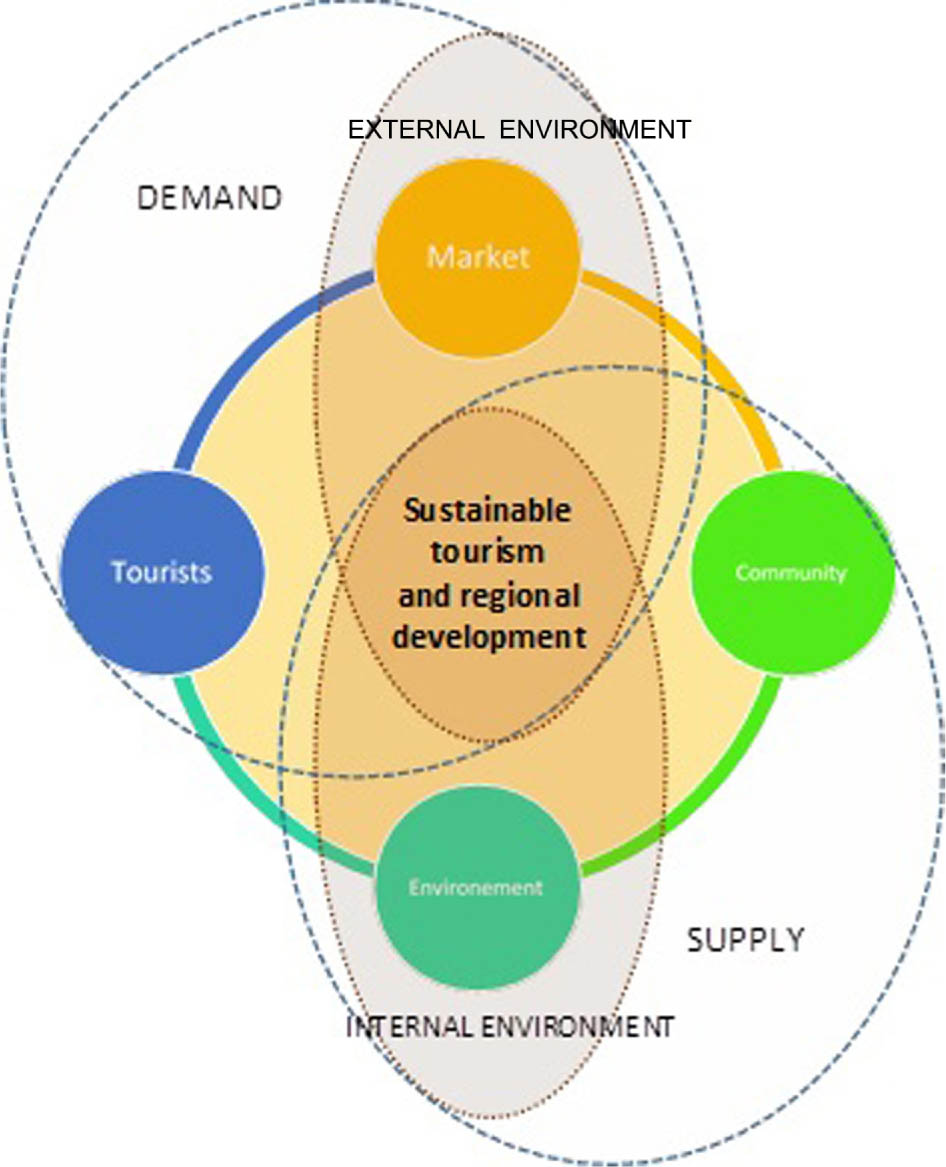
Fig. 4
Participatory operational framework for sustainable tourism and regional development.
Source: authors.