
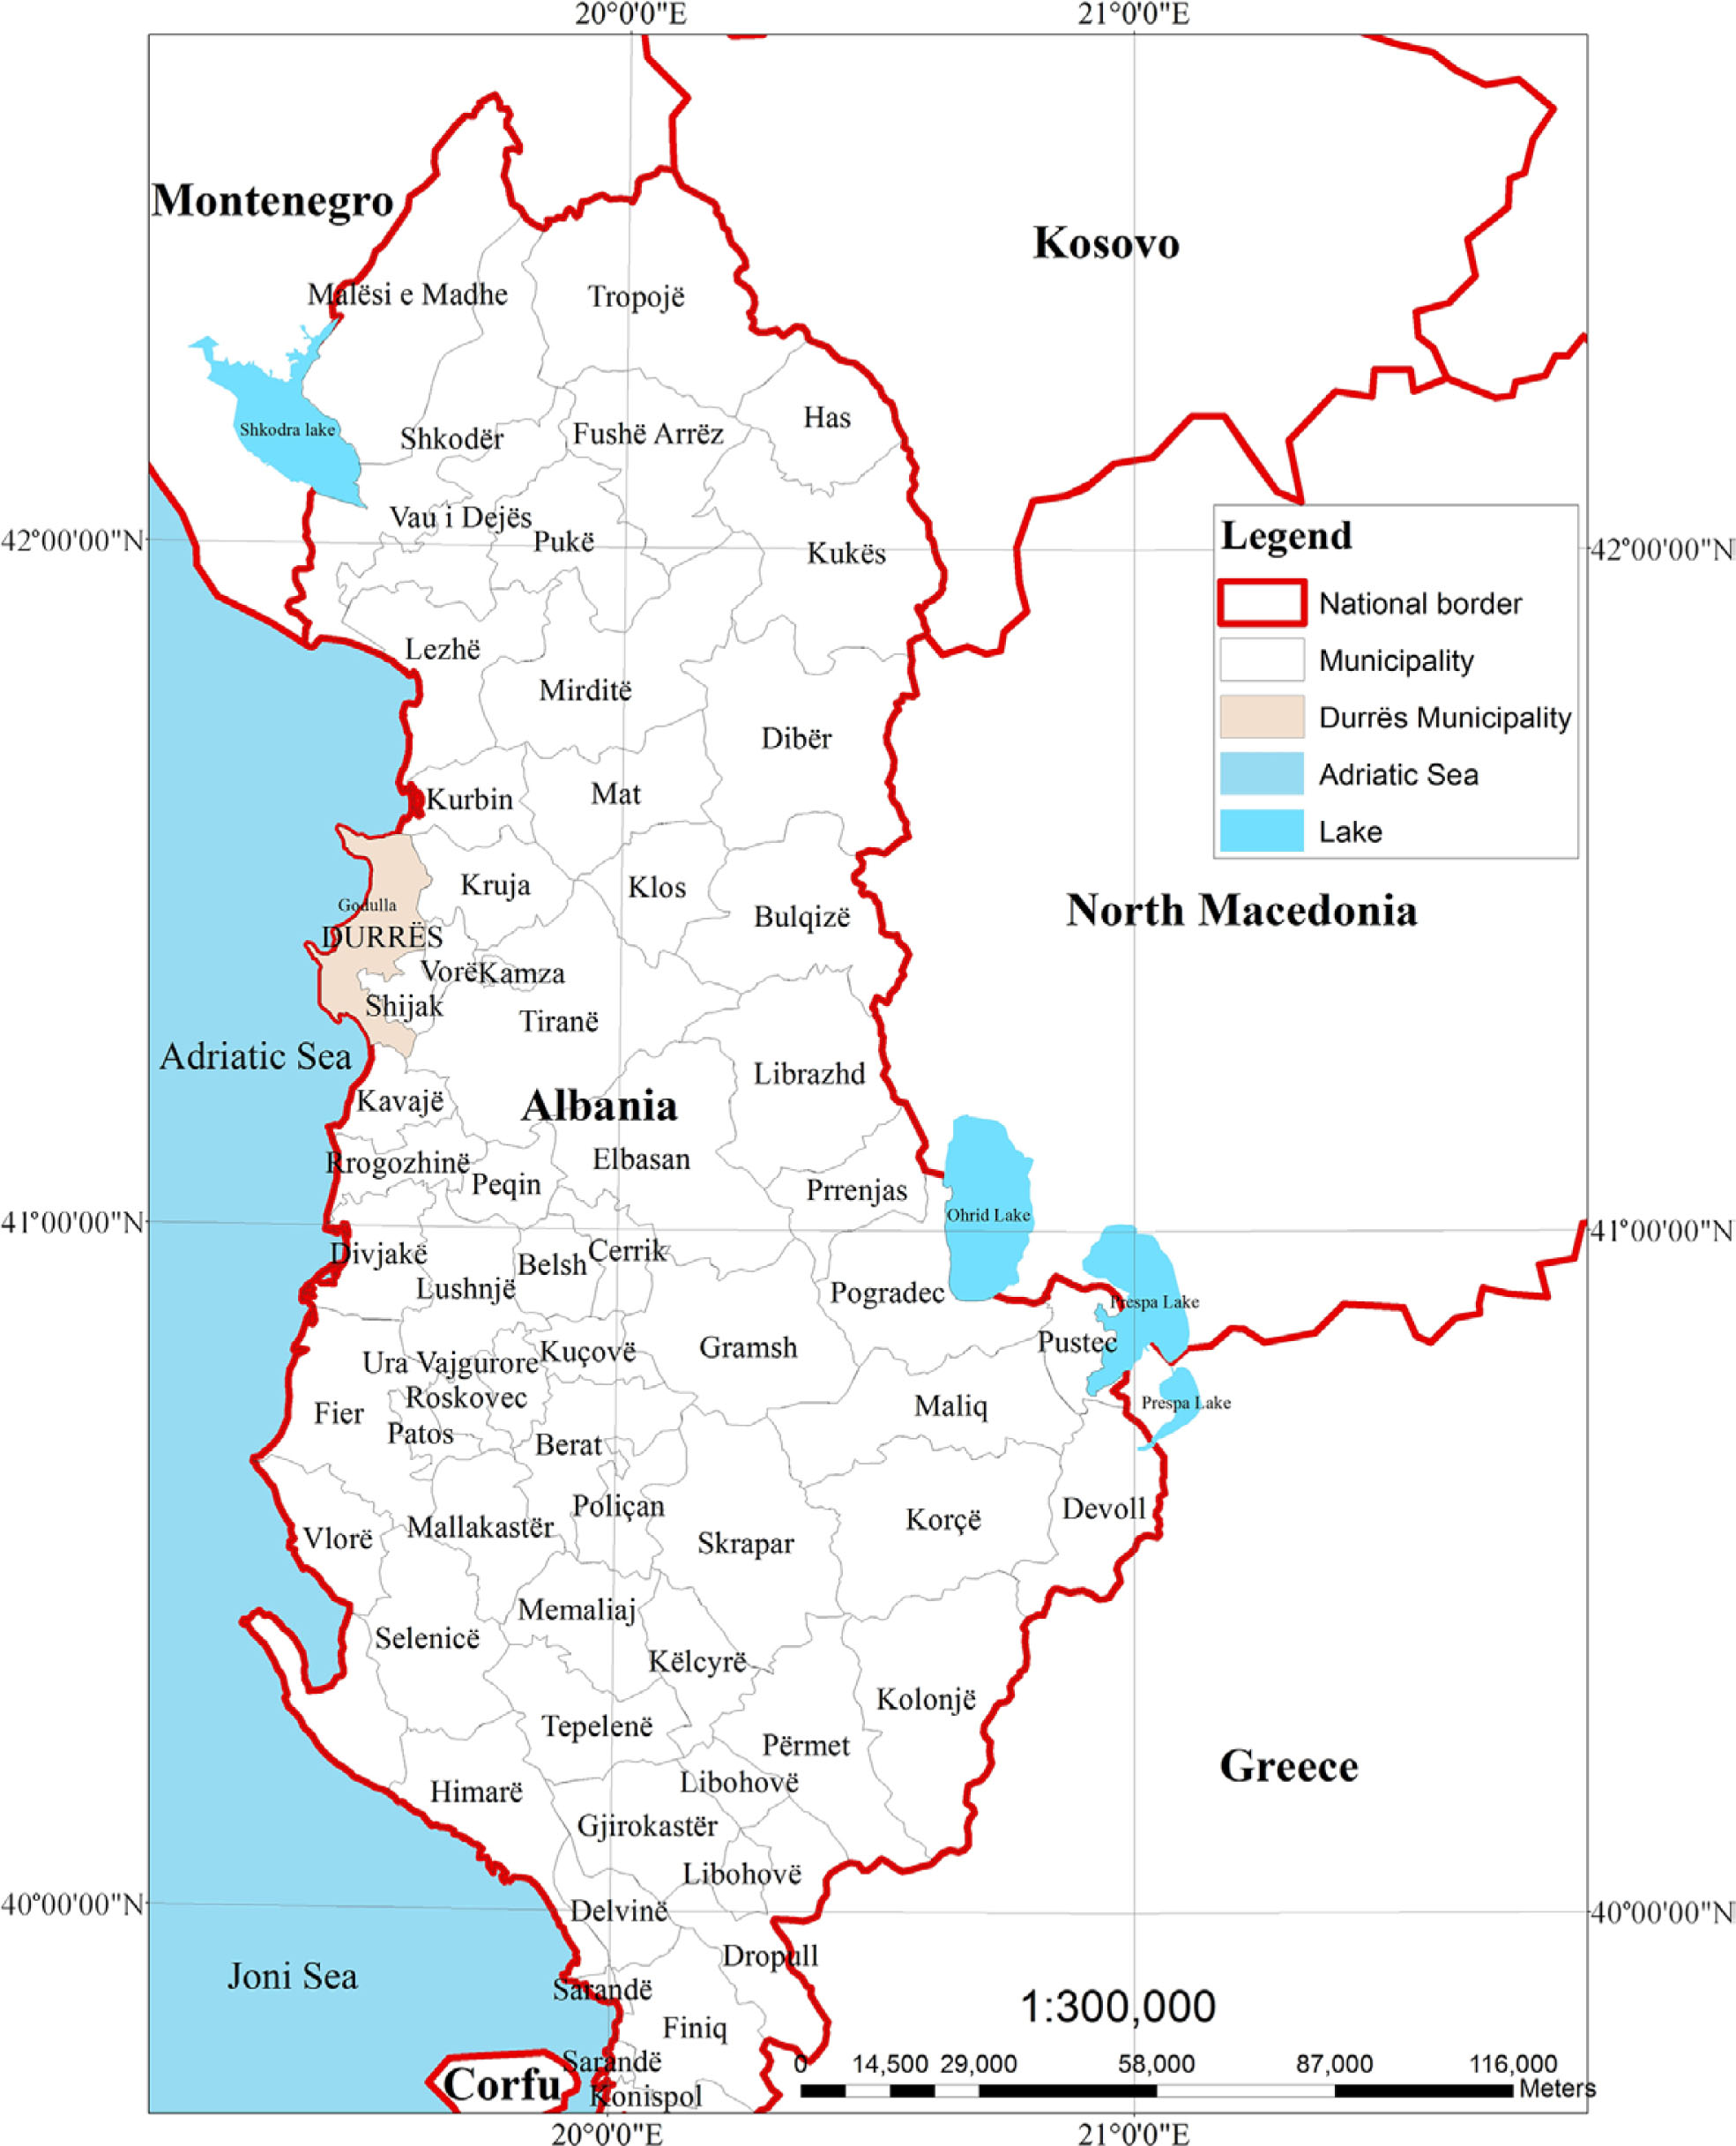
Fig. 1
The location of Durrës Municipality in Albania country.
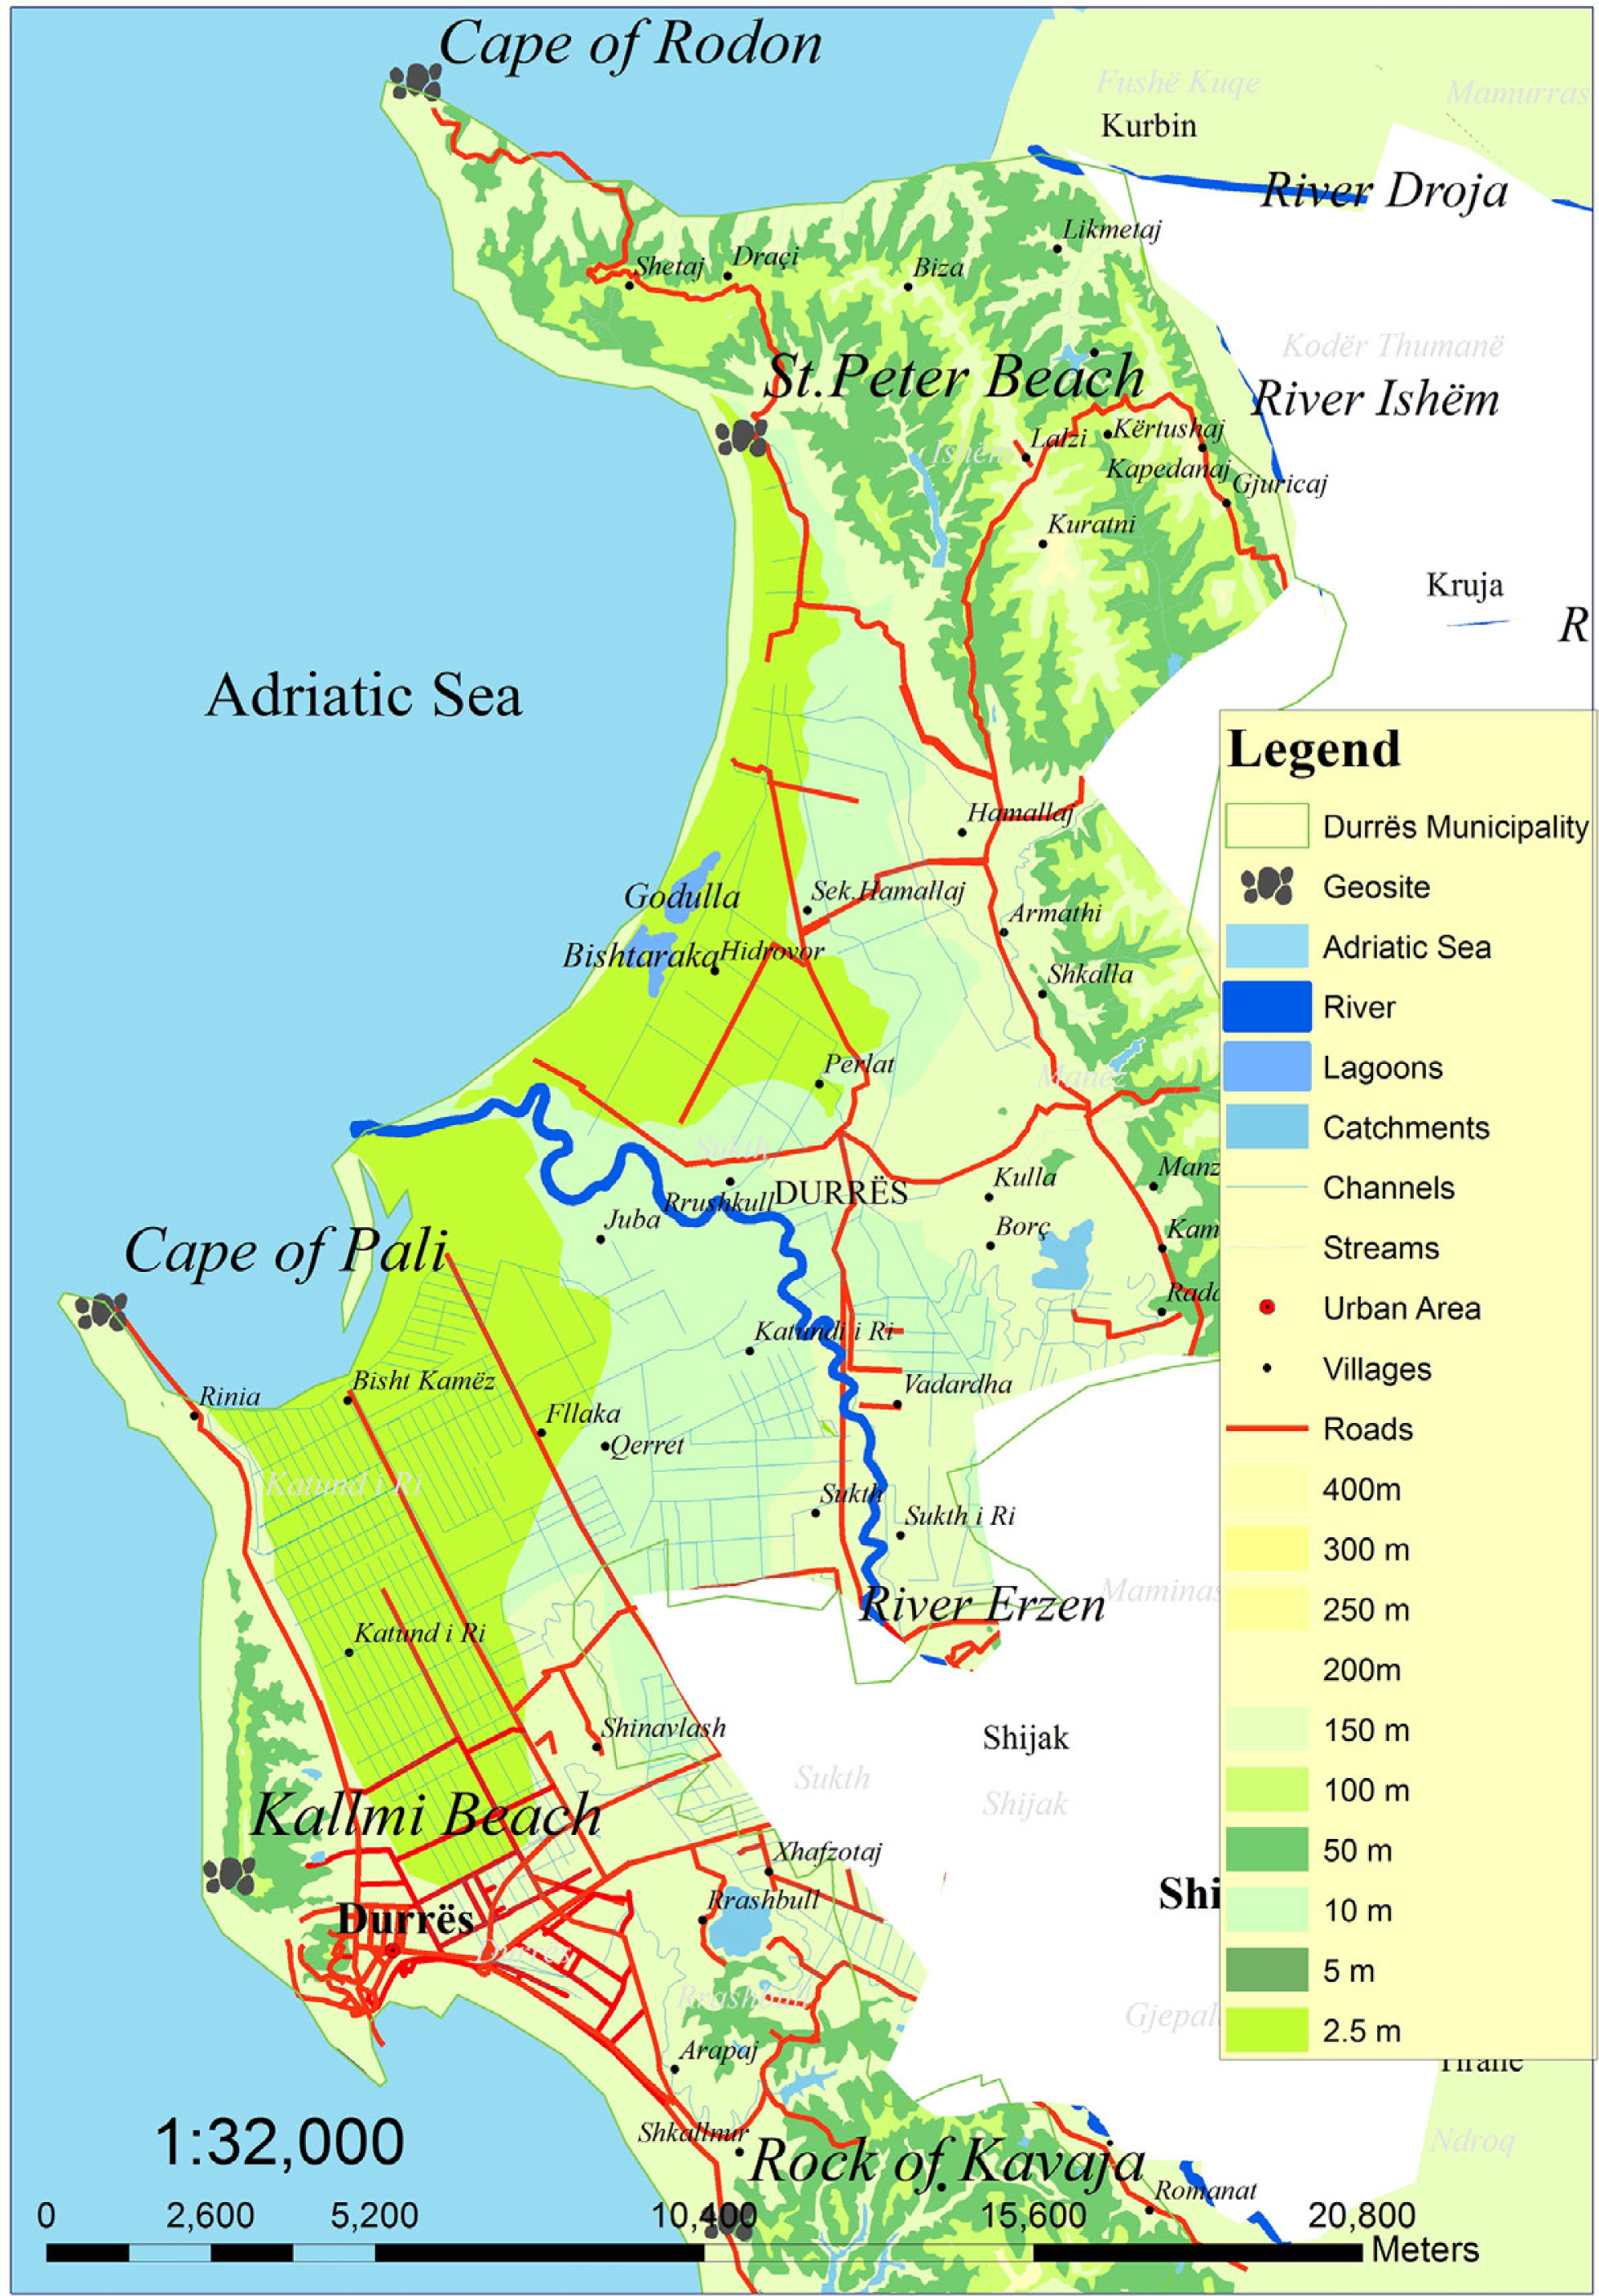
Fig. 2
The position of geosites in Durrës Municipality.
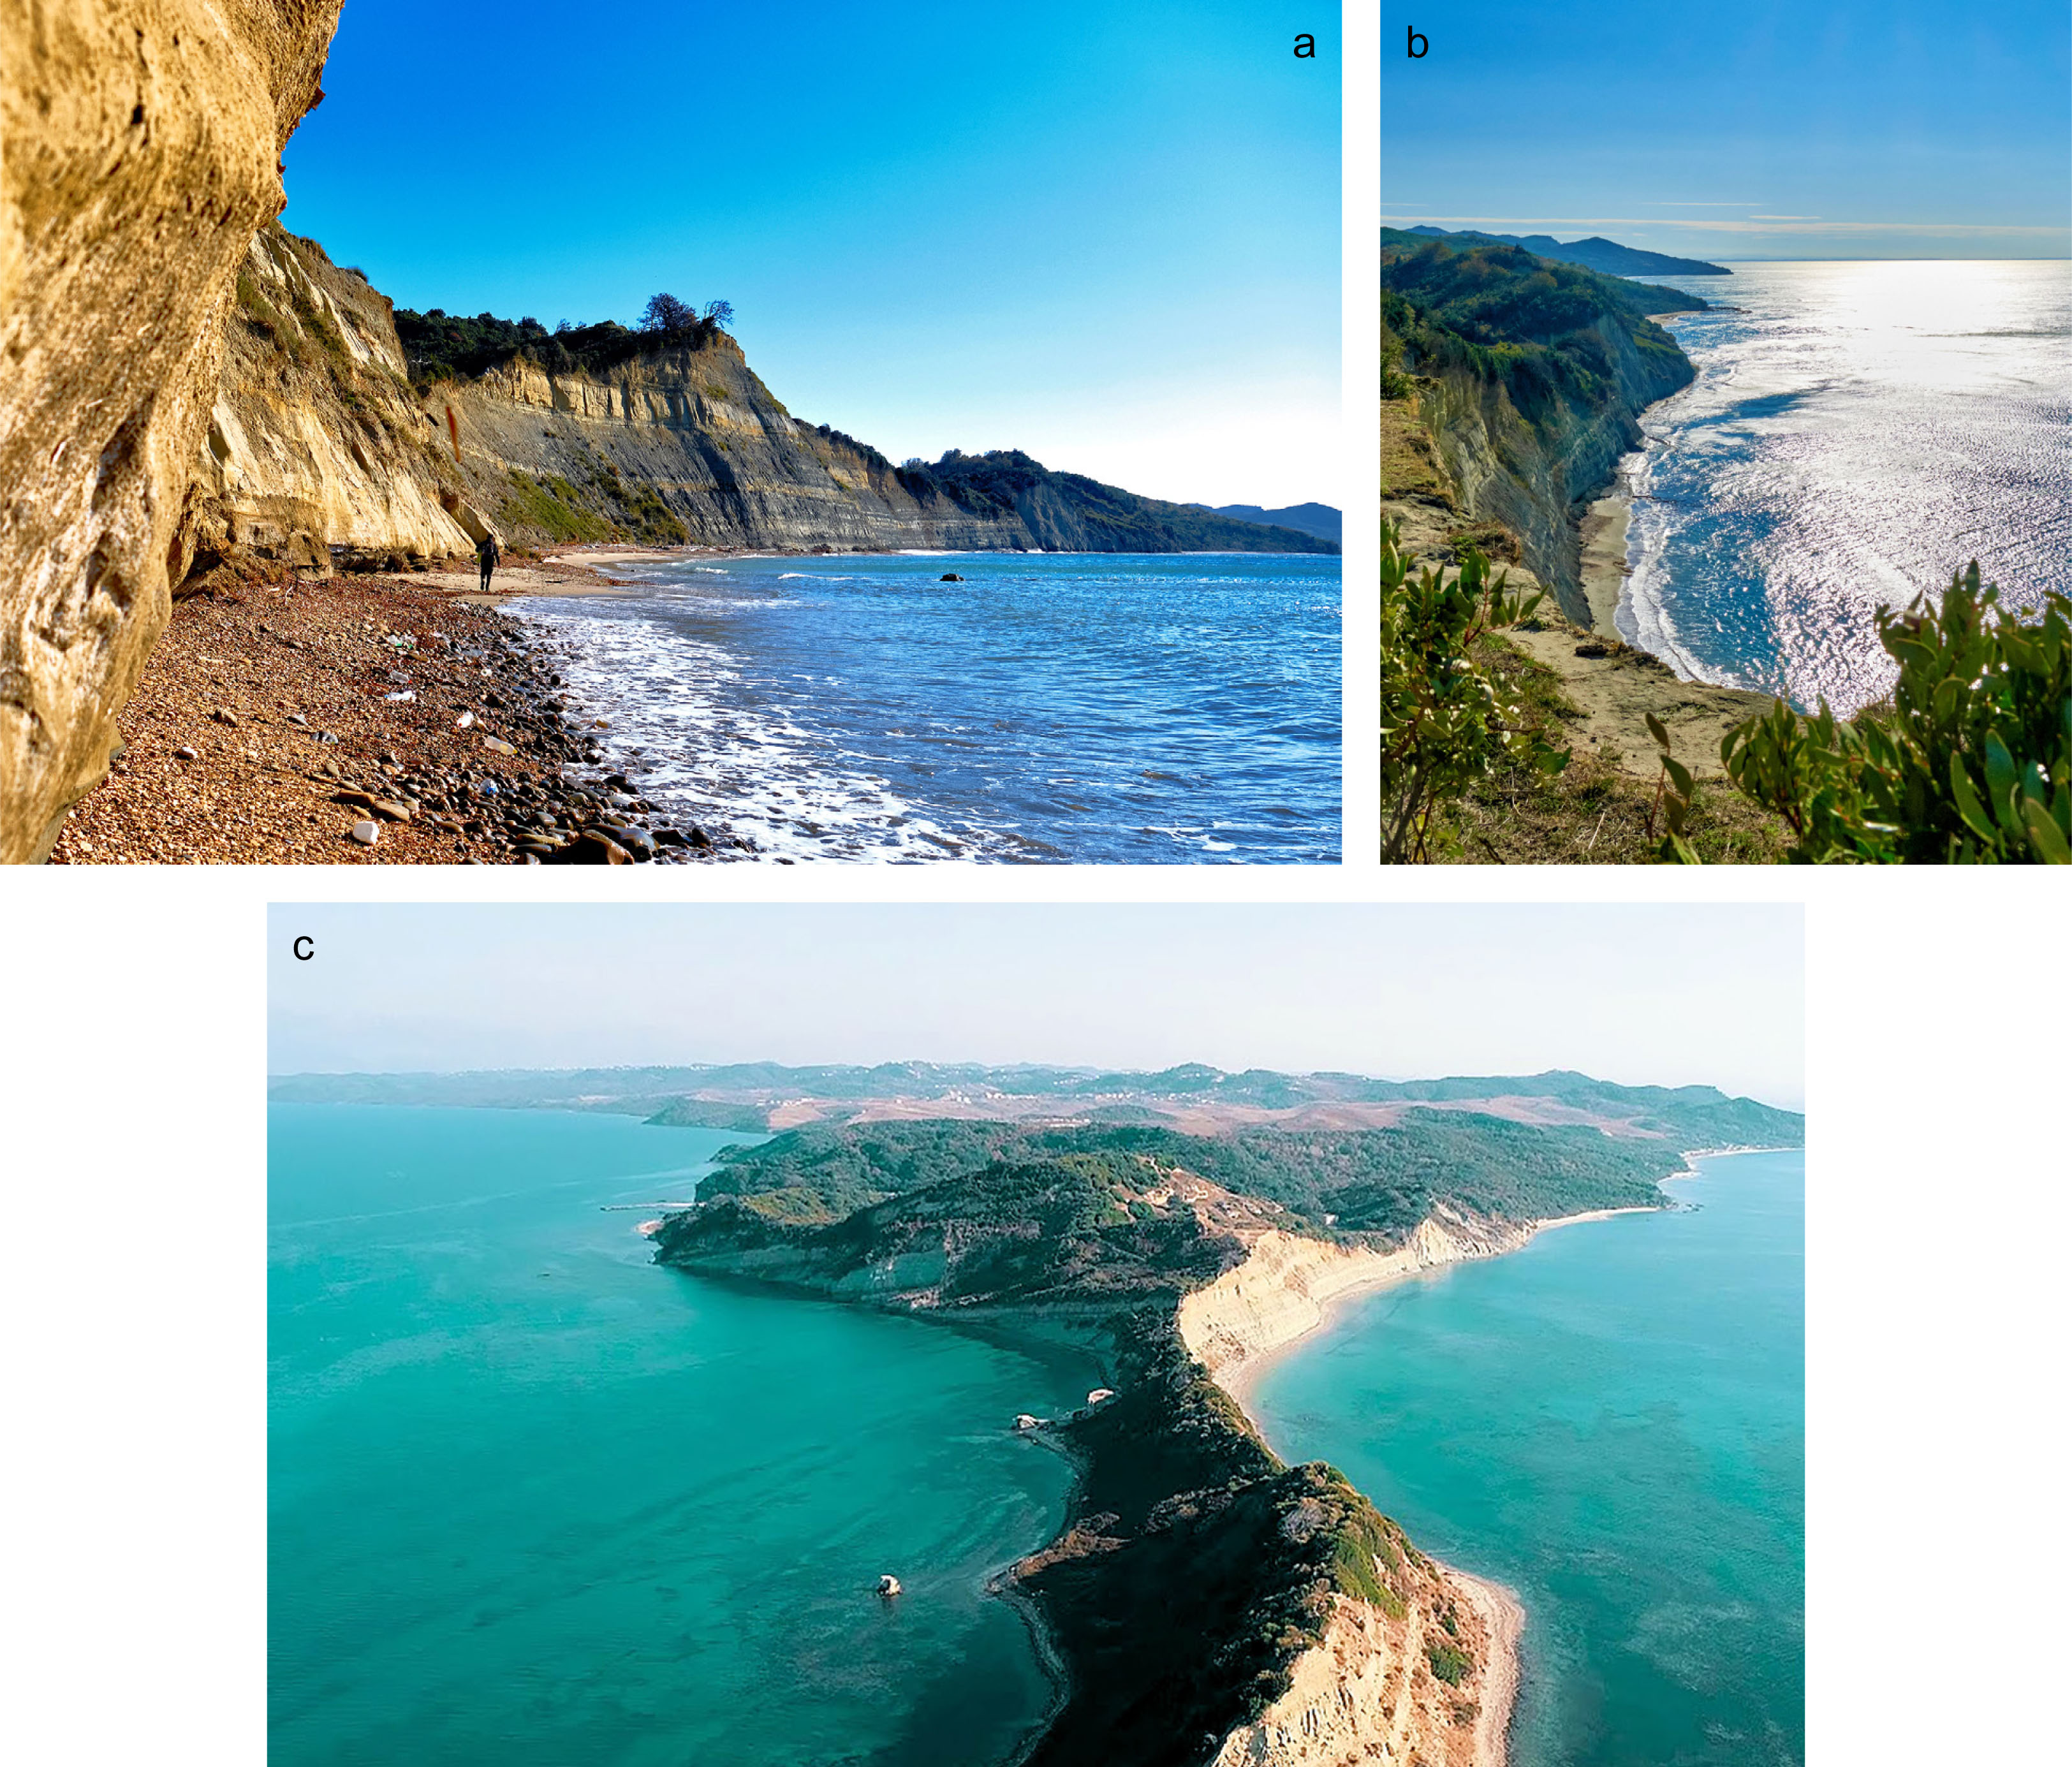
Fig. 3
The cape of Rodon (photo by V. Zhara, 2020).
a) the southwest cliff in Cape of Rodon, where the erosion is active, b) the cliff seen from above the peninsula, c) the cape of Rodon from the air, northwest part.
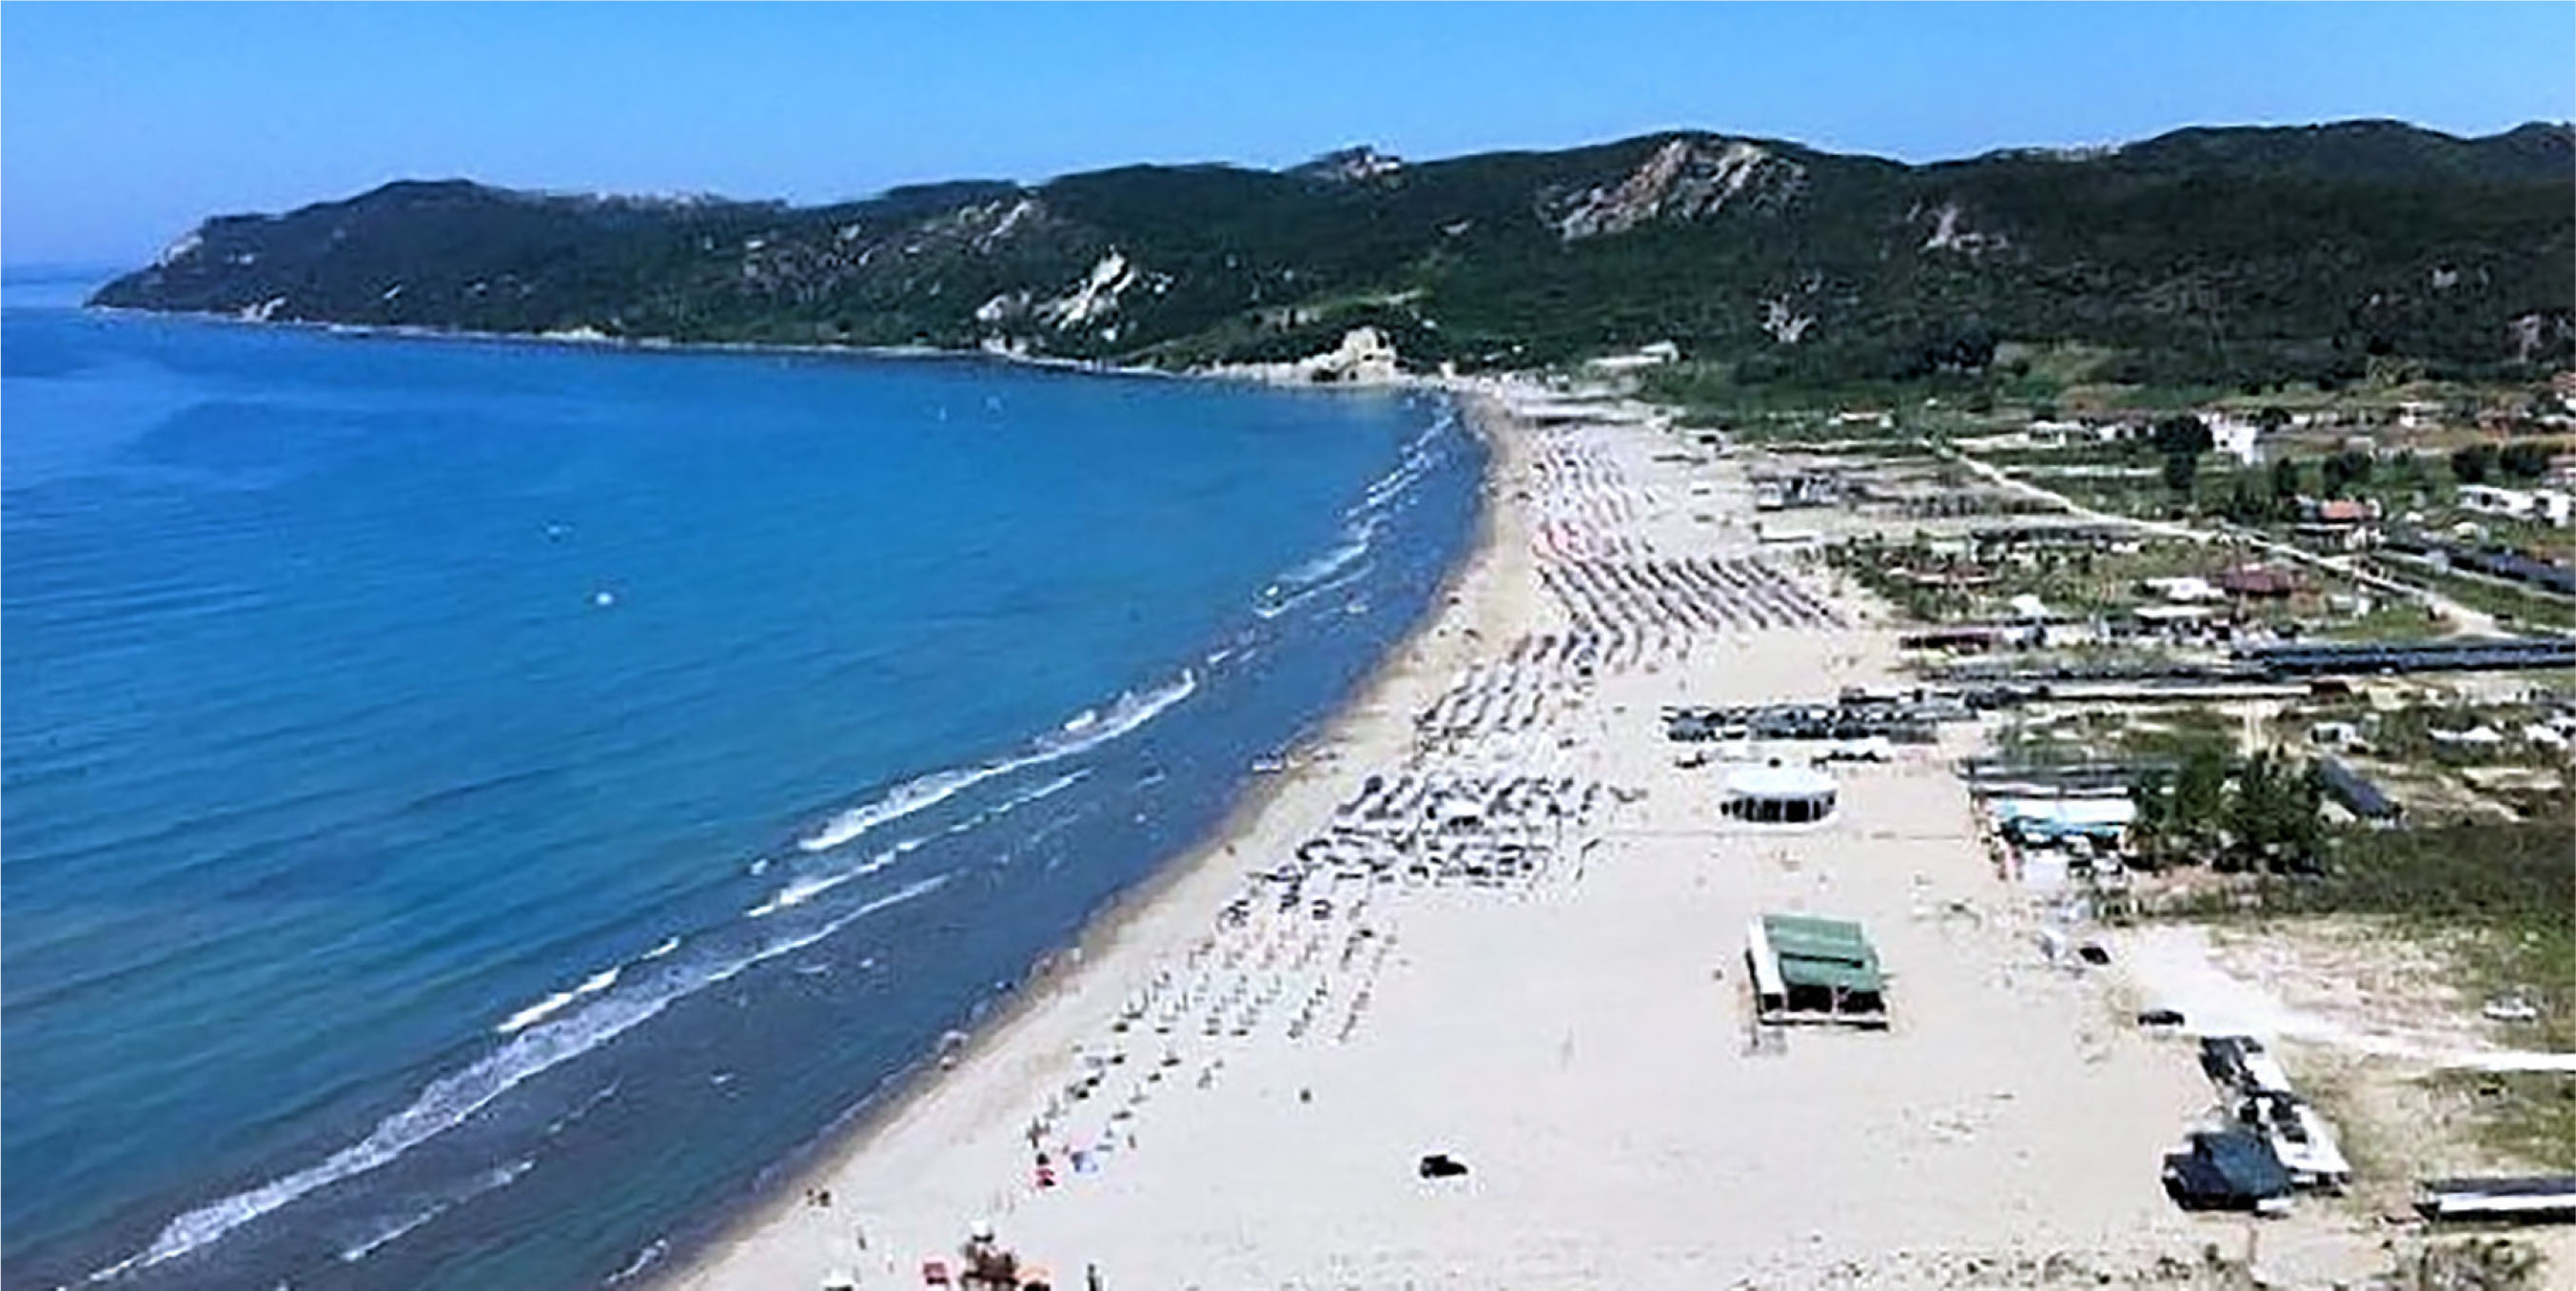
Fig. 4
The view from St. Peter's Beach.
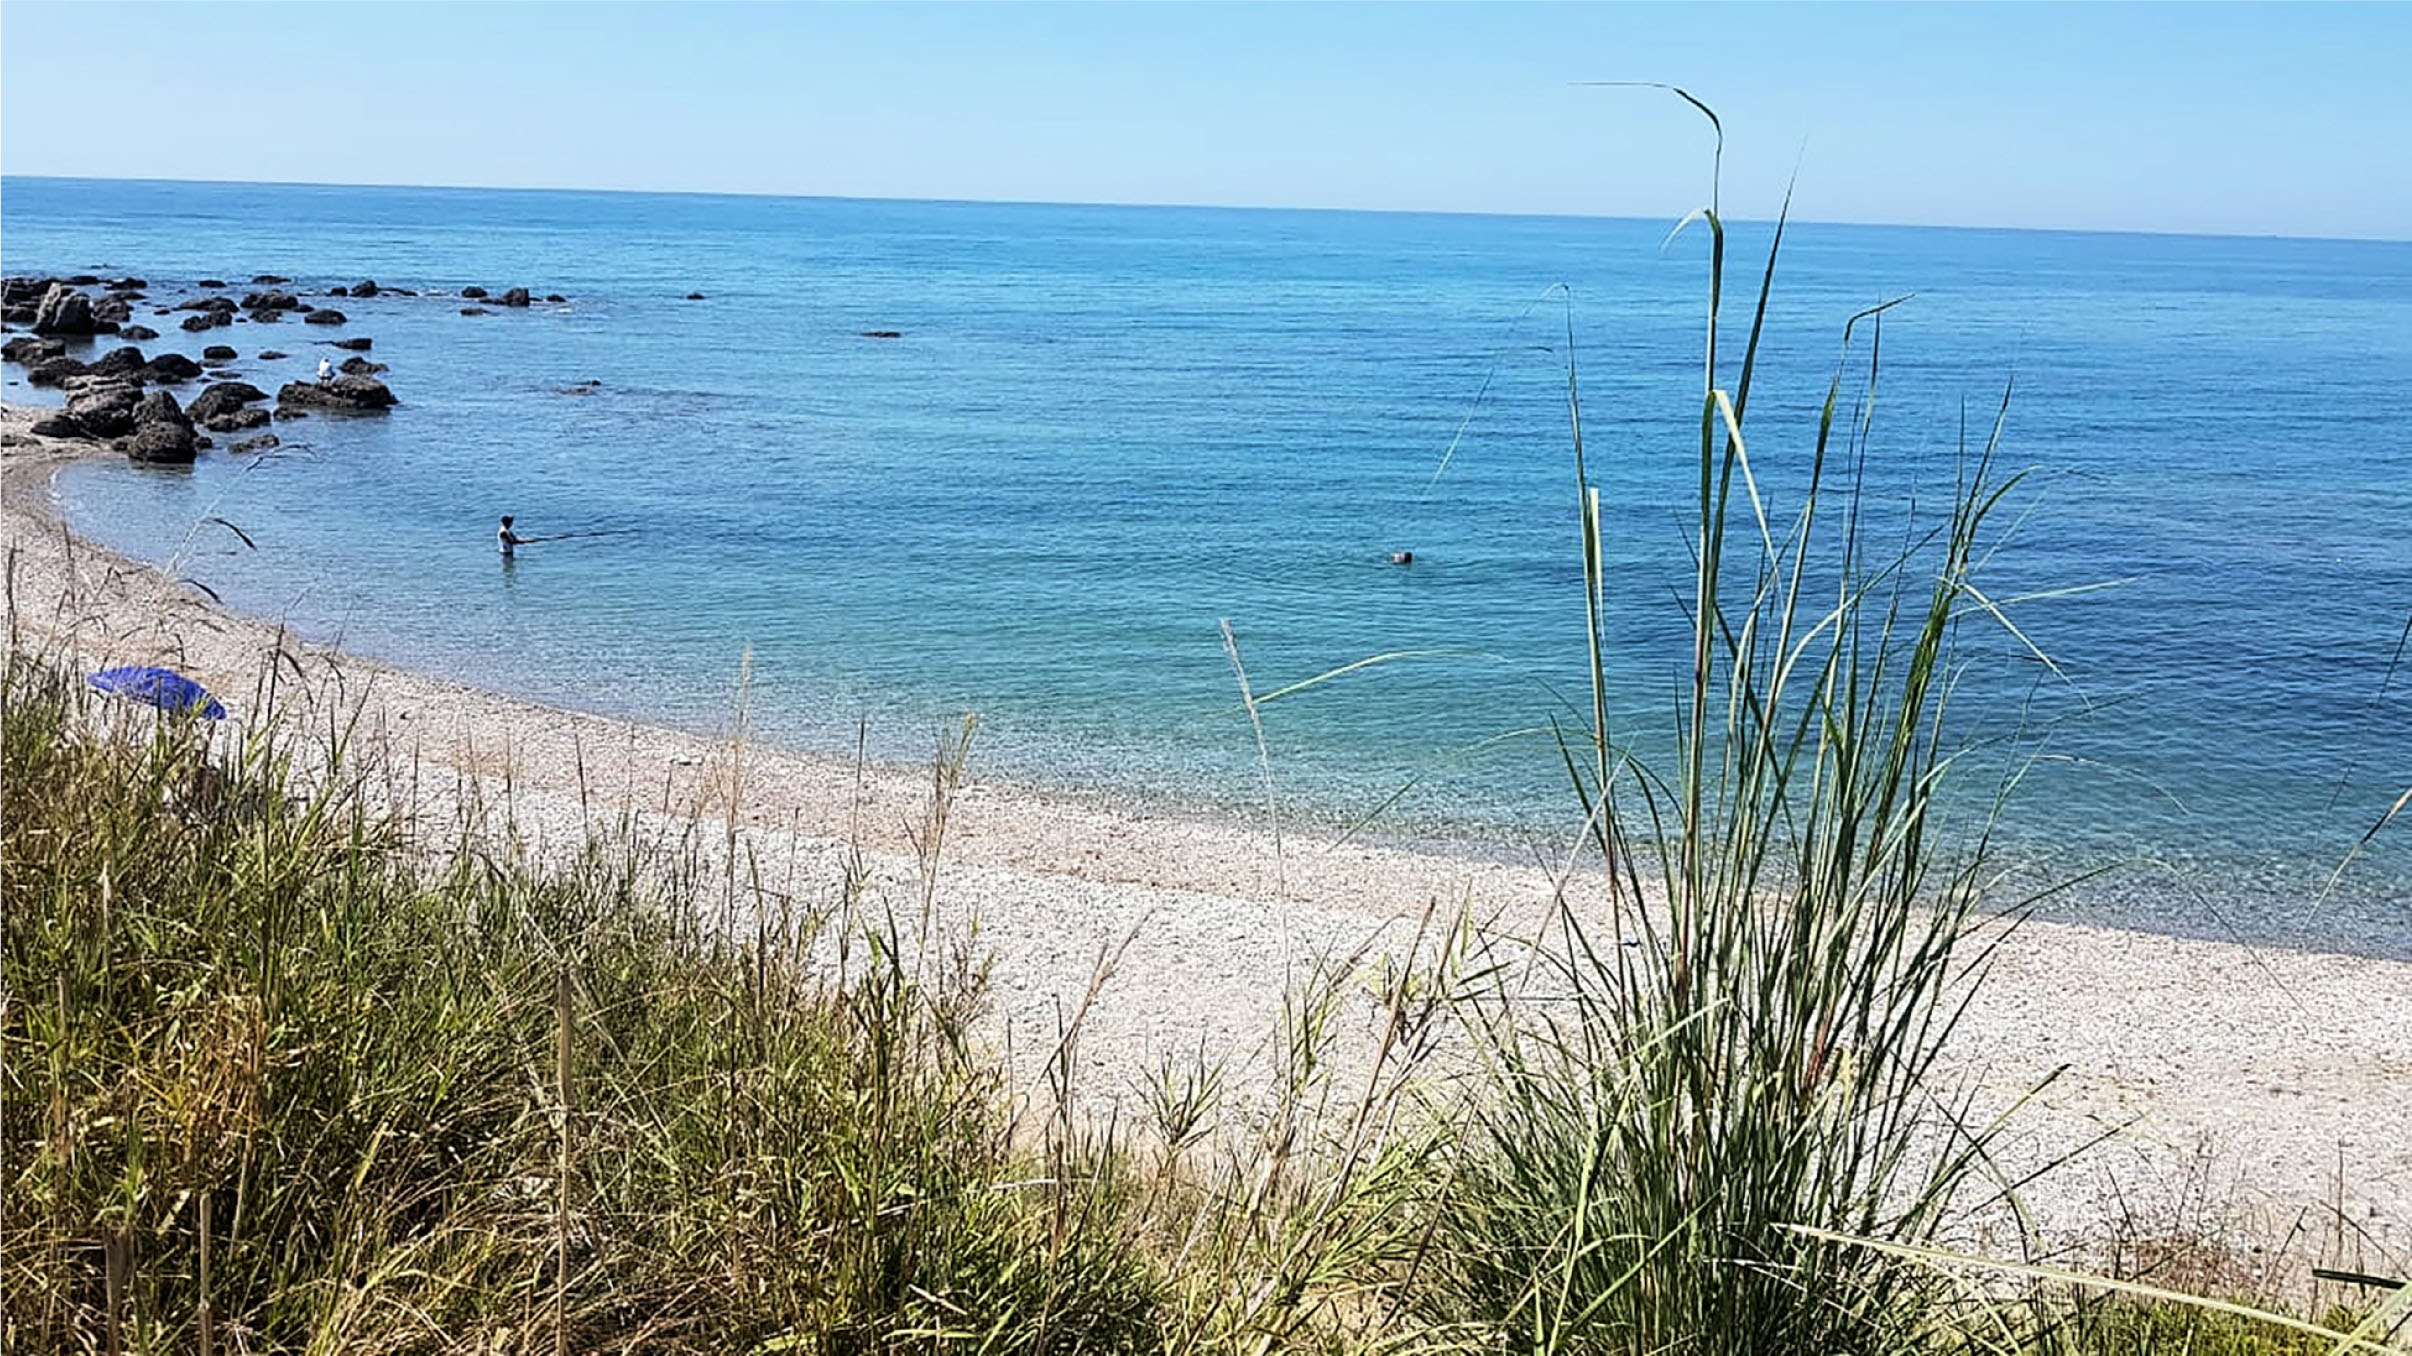
Fig. 5
The Kallmi beach.
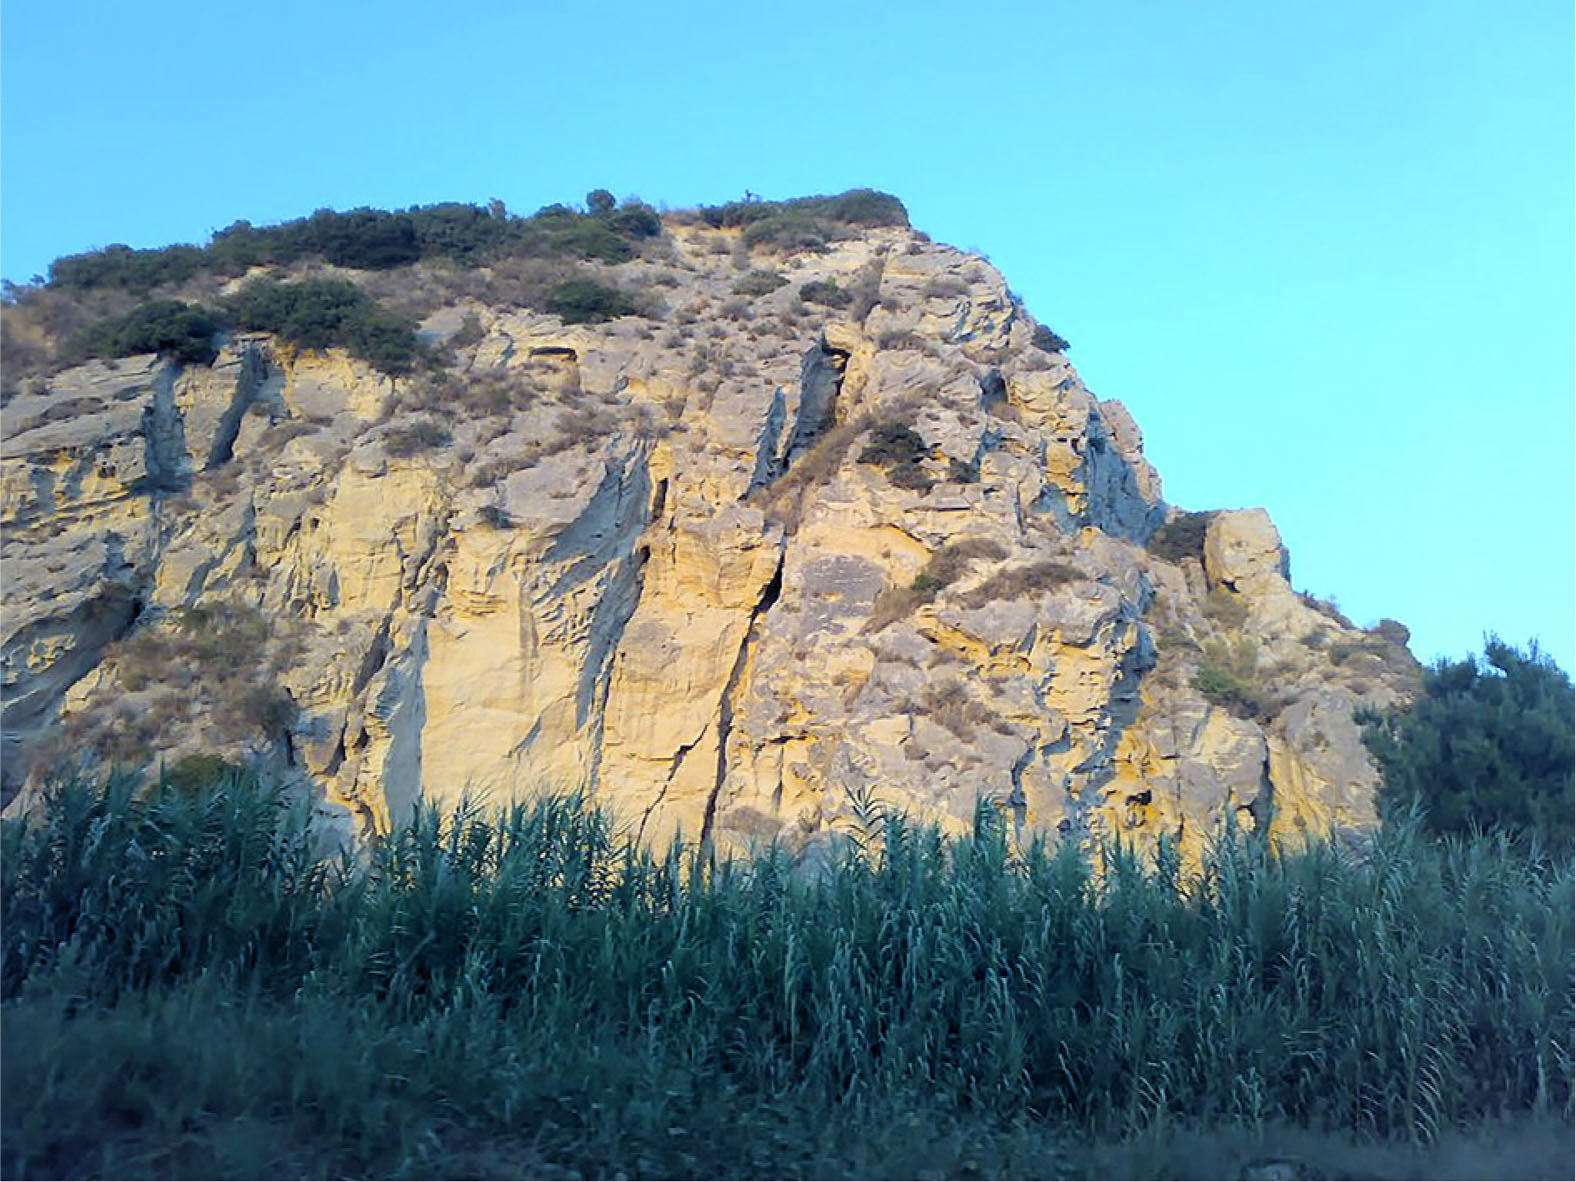
Fig. 6
The geographic position of Kavaja Rock.
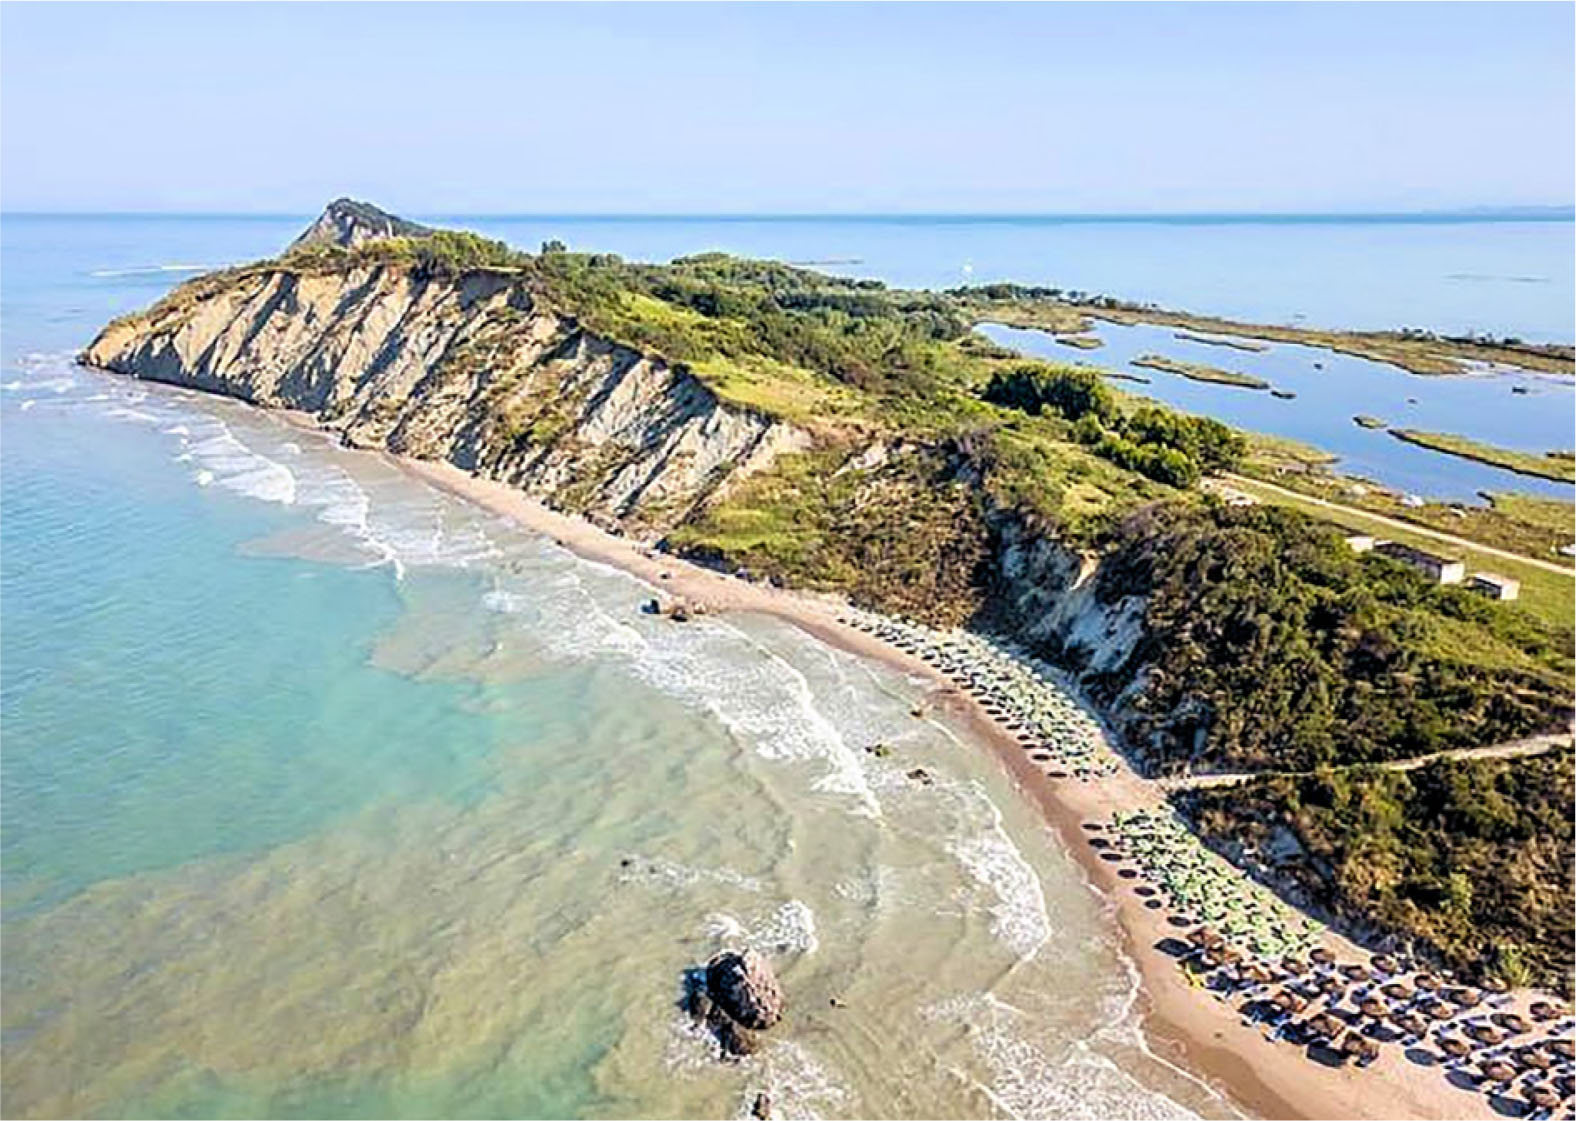
Fig. 7
The cape of Pal.
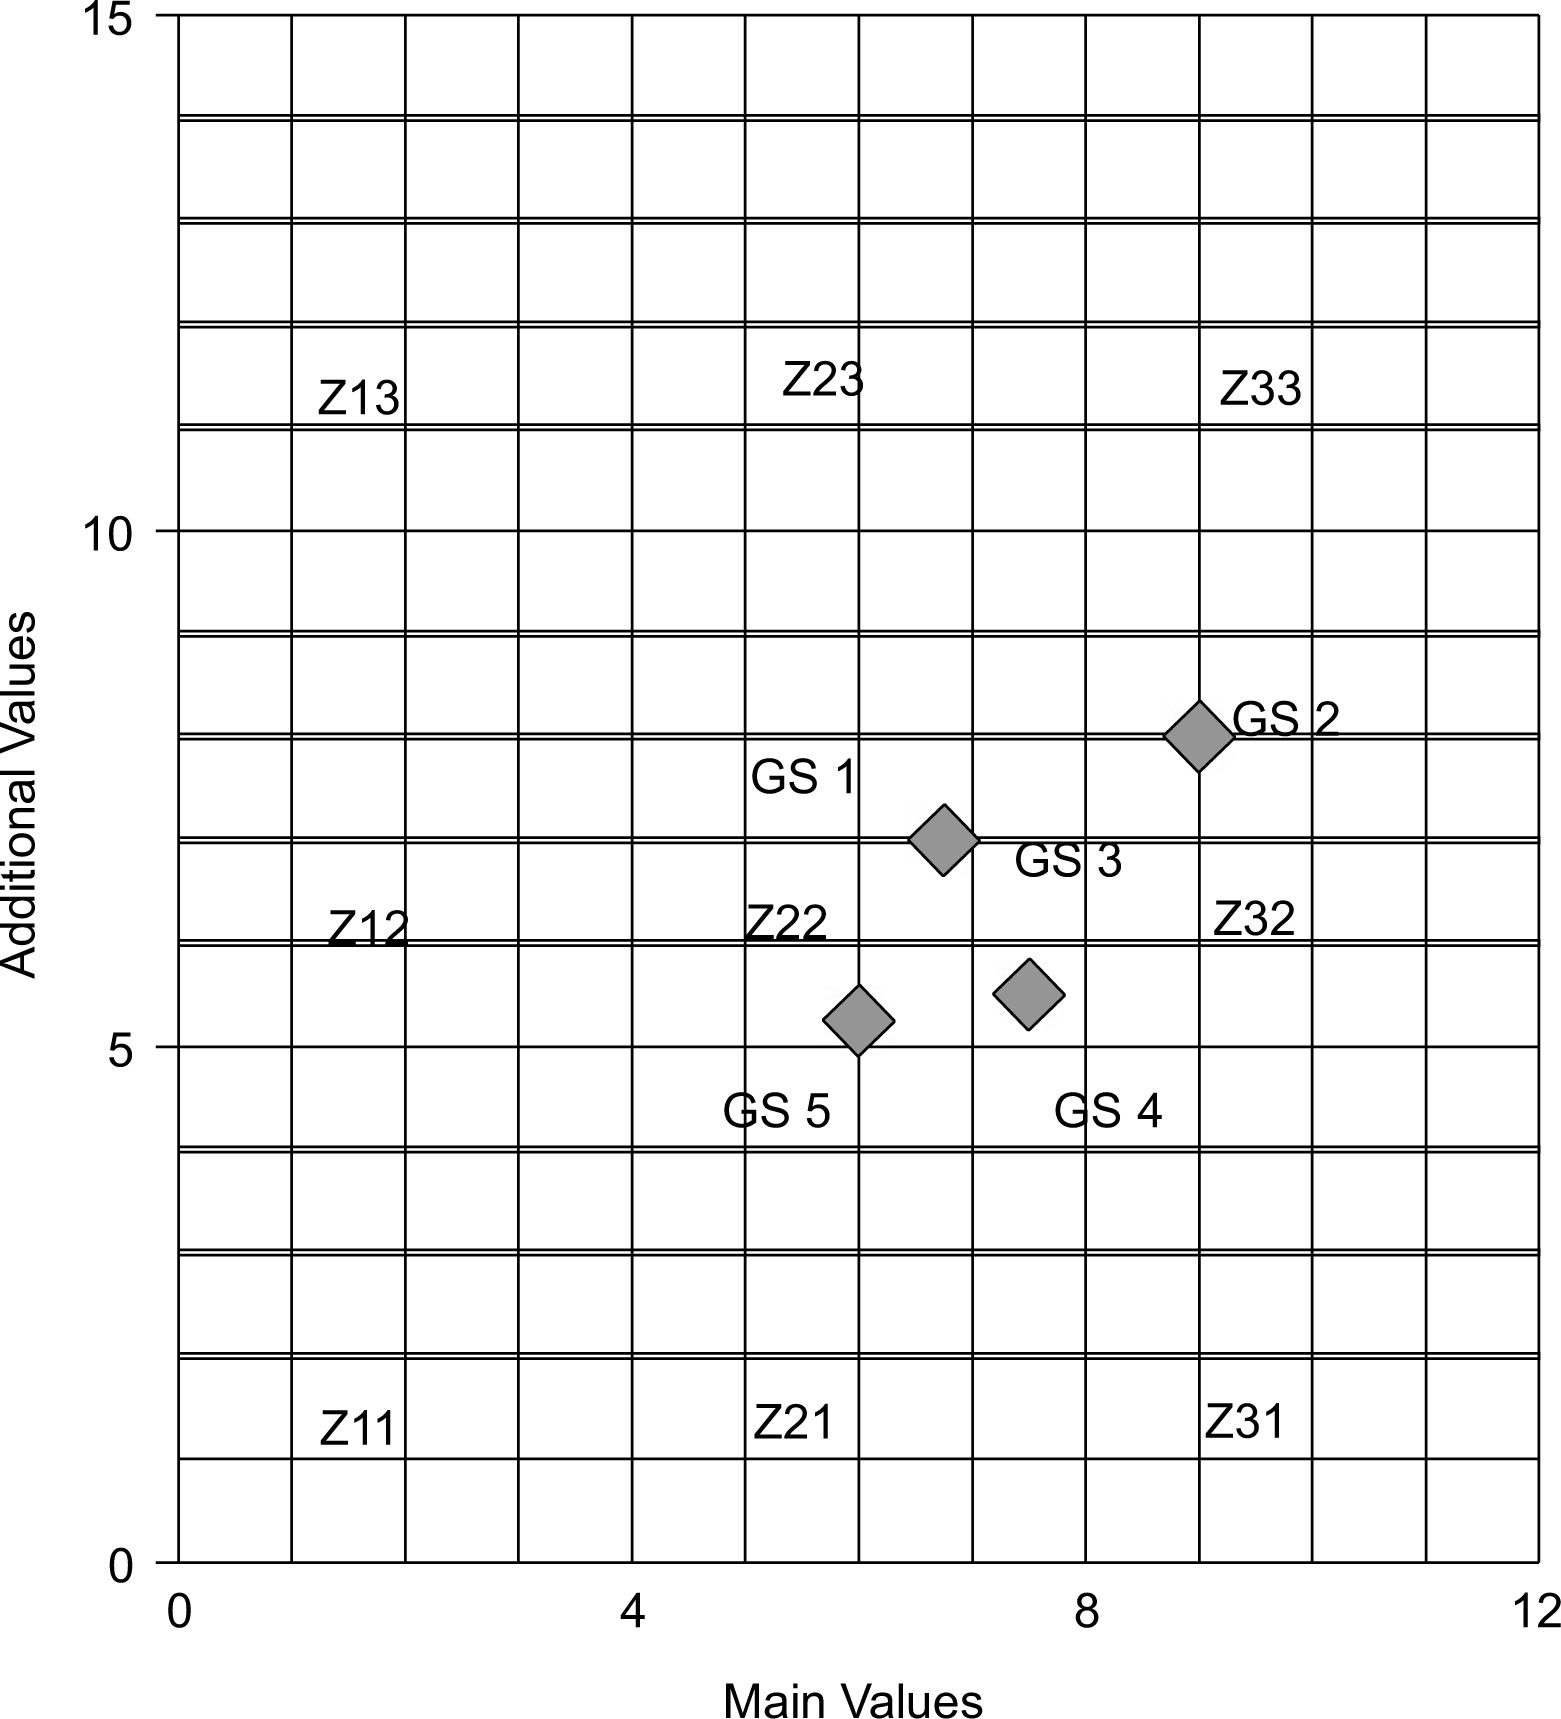
Fig. 8
Position of the assessed geosites in the GAM matrix.
GS 1 – Cape of Rodon, GS 2 – St. Pjeter Beach, GS 3 – Kallmi Beach, GS 4 – Rock of Kavaja, GS 5 – Cape of Pal.
Table 1
Geosite assessment of Durrës municipality, based on the GAM method of Vujicić et al. 2011.
| Indicator/Subindicator | Values given by expert (0.00–1.00) | ||||
|---|---|---|---|---|---|
| Cape of Rodon | St’ Peter beach | Kallmi beach | Rock of Kavaja | Cape of Pali | |
| GS 1 | GS 2 | GS 3 | GS 4 | GS 5 | |
| Main Values (MV) | |||||
| I. Scientific/Educational | |||||
| Values (VSE) | 0.50 | 0.75 | 0.50 | 0.50 | 0.25 |
| Rarity (SIMV1) | 0.75 | 0.75 | 0.50 | 0.50 | 0.50 |
| Representativeness (SIMV2) | 0.75 | 0.75 | 0.75 | 0.75 | 0.75 |
| Knowledge on geoscientific issues (SIMV3) | 0.50 | 0.50 | 0.50 | 1.00 | 0.50 |
| Level of interpretation (SIMV4) | 0.50 | 0.75 | 0.50 | 0.50 | 0.25 |
| II. Scenic/Aesthetic values (VSA) | |||||
| Viewpoint (SIMV5) | 0.00 | 1.00 | 0.25 | 1.00 | 0.00 |
| Surface (SIMV6) | 0.50 | 0.50 | 0.50 | 0.50 | 0.50 |
| Surrounding landscapes and nature (SIMV7) | 0.75 | 0.50 | 0.75 | 0.50 | 0.75 |
| Environmental fitting of sites (SIMV8) | 1.00 | 1.00 | 1.00 | 0.50 | 1.00 |
| III. Protection (VPr) | |||||
| Current condition (SIMV9) | 0.50 | 0.75 | 0.25 | 0.50 | 0.50 |
| Protection level (SIMV10) | 0.75 | 0.75 | 0.75 | 0.75 | 0.00 |
| Vulnerability (SIMV11) | 0.25 | 0.75 | 0.25 | 0.50 | 0.50 |
| Suitable number of visitors (SIMV12) | 0.50 | 1.00 | 0.75 | 0.50 | 0.75 |
| Additional Values (AV) | |||||
| I. Functional Values (VFn) | |||||
| Accessibility (SIAV1) | 0.50 | 1.00 | 0.75 | 0.25 | 0.75 |
| Additional natural values (SIAV2) | 0.00 | 0.00 | 0.00 | 0.25 | 0.00 |
| Additional anthropogenic values (SIAV3) | 0.50 | 0.00 | 1.00 | 0.25 | 0.25 |
| Vicinity of emissive centres* (SIAV4) | 0.25 | 0.50 | 0.50 | 0.50 | 0.50 |
| Vicinity of important road network (SIAV5) | 0.75 | 0.75 | 0.75 | 0.75 | 0.75 |
| Additional functional values (SIAV6) | 0.50 | 0.50 | 0.75 | 0.50 | 0.50 |
| II. Touristic values (VTr) | |||||
| Promotion (SIAV7) | 0.75 | 0.75 | 0.25 | 0.25 | 0.25 |
| Organised visits (SIAV8) | 1.00 | 1.00 | 0.25 | 0.00 | 0.00 |
| Vicinity of visitors centres (SIAV9) | 0.00 | 0.00 | 0.00 | 0.00 | 0.00 |
| Interpretative panels (SIAV10) | 0.25 | 0.25 | 0.25 | 0.25 | 0.00 |
| Number of visitors (SIAV11) | 0.50 | 0.75 | 0.25 | 0.25 | 0.25 |
| Tourism infrastructure (SIAV12) | 0.25 | 0.50 | 0.25 | 0.25 | 0.00 |
| Tour guide service (SIAV13) | 0.25 | 0.00 | 0.00 | 0.00 | 0.00 |
| Hostelry service (SIAV14) | 0.75 | 1.00 | 1.00 | 1.00 | 1.00 |
| Restaurant service (SIAV15) | 0.75 | 1.00 | 1.00 | 1.00 | 1.00 |
Table 2
Classification of the geosites in different zones based on GAM model.
| Geosite | Main Values (VSE + VSA + VPr) | Additional Values (VFn + VTr) | Zone | |
|---|---|---|---|---|
| Cape of Rodon | GS1 | 2.50 + 2.25 + 2.00 = 6.75 | 2.50 + 4.50 = 7.00 | Z 22 |
| St.Pjeter Beach | GS2 | 2.75 + 3.00 + 3.25 = 9.00 | 2.75 + 5.25 = 8.00 | Z 32 |
| Kallmi Beach | GS3 | 2.25 + 2.50 + 2.00 = 6.75 | 3.75 + 3.25 = 7.00 | Z 22 |
| Rock of Kavaja | GS4 | 2.75 + 2.50 + 2.25 = 7.50 | 2.50 + 3.00 = 5.50 | Z 22 |
| Cape of Pali | GS5 | 2.00 + 2.25 + 2.50 = 6.00 | 2.75 + 2.50 = 5.25 | Z 22 |