
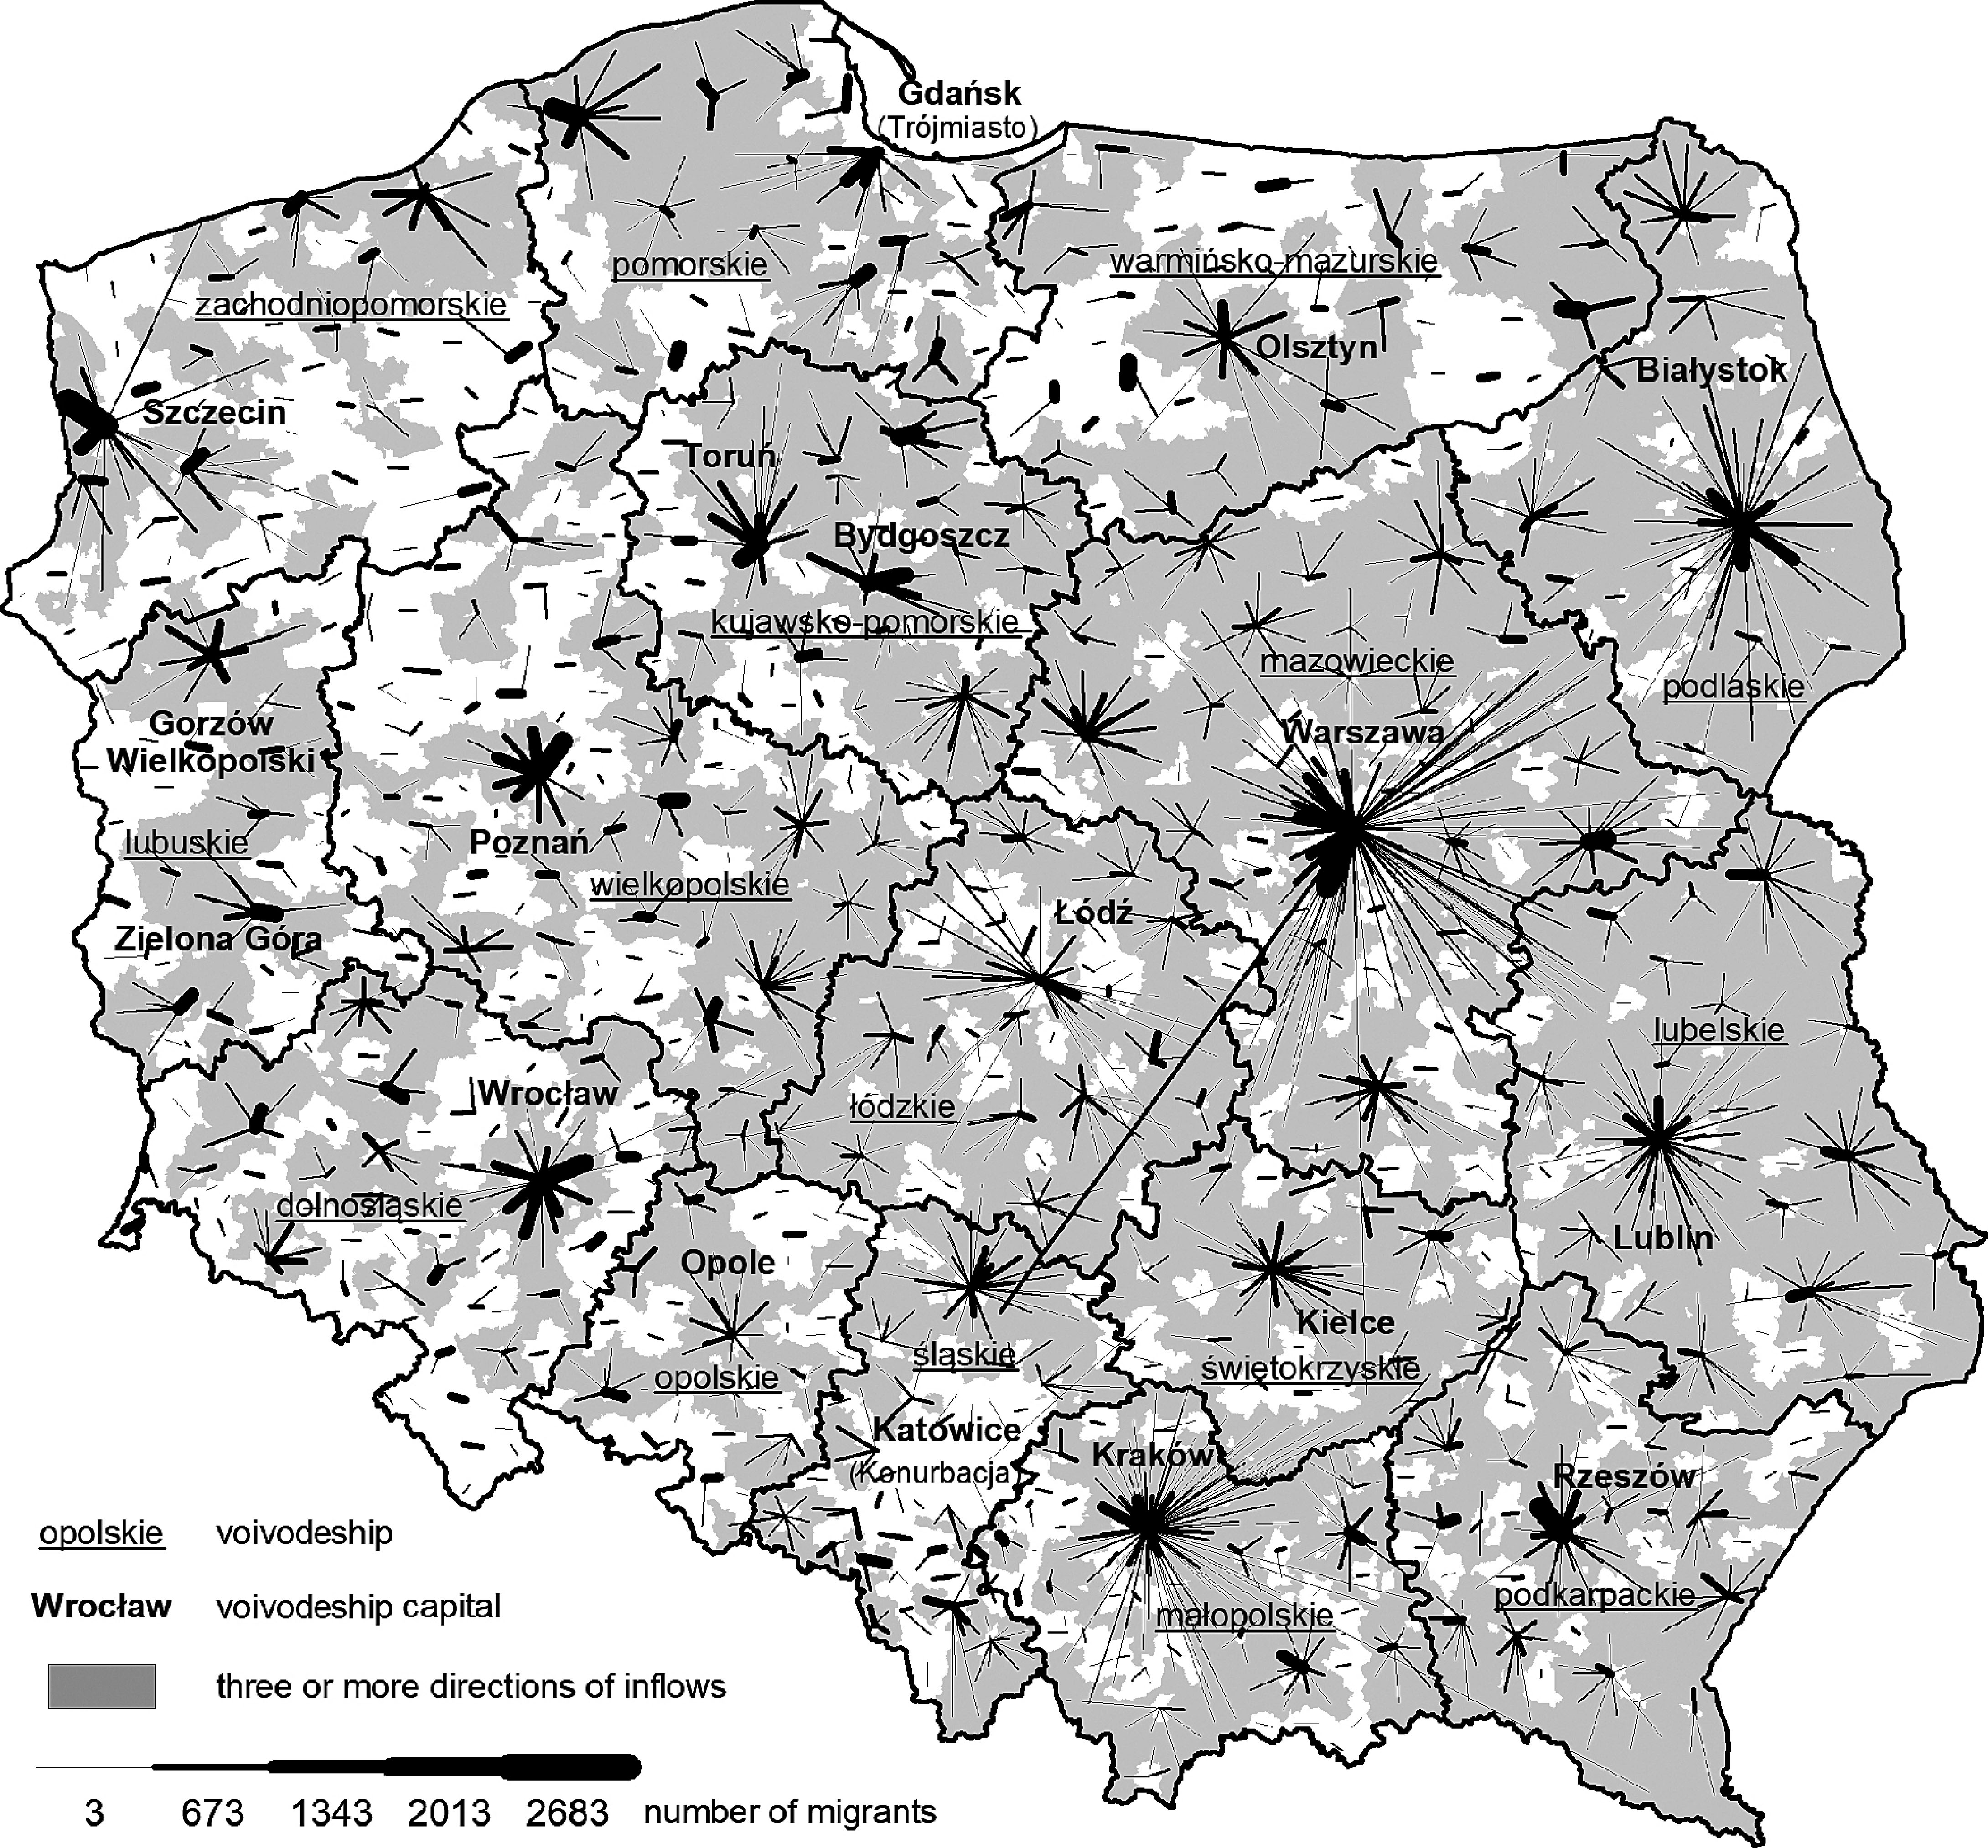
Fig. 1
Migratory catchment areas – rural areas as migration origins (linear scaling).
Source: elaborated on the basis of Statistics Poland – Demography database Table 2g (http://demografia.stat.gov.pl/bazademografia/Tables.aspx).
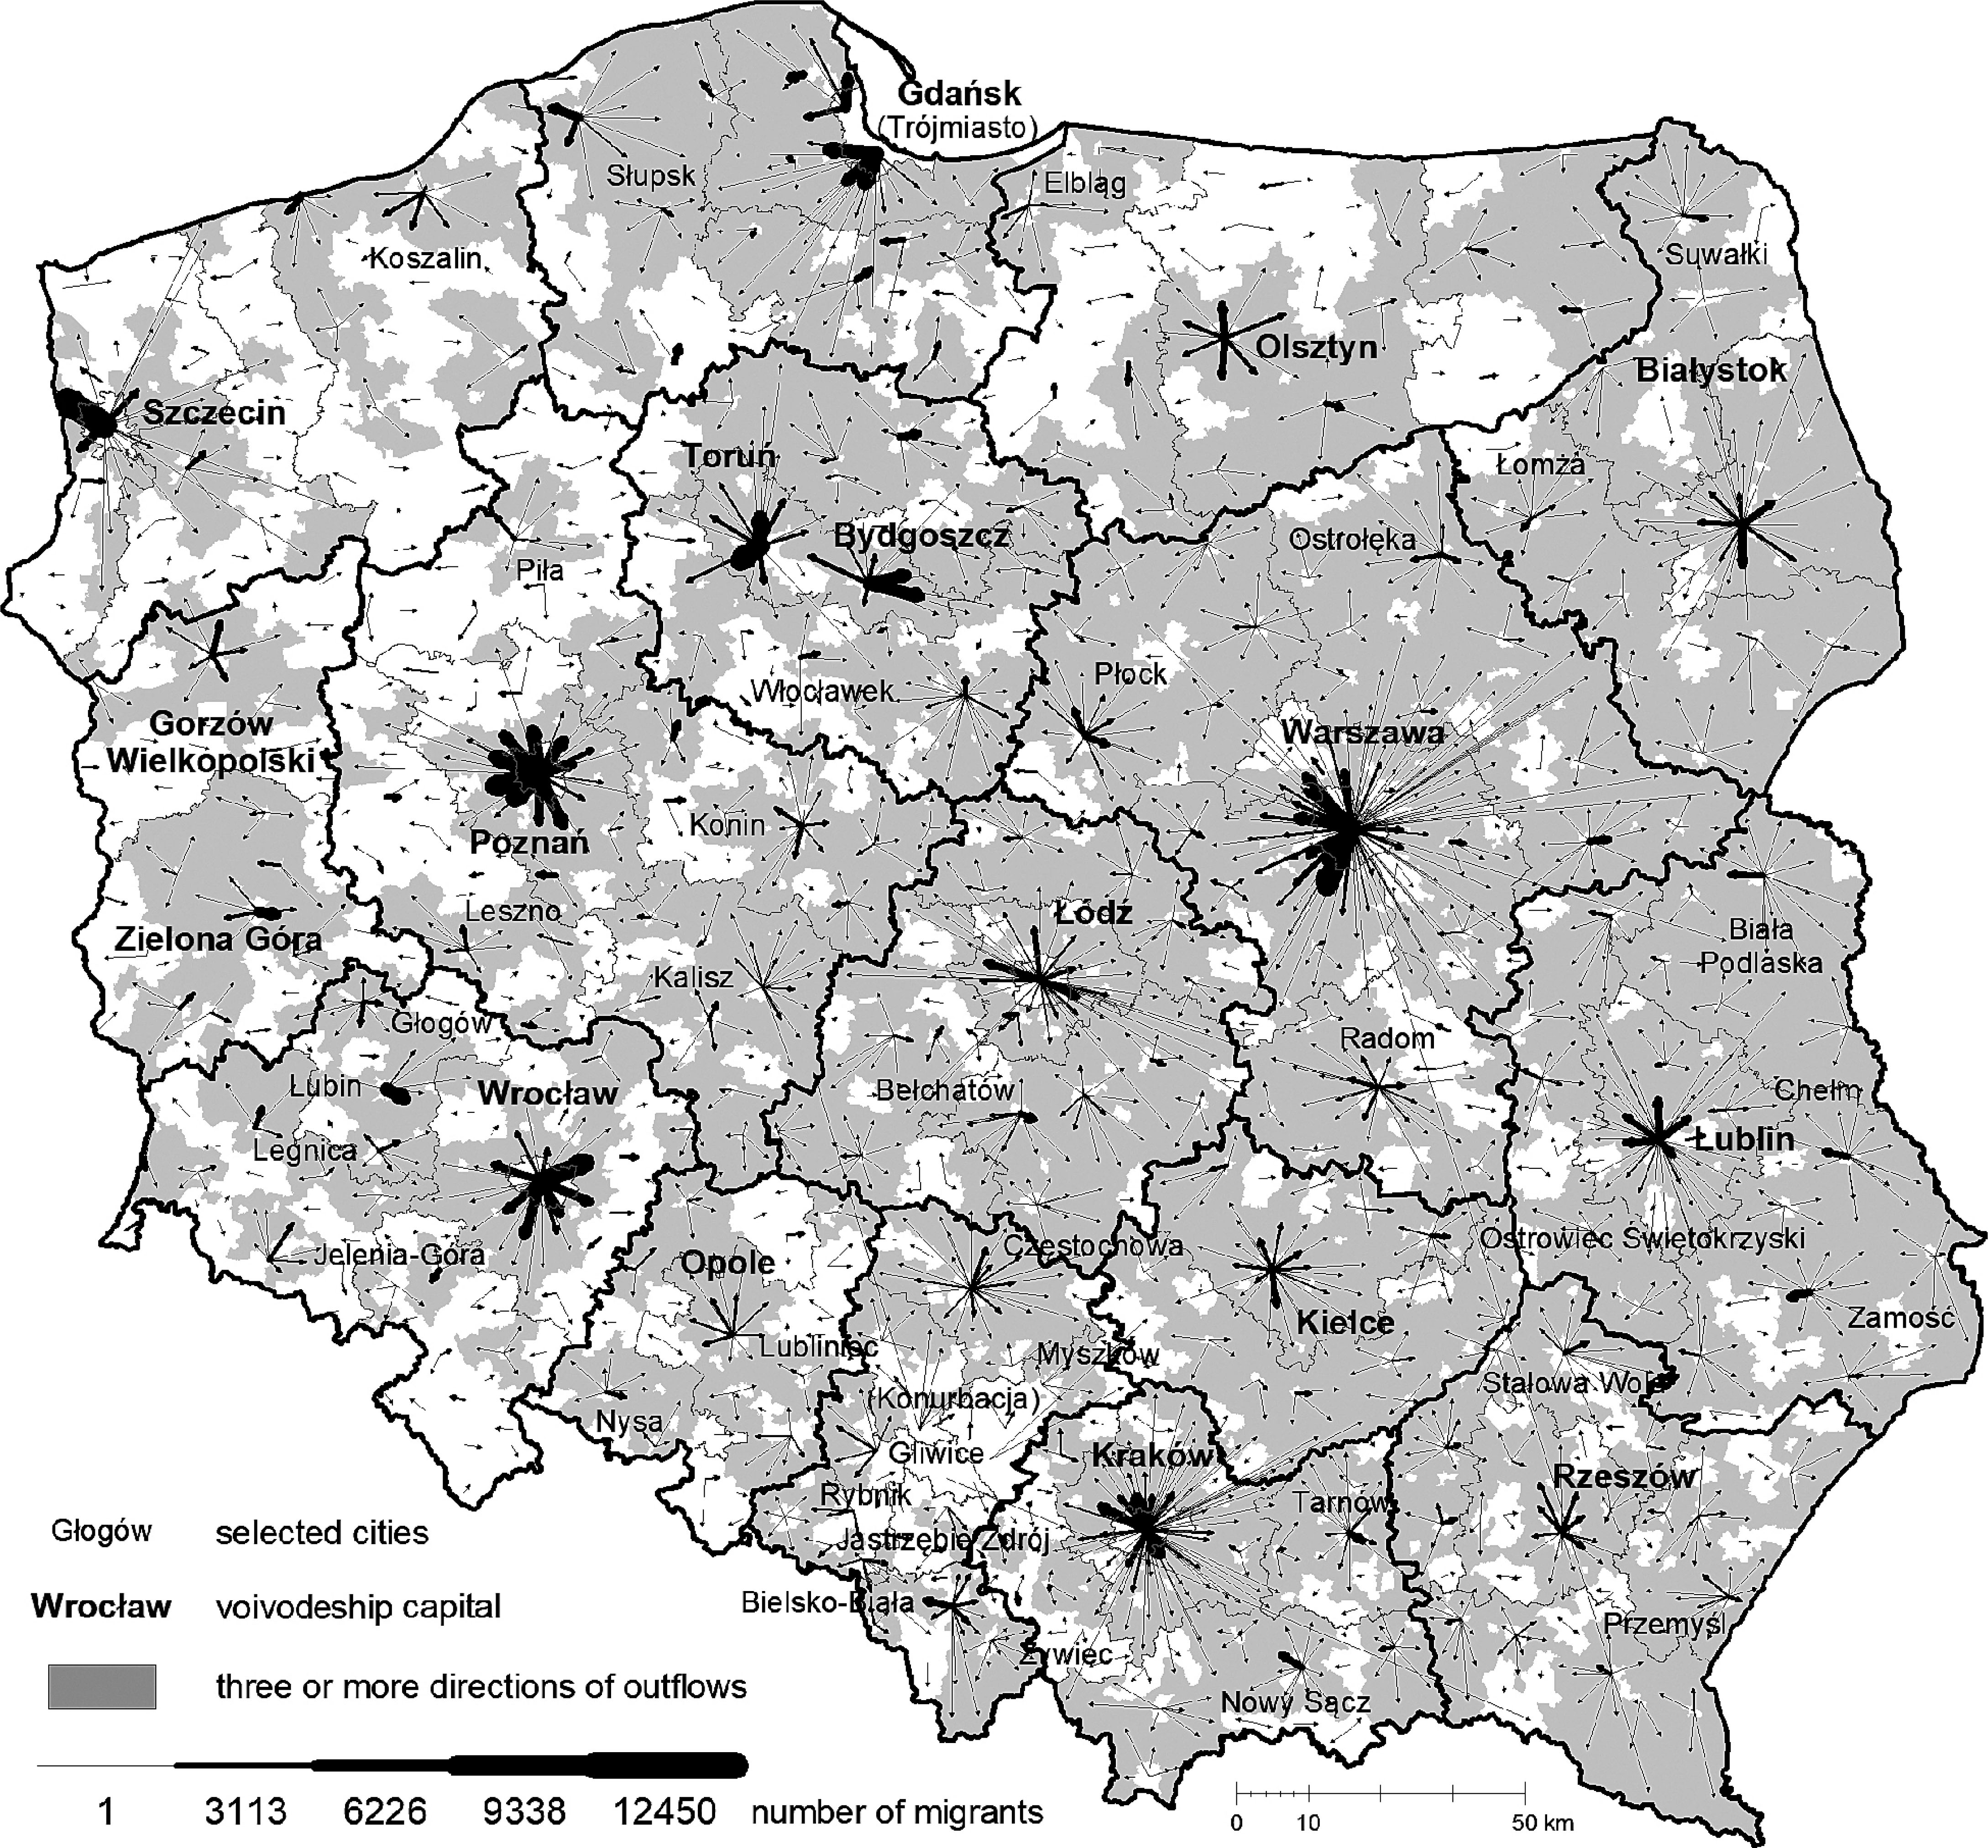
Fig. 2
Areas of migratory attractiveness – rural areas as outmigration destinations (linear scaling).
Source: elaborated on the basis of Statistics Poland – Demography database Table 2g (http://demografia.stat.gov.pl/bazademografia/Tables.aspx).
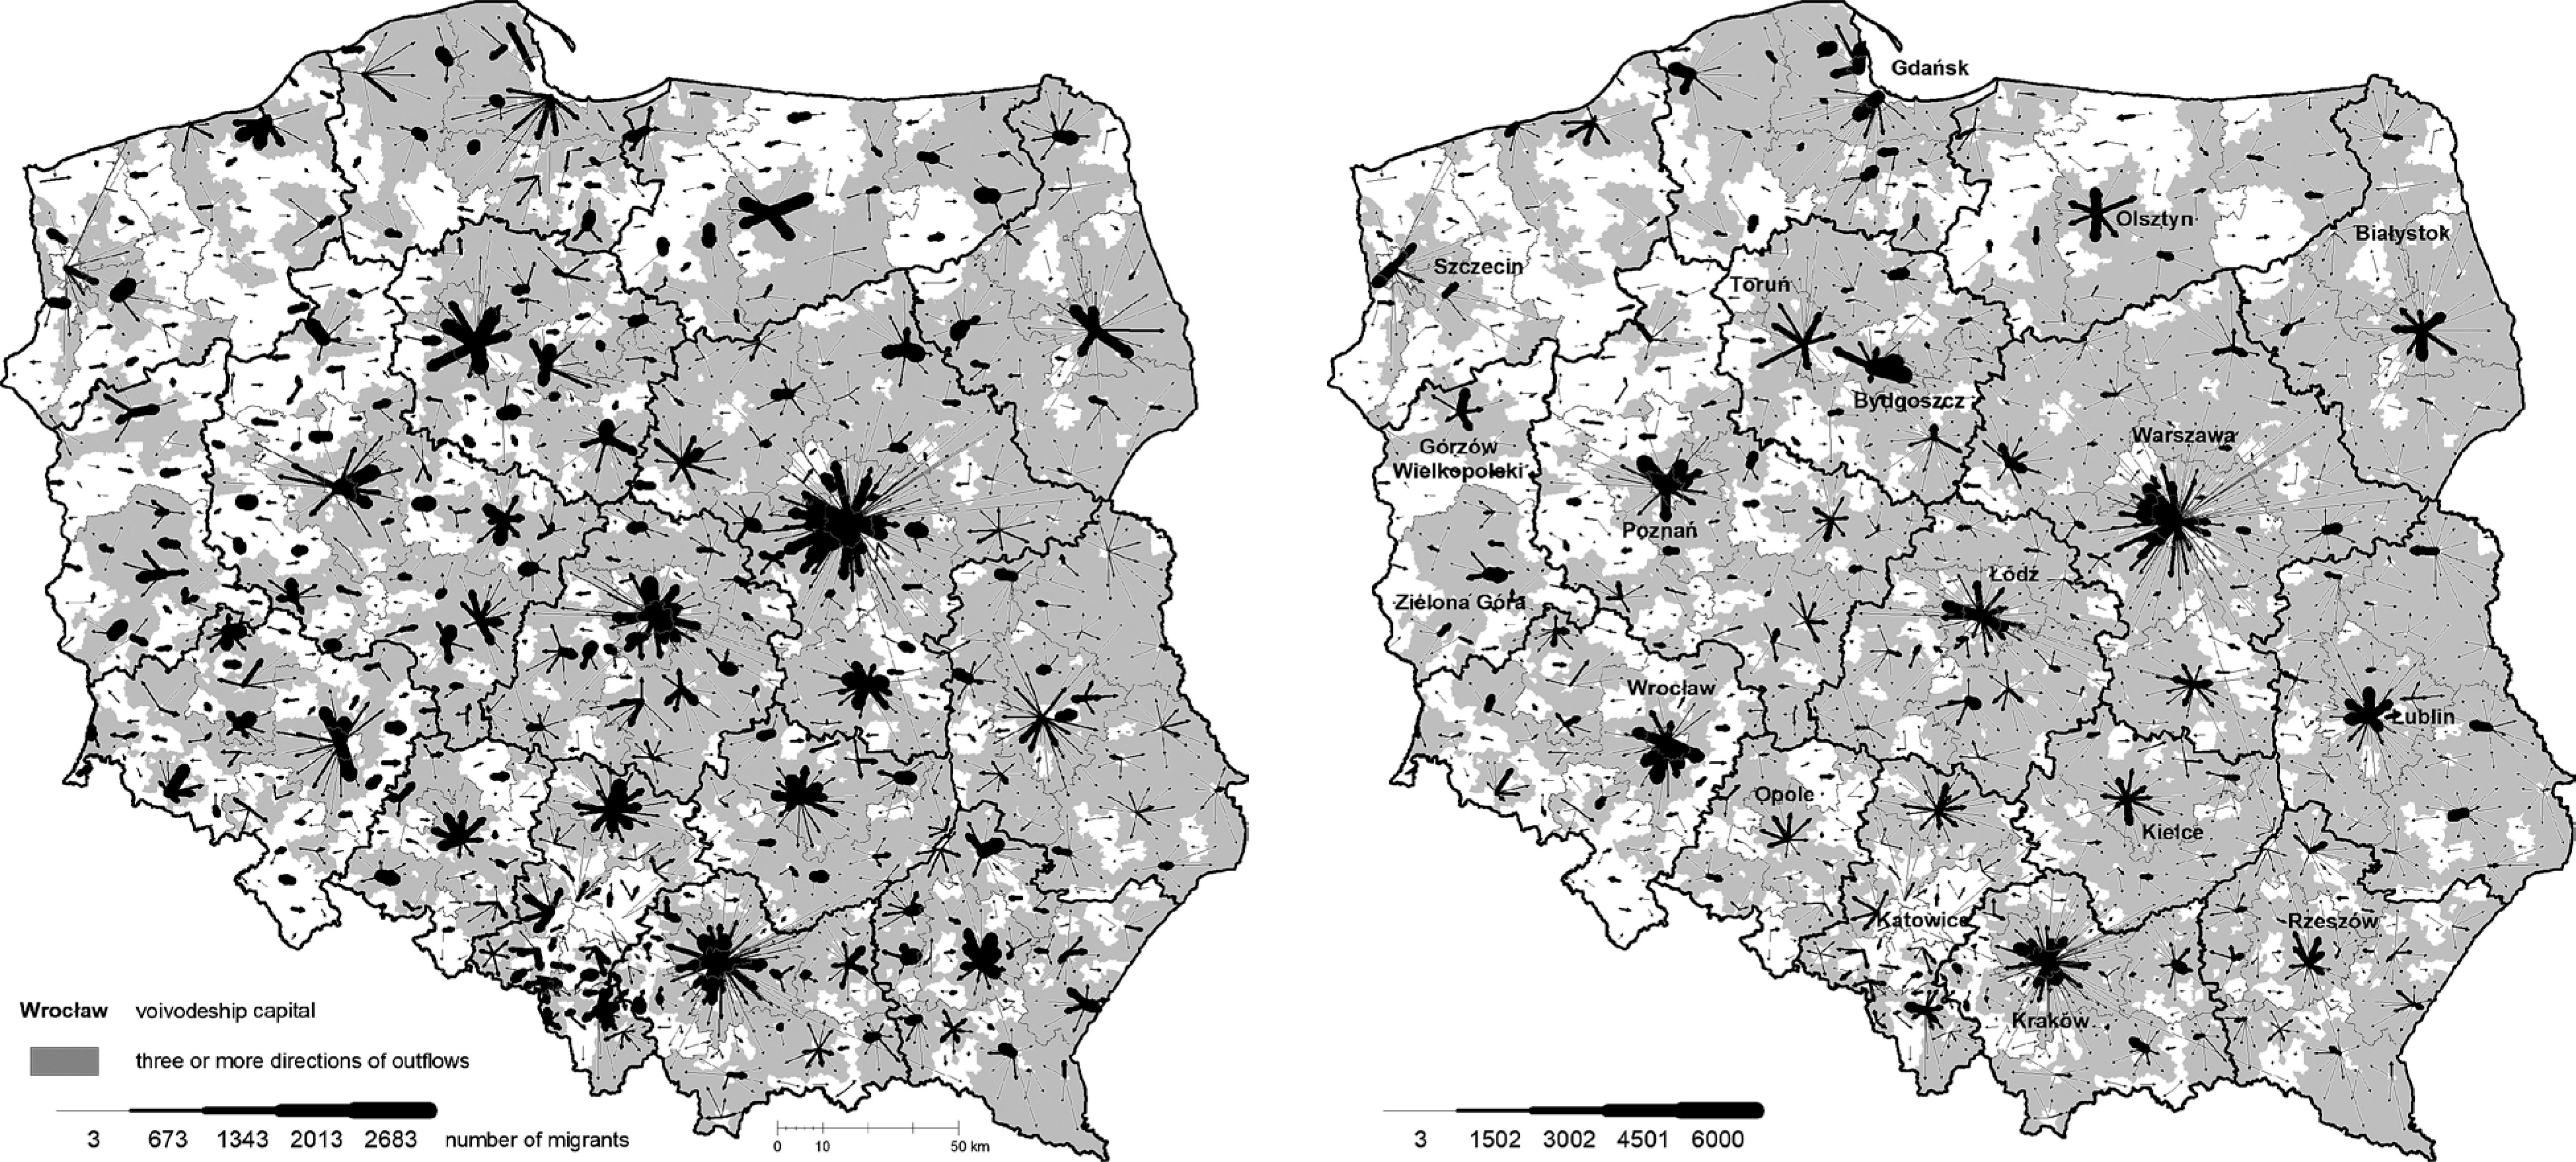
Fig. 3
Areas of migratory attractiveness presented on the scale of migratory movement catchment areas (left) and after trimming off the highest14 movement values (right) (linear scaling).
Source: elaborated on the basis of Statistics Poland – Demography database Table 2g (http://demografia.stat.gov.pl/bazademografia/Tables.aspx).

Fig. 4
Rural areas as origins and destinations of permanent internal migrations as well as catchment areas and areas of migratory attractiveness (linear scaling).
Source: elaborated on the basis of Statistics Poland – Demography database Table 2g (http://demografia.stat.gov.pl/bazademografia/Tables.aspx).