
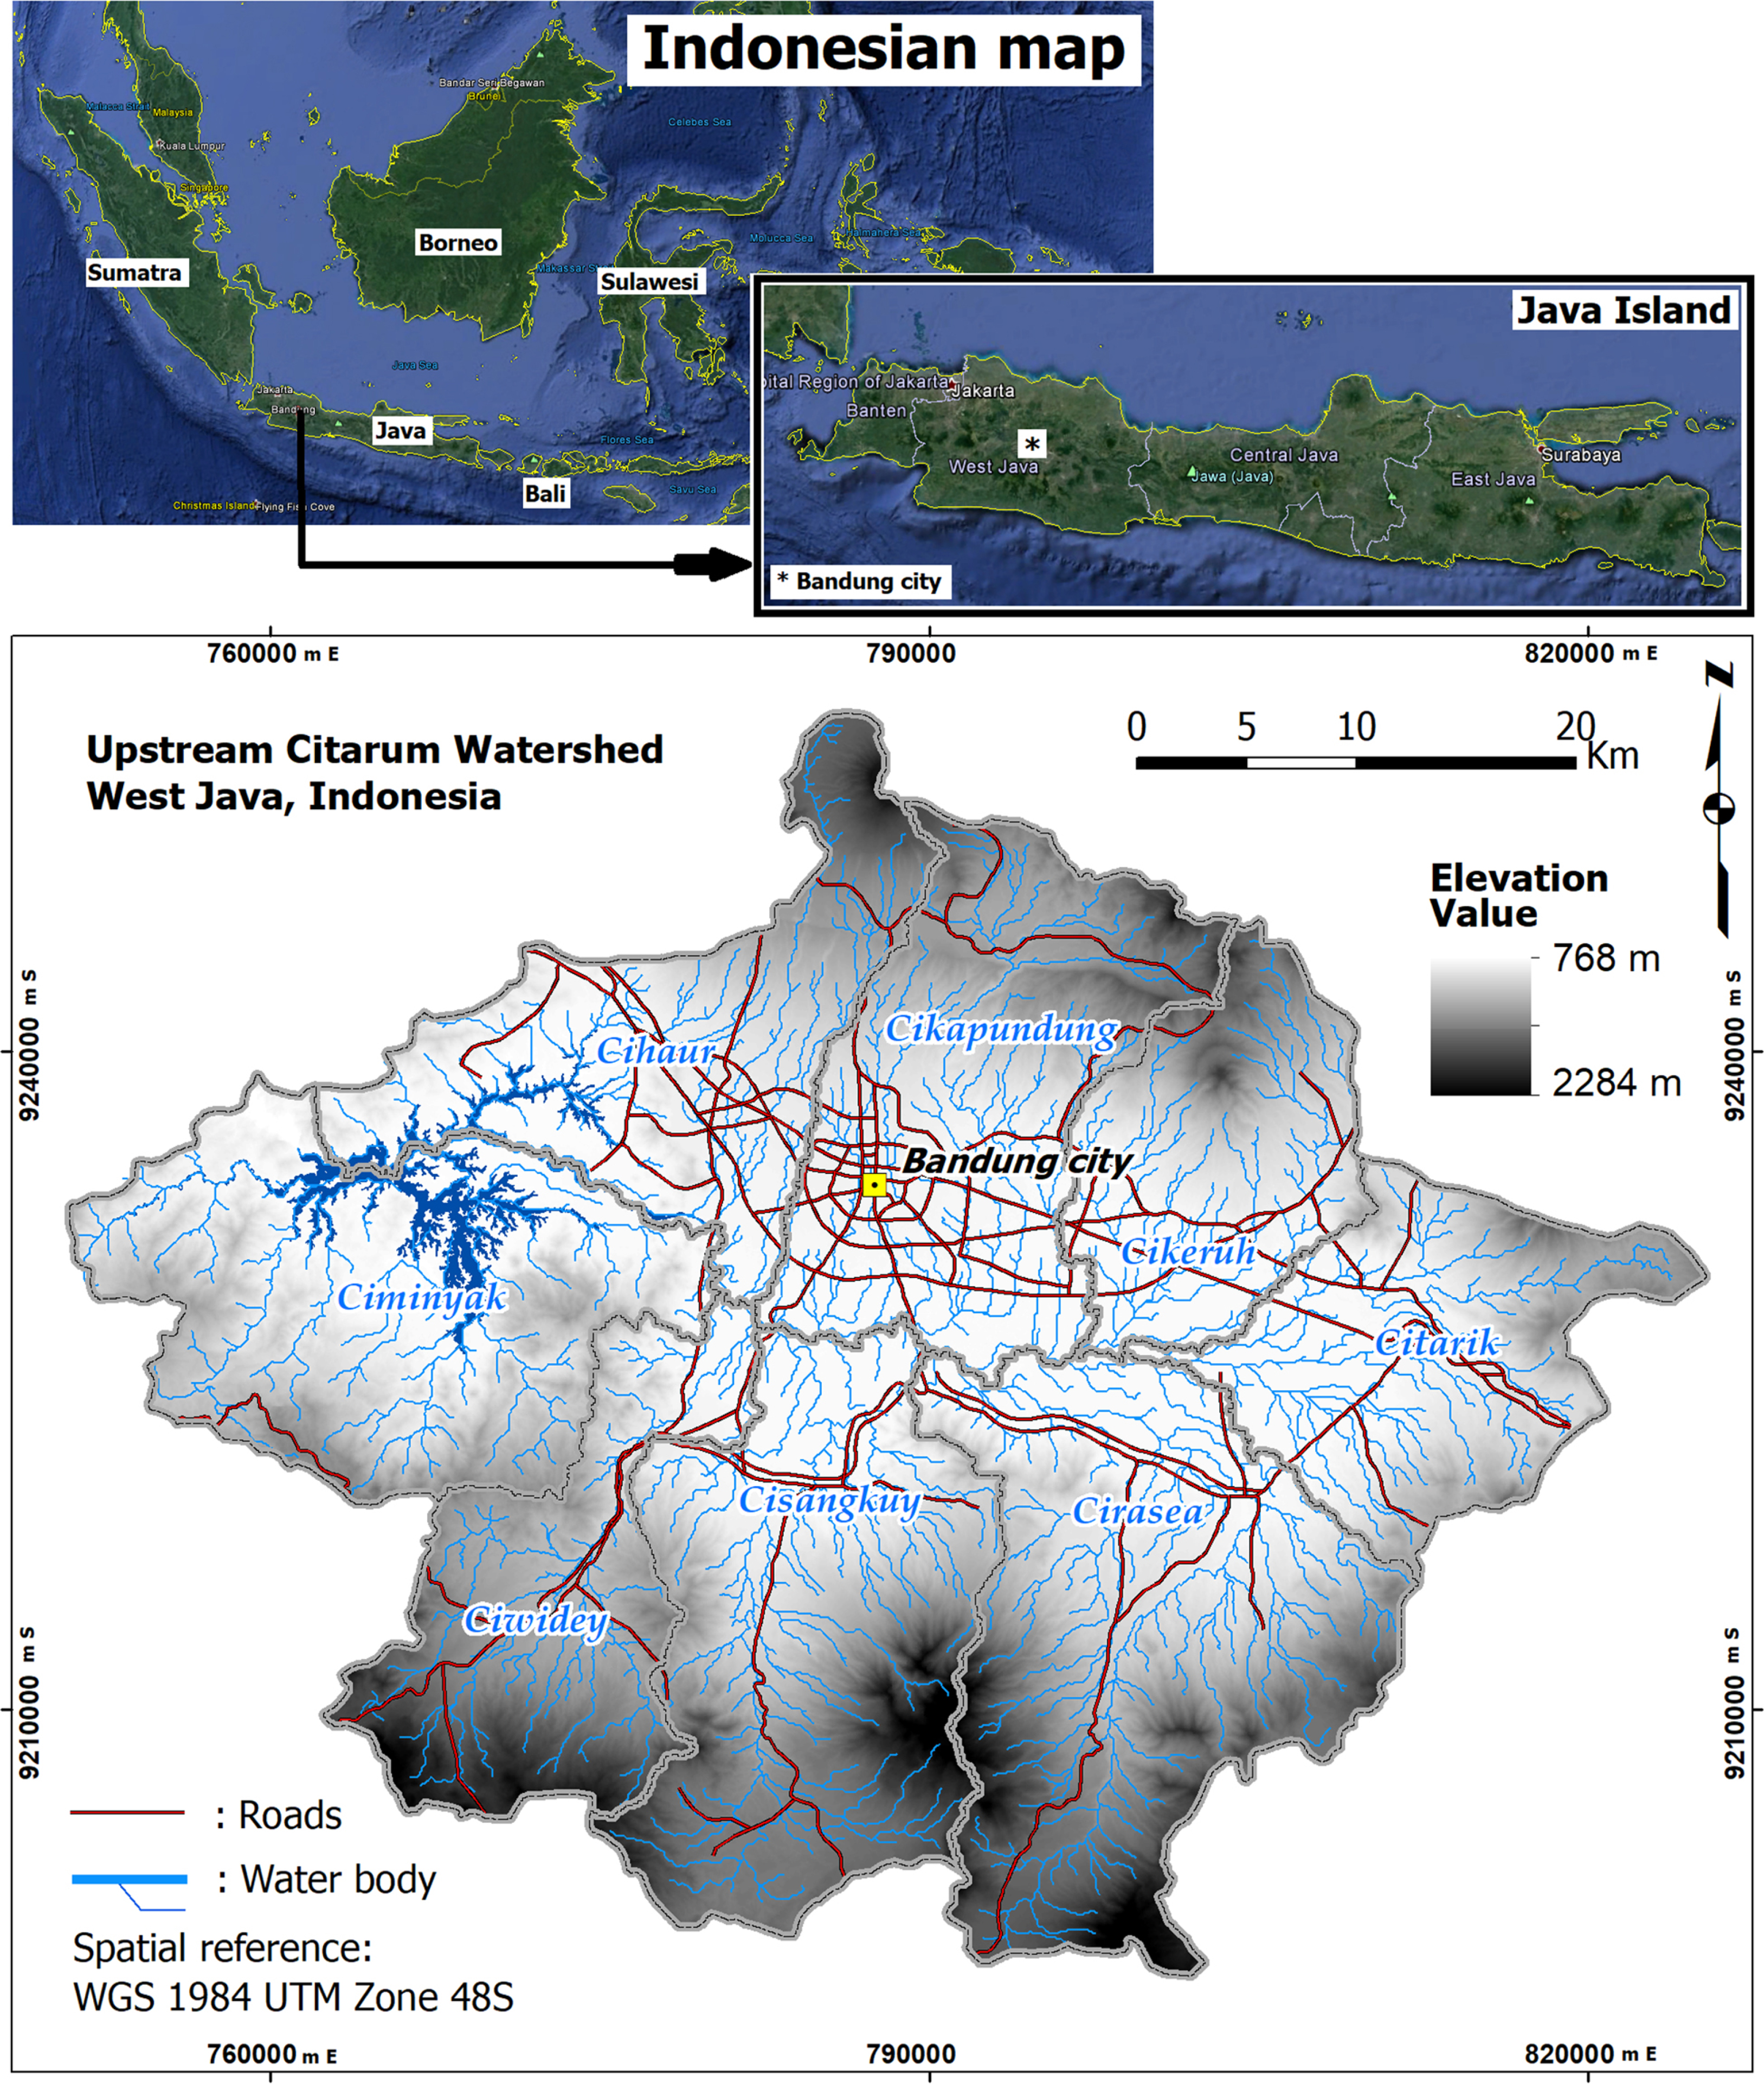
Fig. 1
Study area at the upstream Citarum Watershed, West Java, Indonesia. Elevation value from SRTM30 DEM provided by the U.S. Geological Survey (USGS).
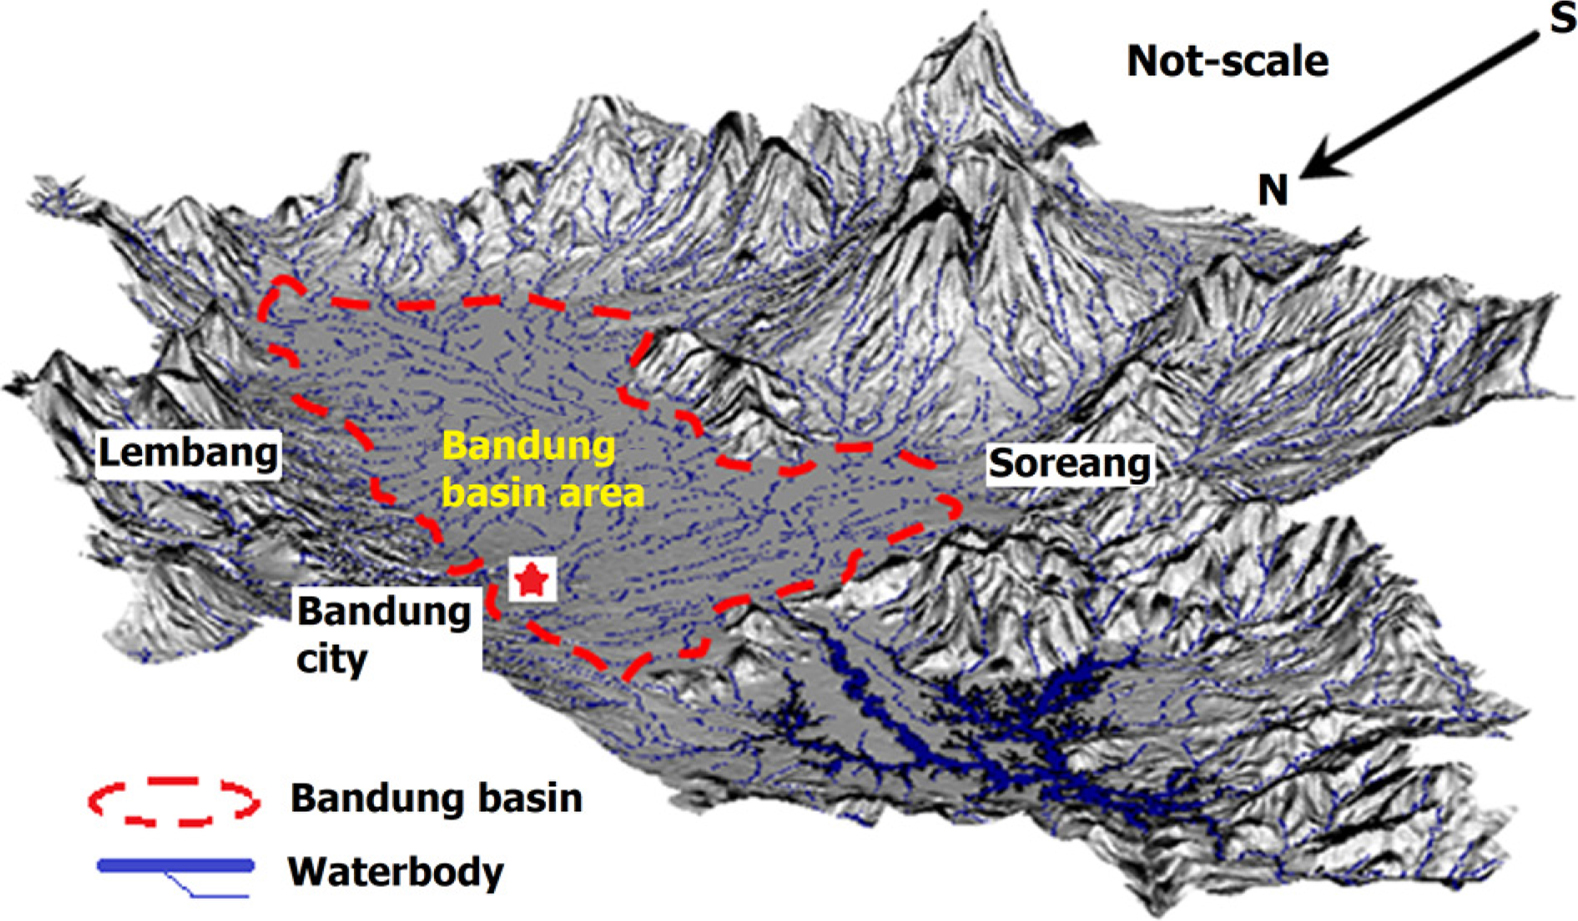
Fig. 2
3D view of the SRTM30 DEM for the Bandung Basin area (Cekungan Bandung).
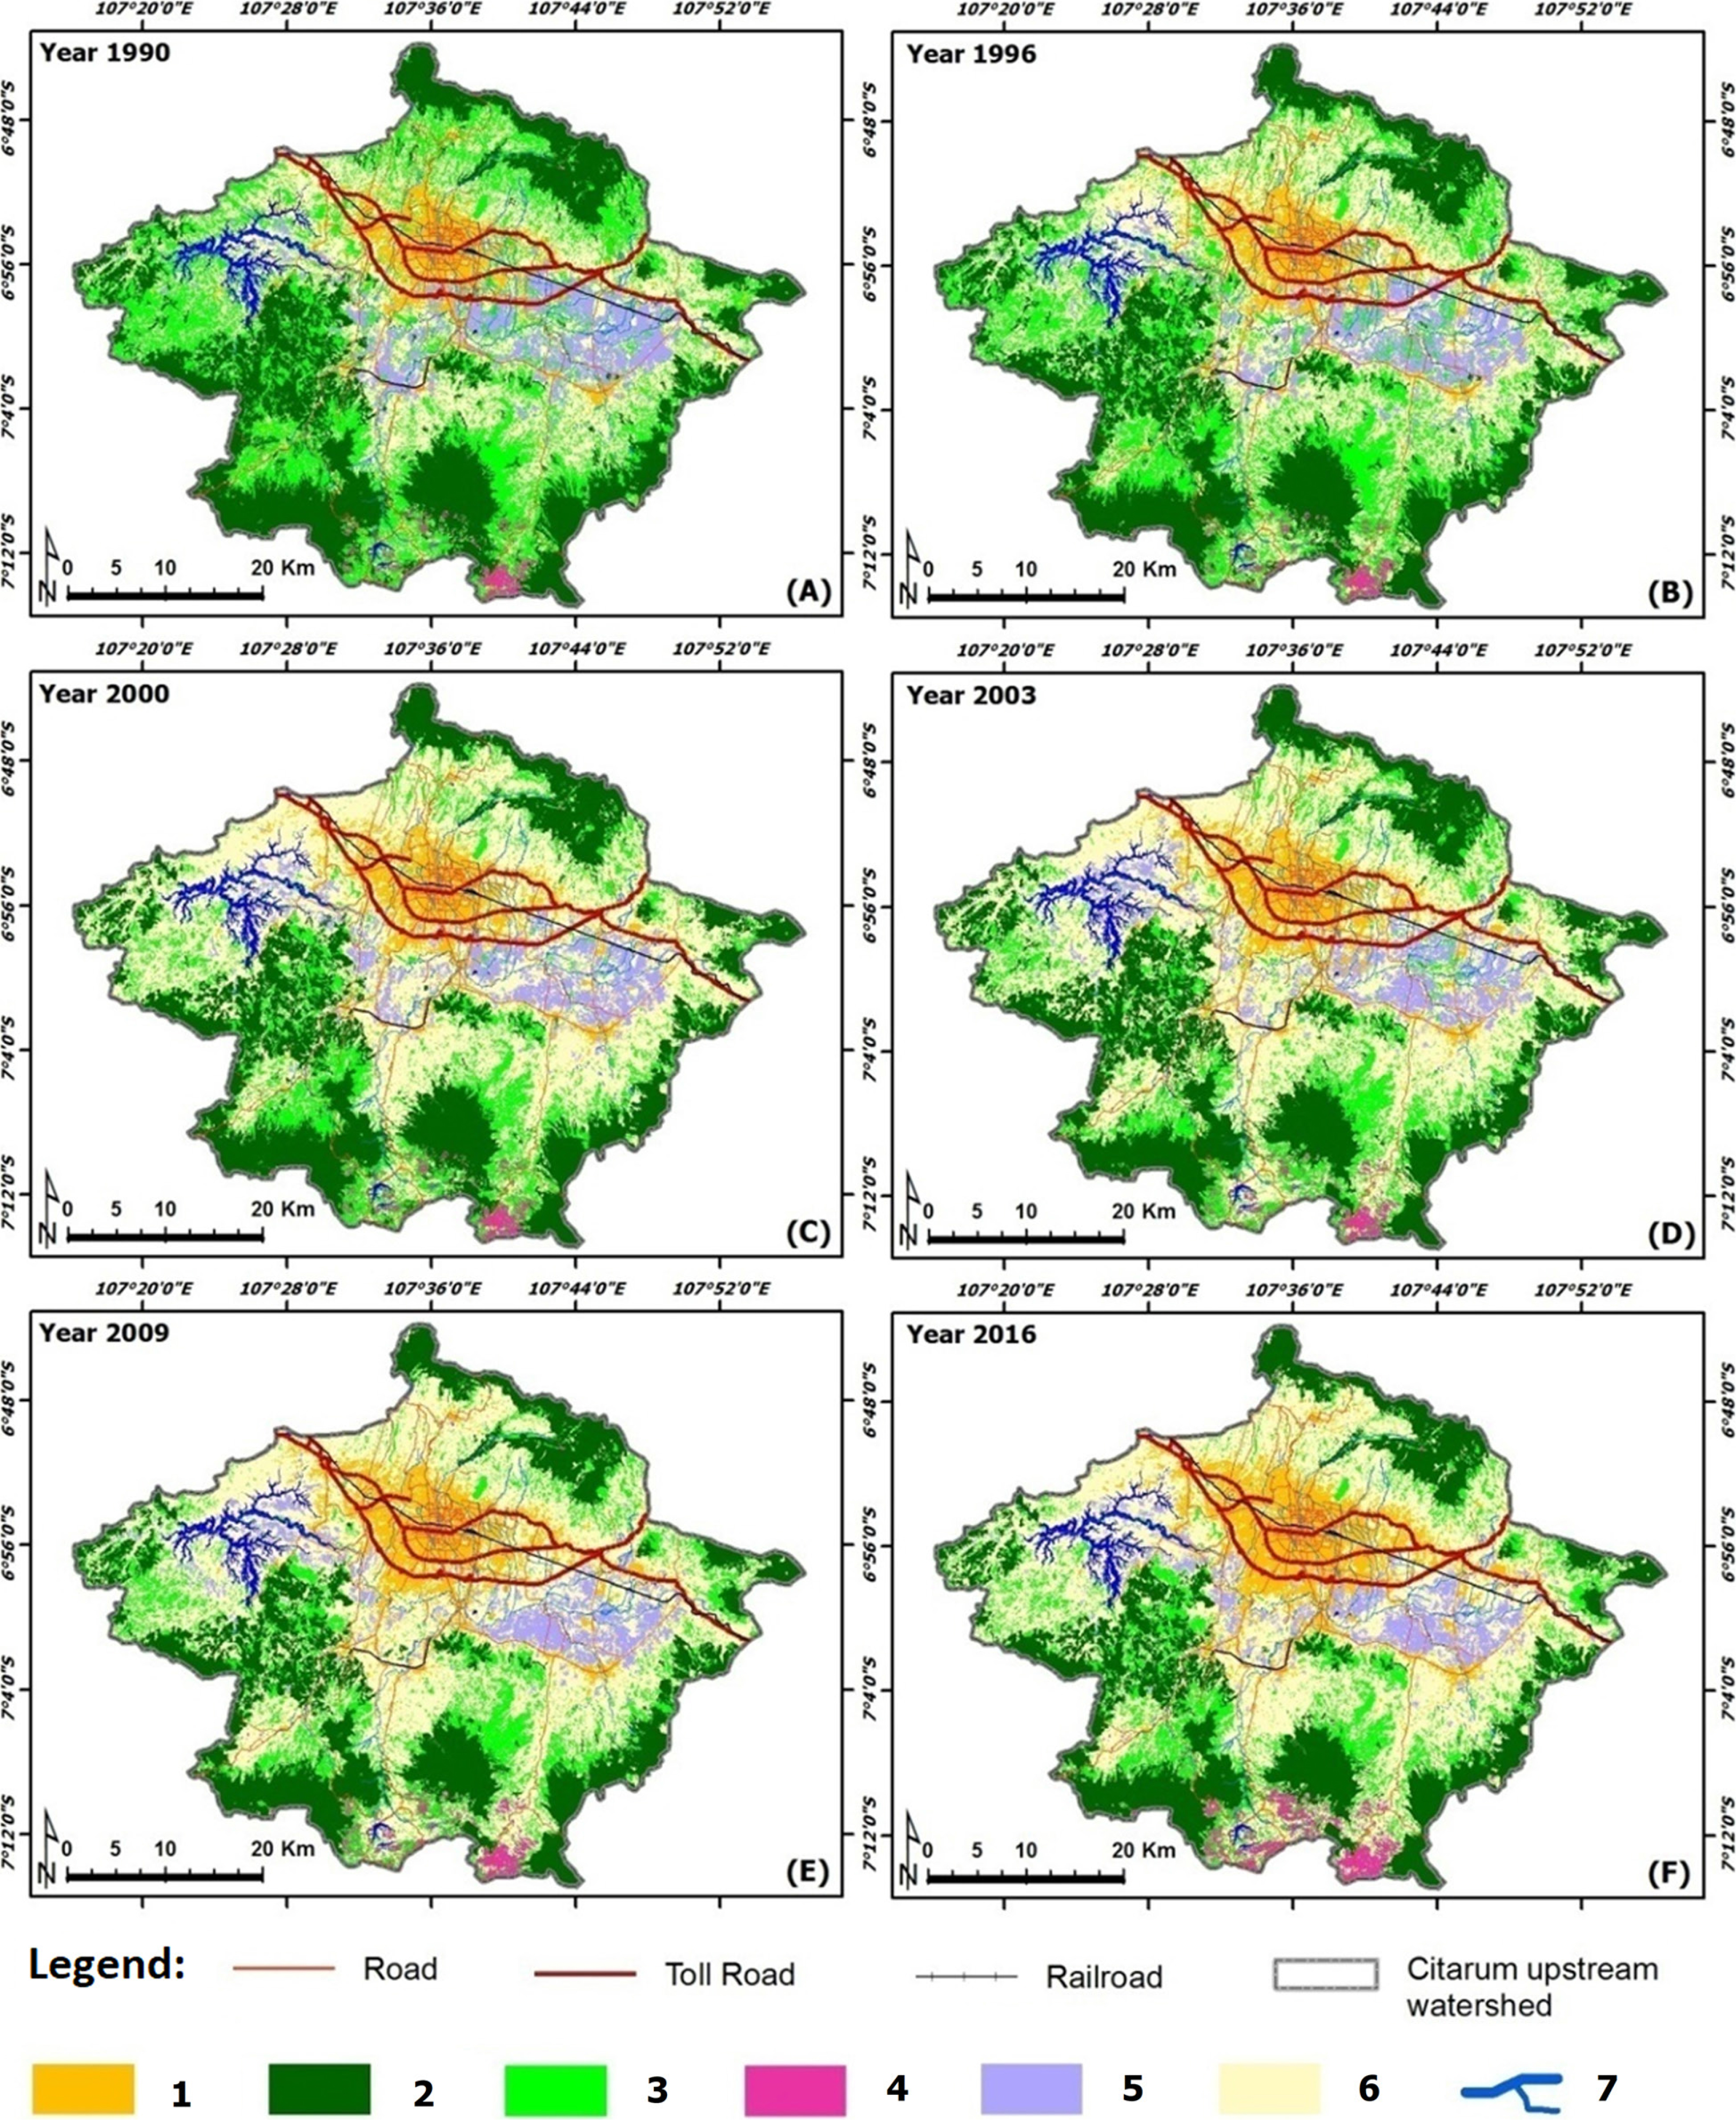
Fig. 3
LULC maps were used from various years during the period 1990–2016 (sourced and modified from Yulianto et al. (2018, 2019).
Table 1
| ID Class | LULC Type | Description |
|---|---|---|
| 1 | Urban/built-up area | Consists of all built-up area, residential, industrial, commercial area, villages, settlements, transportation infrastructure and others. |
| 2 | Primary forest | Consists of natural forests that have not been disrupted by human exploitation. |
| 3 | Secondary forest and mixed garden | Consists of industrial plantation forests and some garden planting, coconuts, fruits and others. |
| 4 | Plantation | Consists of conservation land, tea plantation, palm oil and others. |
| 5 | Wet agricultural land | Consists of land that requires much water for its planting patterns: irrigated rice fields, rice terraces and others. |
| 6 | Dry land farming | Consists of land that requires little water for its cropping patterns: fields, moorland and others. |
| 7 | Water body | Consists of all water sources, rivers, reservoirs, ponds and others. |
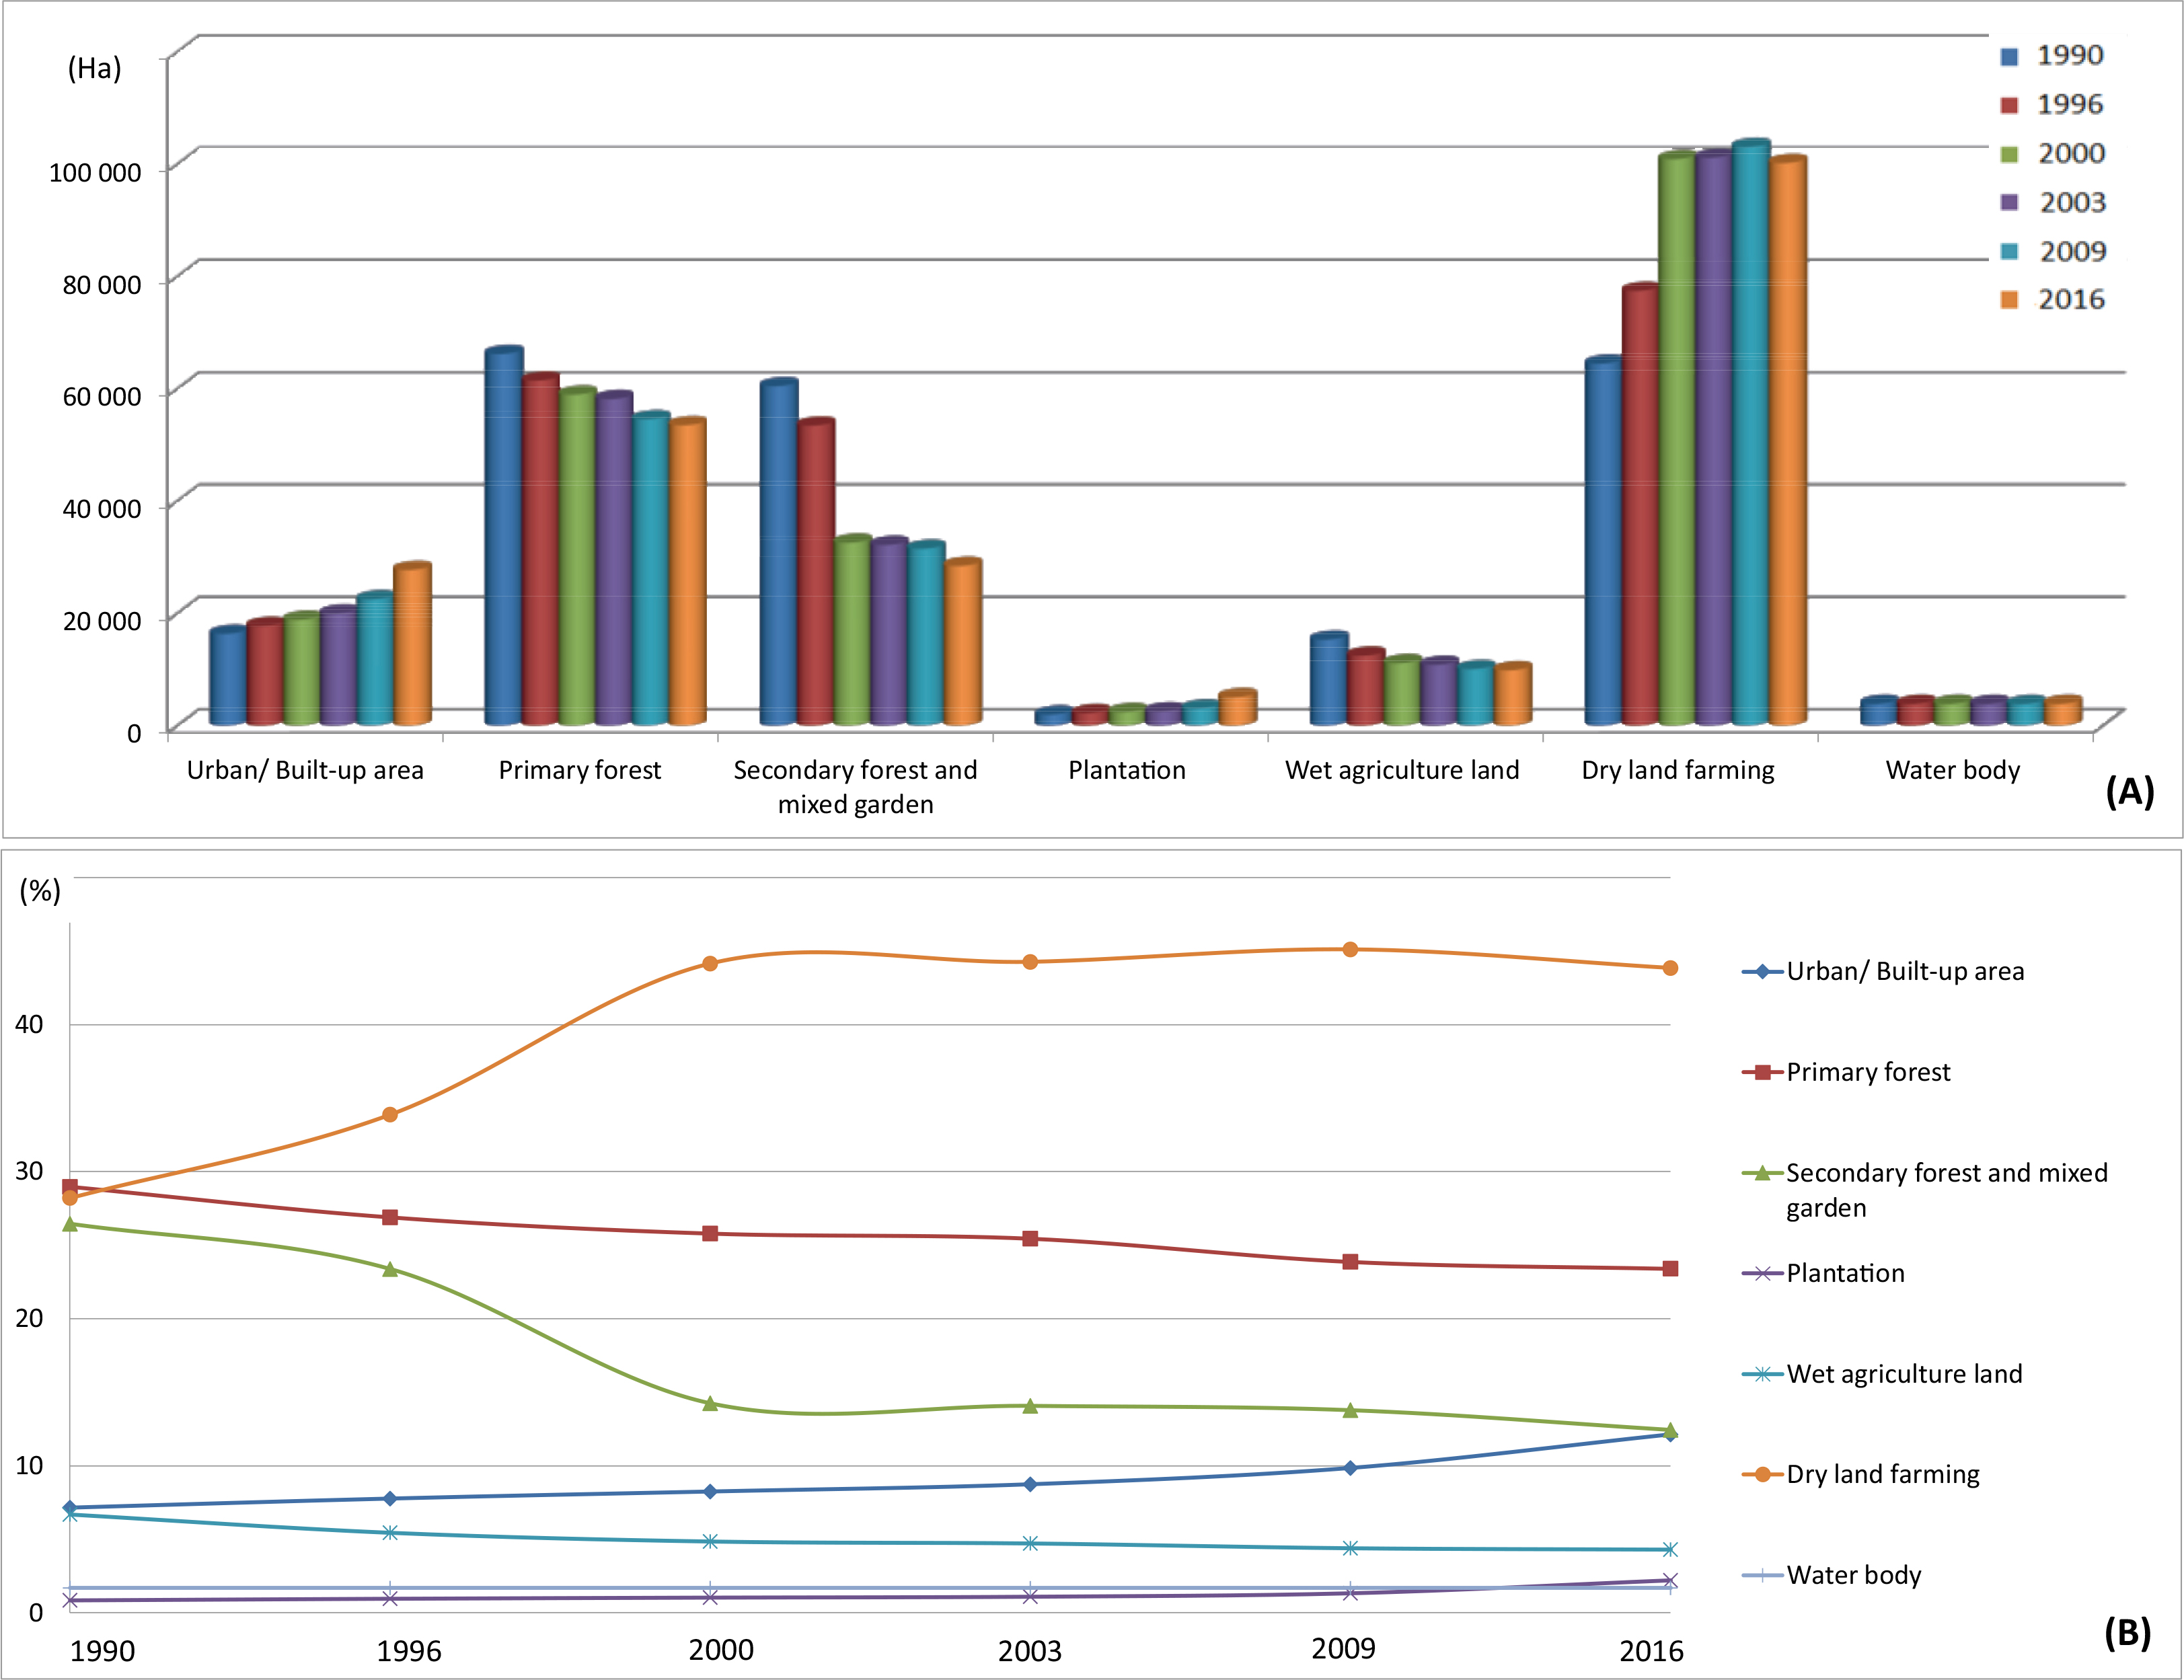
Fig. 4
The dynamics of LULC changes during the period 1990–2016 in the study area. A – estimated area in LULC changes (in hectares), B – Trends and percentages in LULC changes (in per cent).
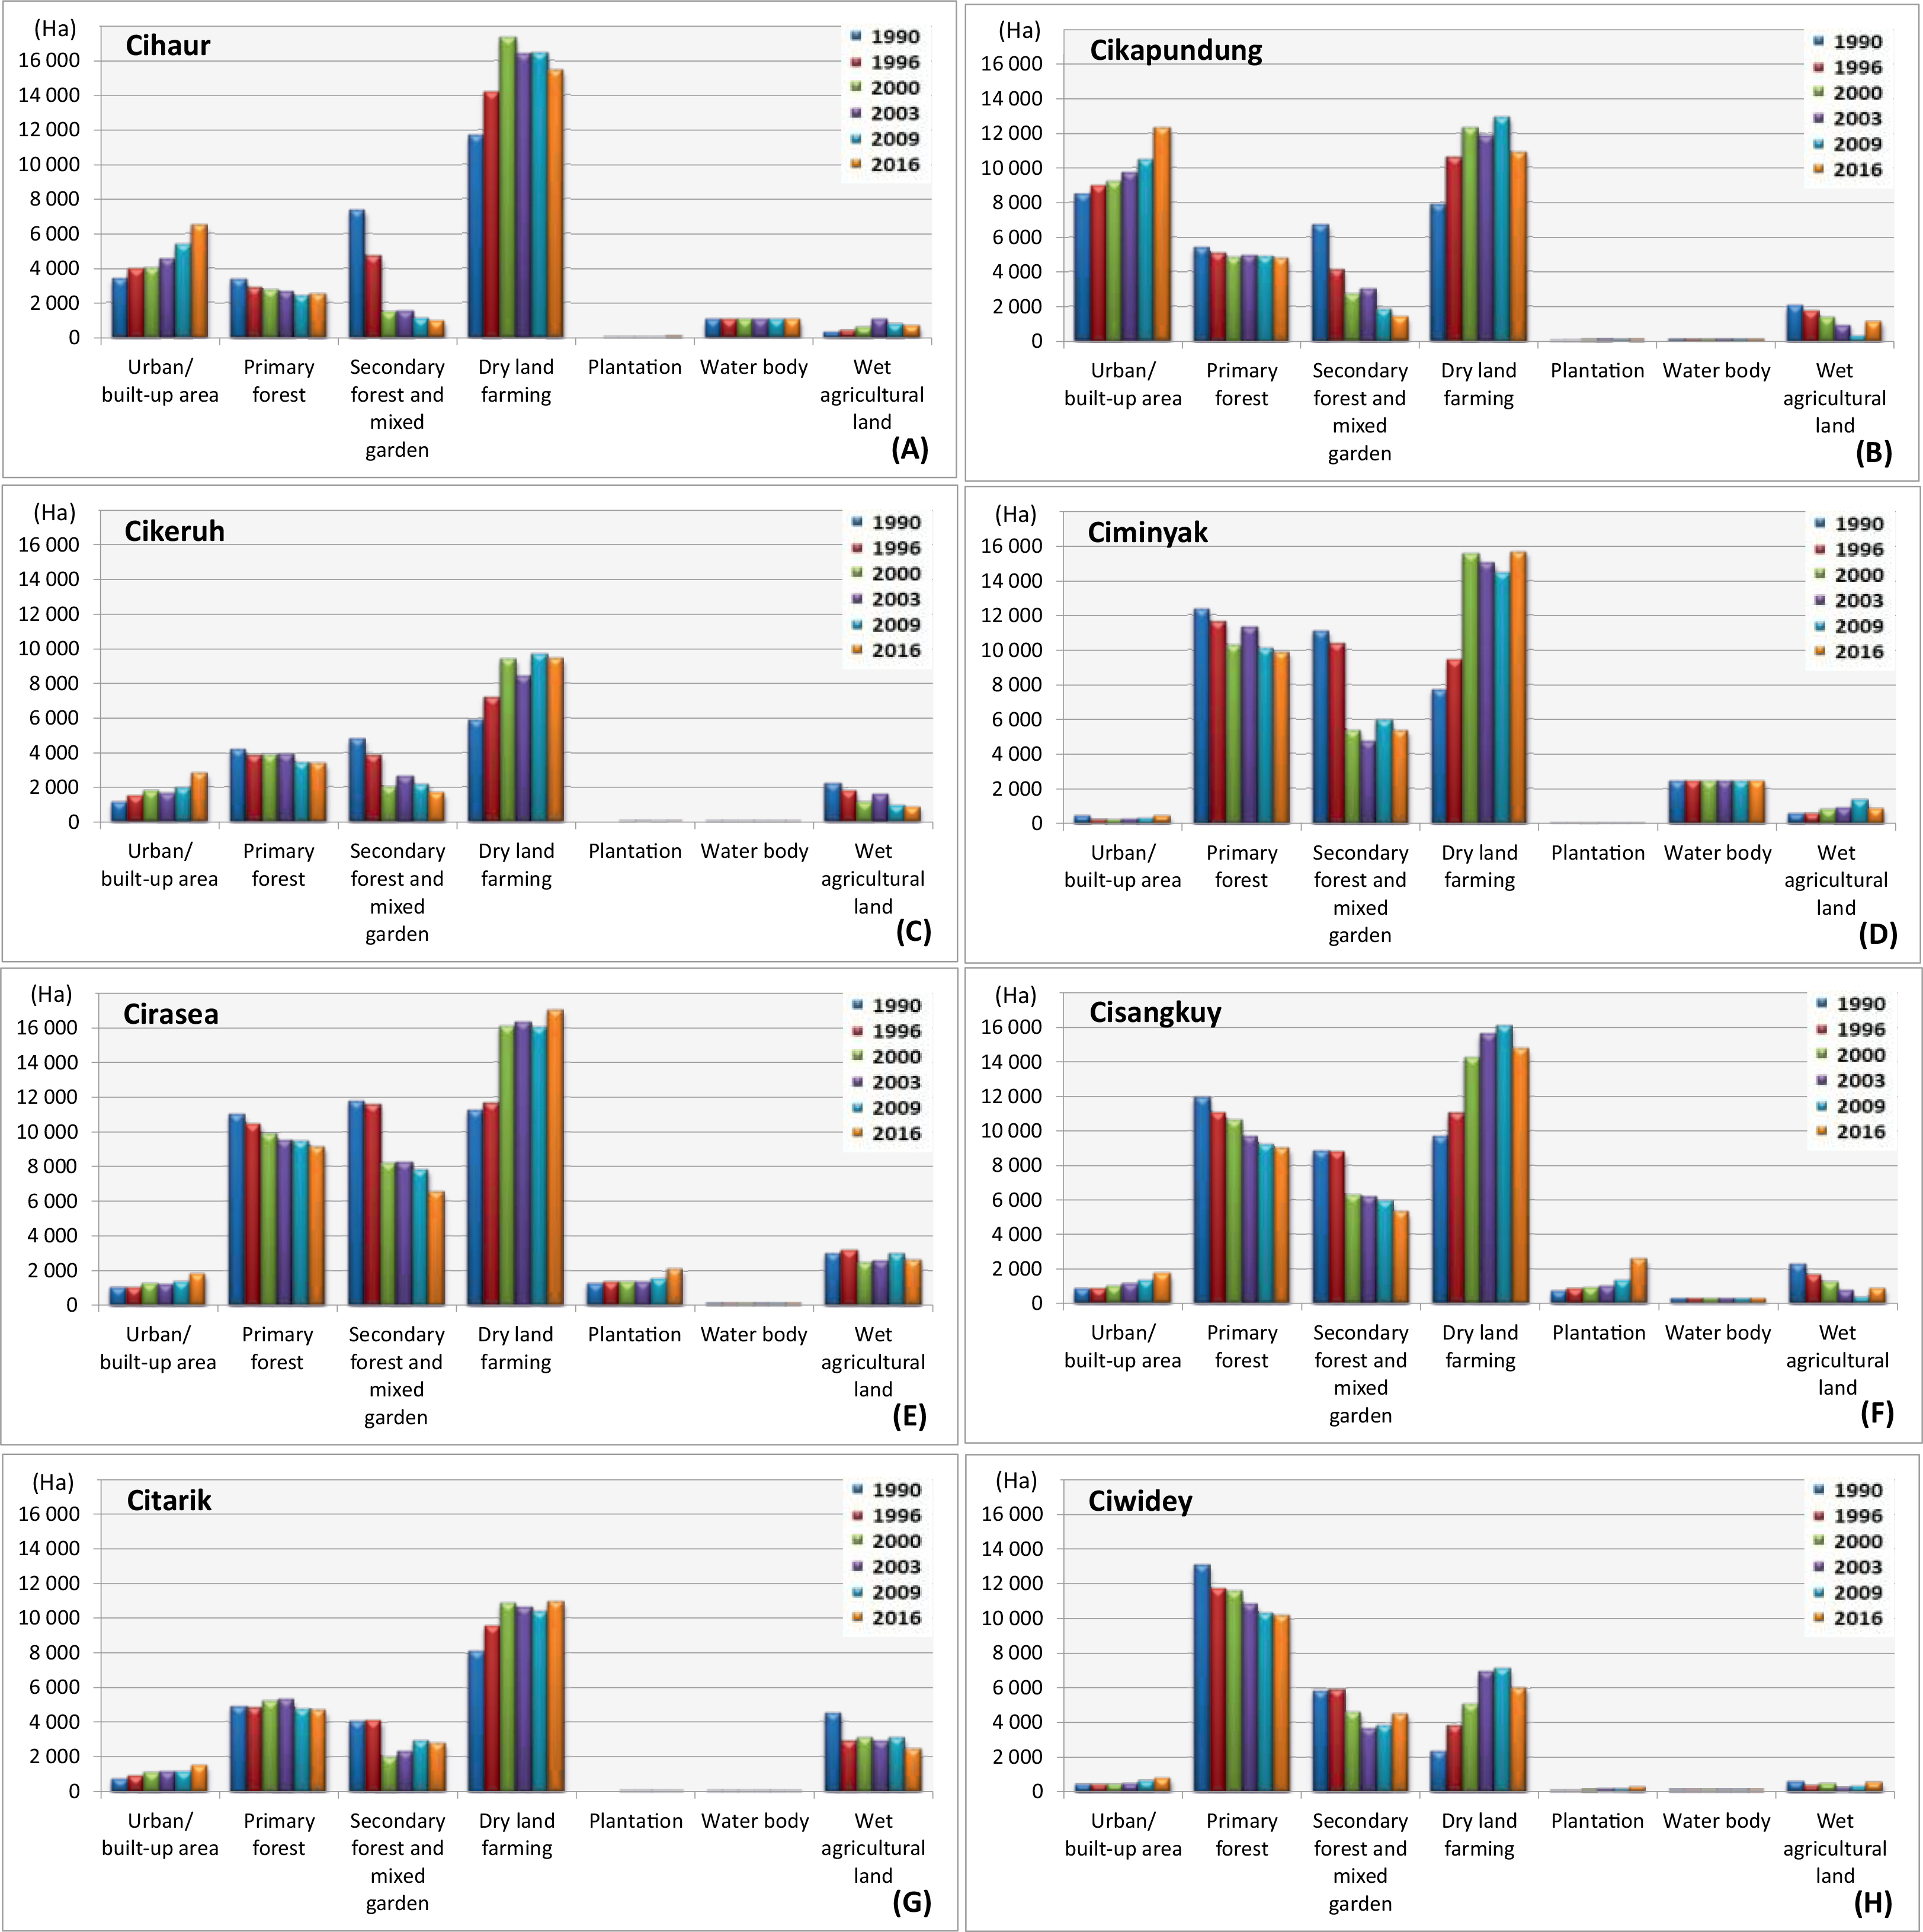
Fig. 5
The dynamics of LULC changes during 1990–2016 in the eight sub-watersheds in the study area.
Table 2
Urban/built-up area size in the eight sub-watersheds in the study area.
| Sub-Watershed | Area (ha) | |||||
|---|---|---|---|---|---|---|
| 1990 | 1996 | 2000 | 2003 | 2009 | 2016 | |
| Cihaur | 3,409.7 | 3,936.7 | 3,986.2 | 4,505.2 | 5,367.4 | 6,486.6 |
| Cikapundung | 8,414.6 | 8,965.7 | 9,222.3 | 9,702.7 | 10,451.0 | 12,311.6 |
| Cikeruh | 1,115.7 | 1,481.2 | 1,635.0 | 1,751.1 | 1,961.8 | 2,793.9 |
| Ciminyak | 207.1 | 210.3 | 218.8 | 292.9 | 422.2 | 435.3 |
| Cirasea | 1,019.8 | 1,022.3 | 1,194.9 | 1,257.6 | 1,373.7 | 1,788.1 |
| Cisangkuy | 808.3 | 858.7 | 944.5 | 1,111.6 | 1,318.9 | 1,692.9 |
| Citarik | 720.9 | 872.8 | 1,073.5 | 1,129.3 | 1,135.6 | 1,454.2 |
| Ciwidey | 391.9 | 392.8 | 405.1 | 459.9 | 586.6 | 753.9 |
Table 3
The rate of urban/built-up area expansion in the eight sub-watersheds in the study area.
| Sub-Watershed | UAER (ha a−1) | |||||
|---|---|---|---|---|---|---|
| 1990–1996 | 1996–2000 | 2000–2003 | 2003–2009 | 2009–2016 | 1990–2016 | |
| Cihaur | 87.8 | 12.4 | 173.0 | 143.7 | 159.9 | 118.3 |
| Cikapundung | 91.9 | 64.1 | 160.1 | 124.7 | 265.8 | 149.9 |
| Cikeruh | 60.9 | 38.4 | 38.7 | 35.1 | 118.9 | 64.5 |
| Ciminyak | 0.5 | 2.1 | 24.7 | 21.5 | 1.9 | 8.8 |
| Cirasea | 0.4 | 43.1 | 20.9 | 19.3 | 59.2 | 29.5 |
| Cisangkuy | 8.4 | 21.5 | 55.7 | 34.6 | 53.4 | 34.0 |
| Citarik | 25.3 | 50.2 | 18.6 | 1.1 | 45.5 | 28.2 |
| Ciwidey | 0.1 | 3.1 | 18.3 | 21.1 | 23.9 | 13.9 |
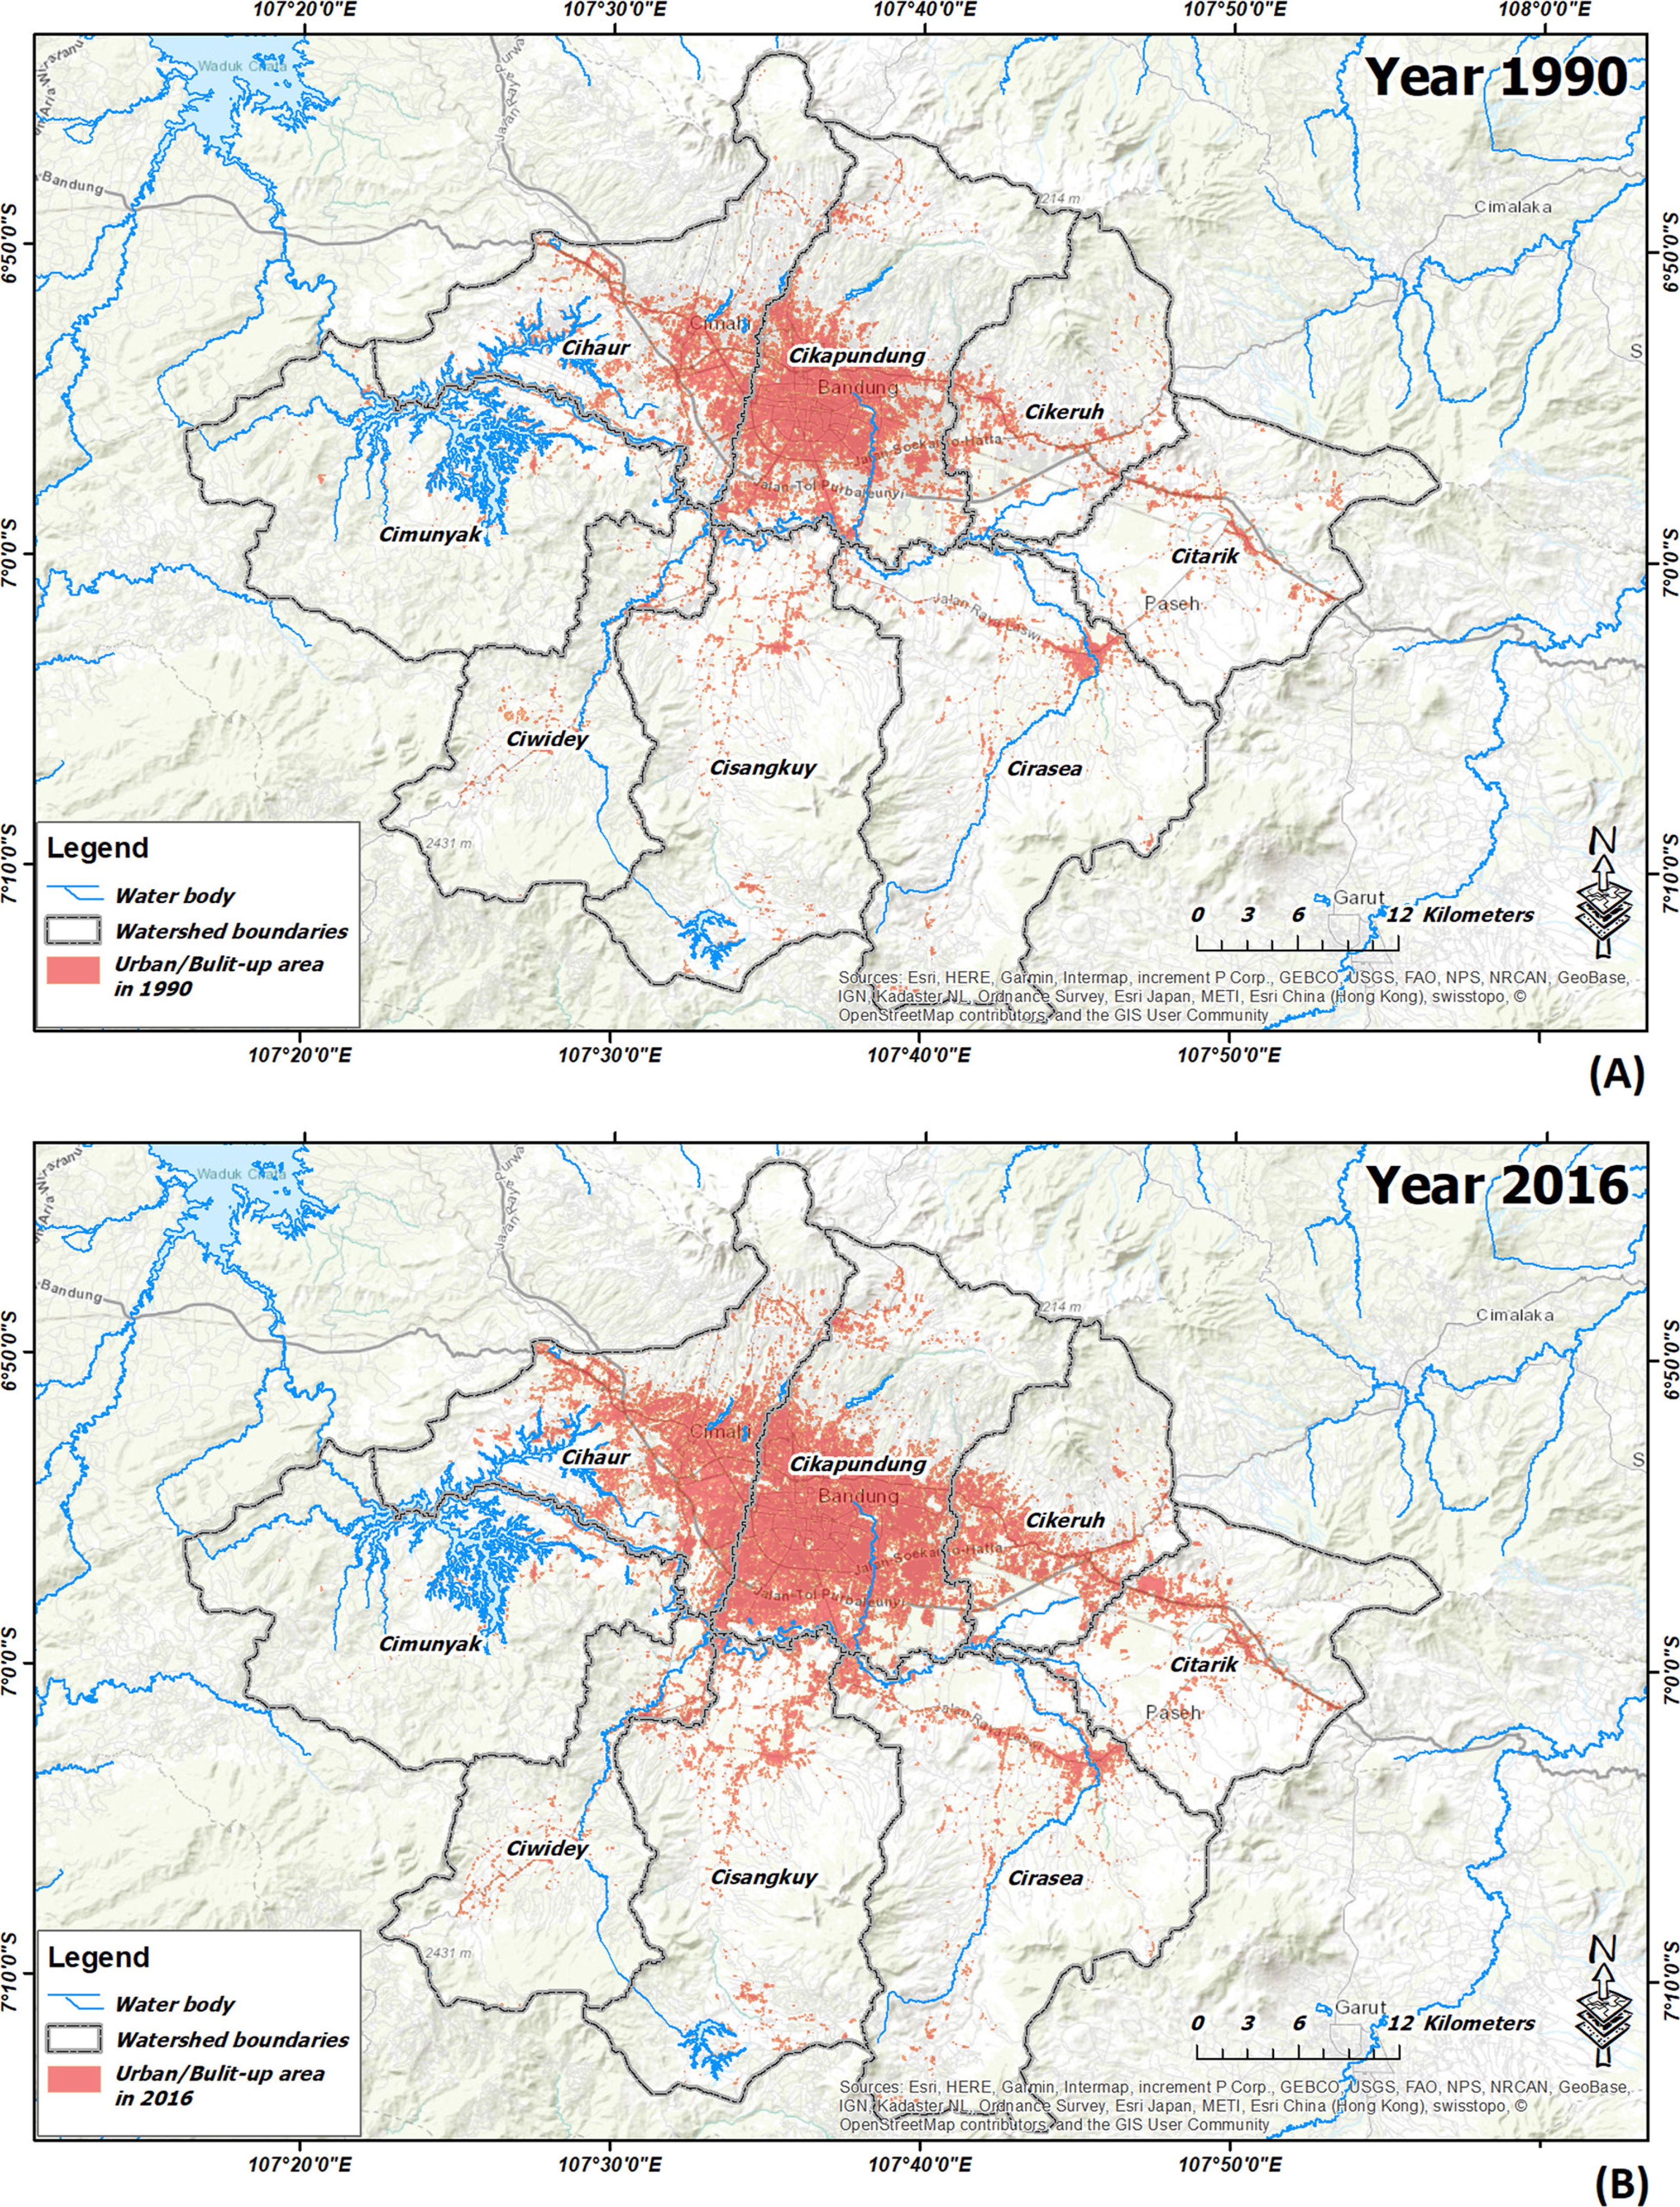
Fig. 6
Distribution of urban/built-up area expansion in the eight sub-watersheds in the study area in 1990 (A) and 2016 (B).
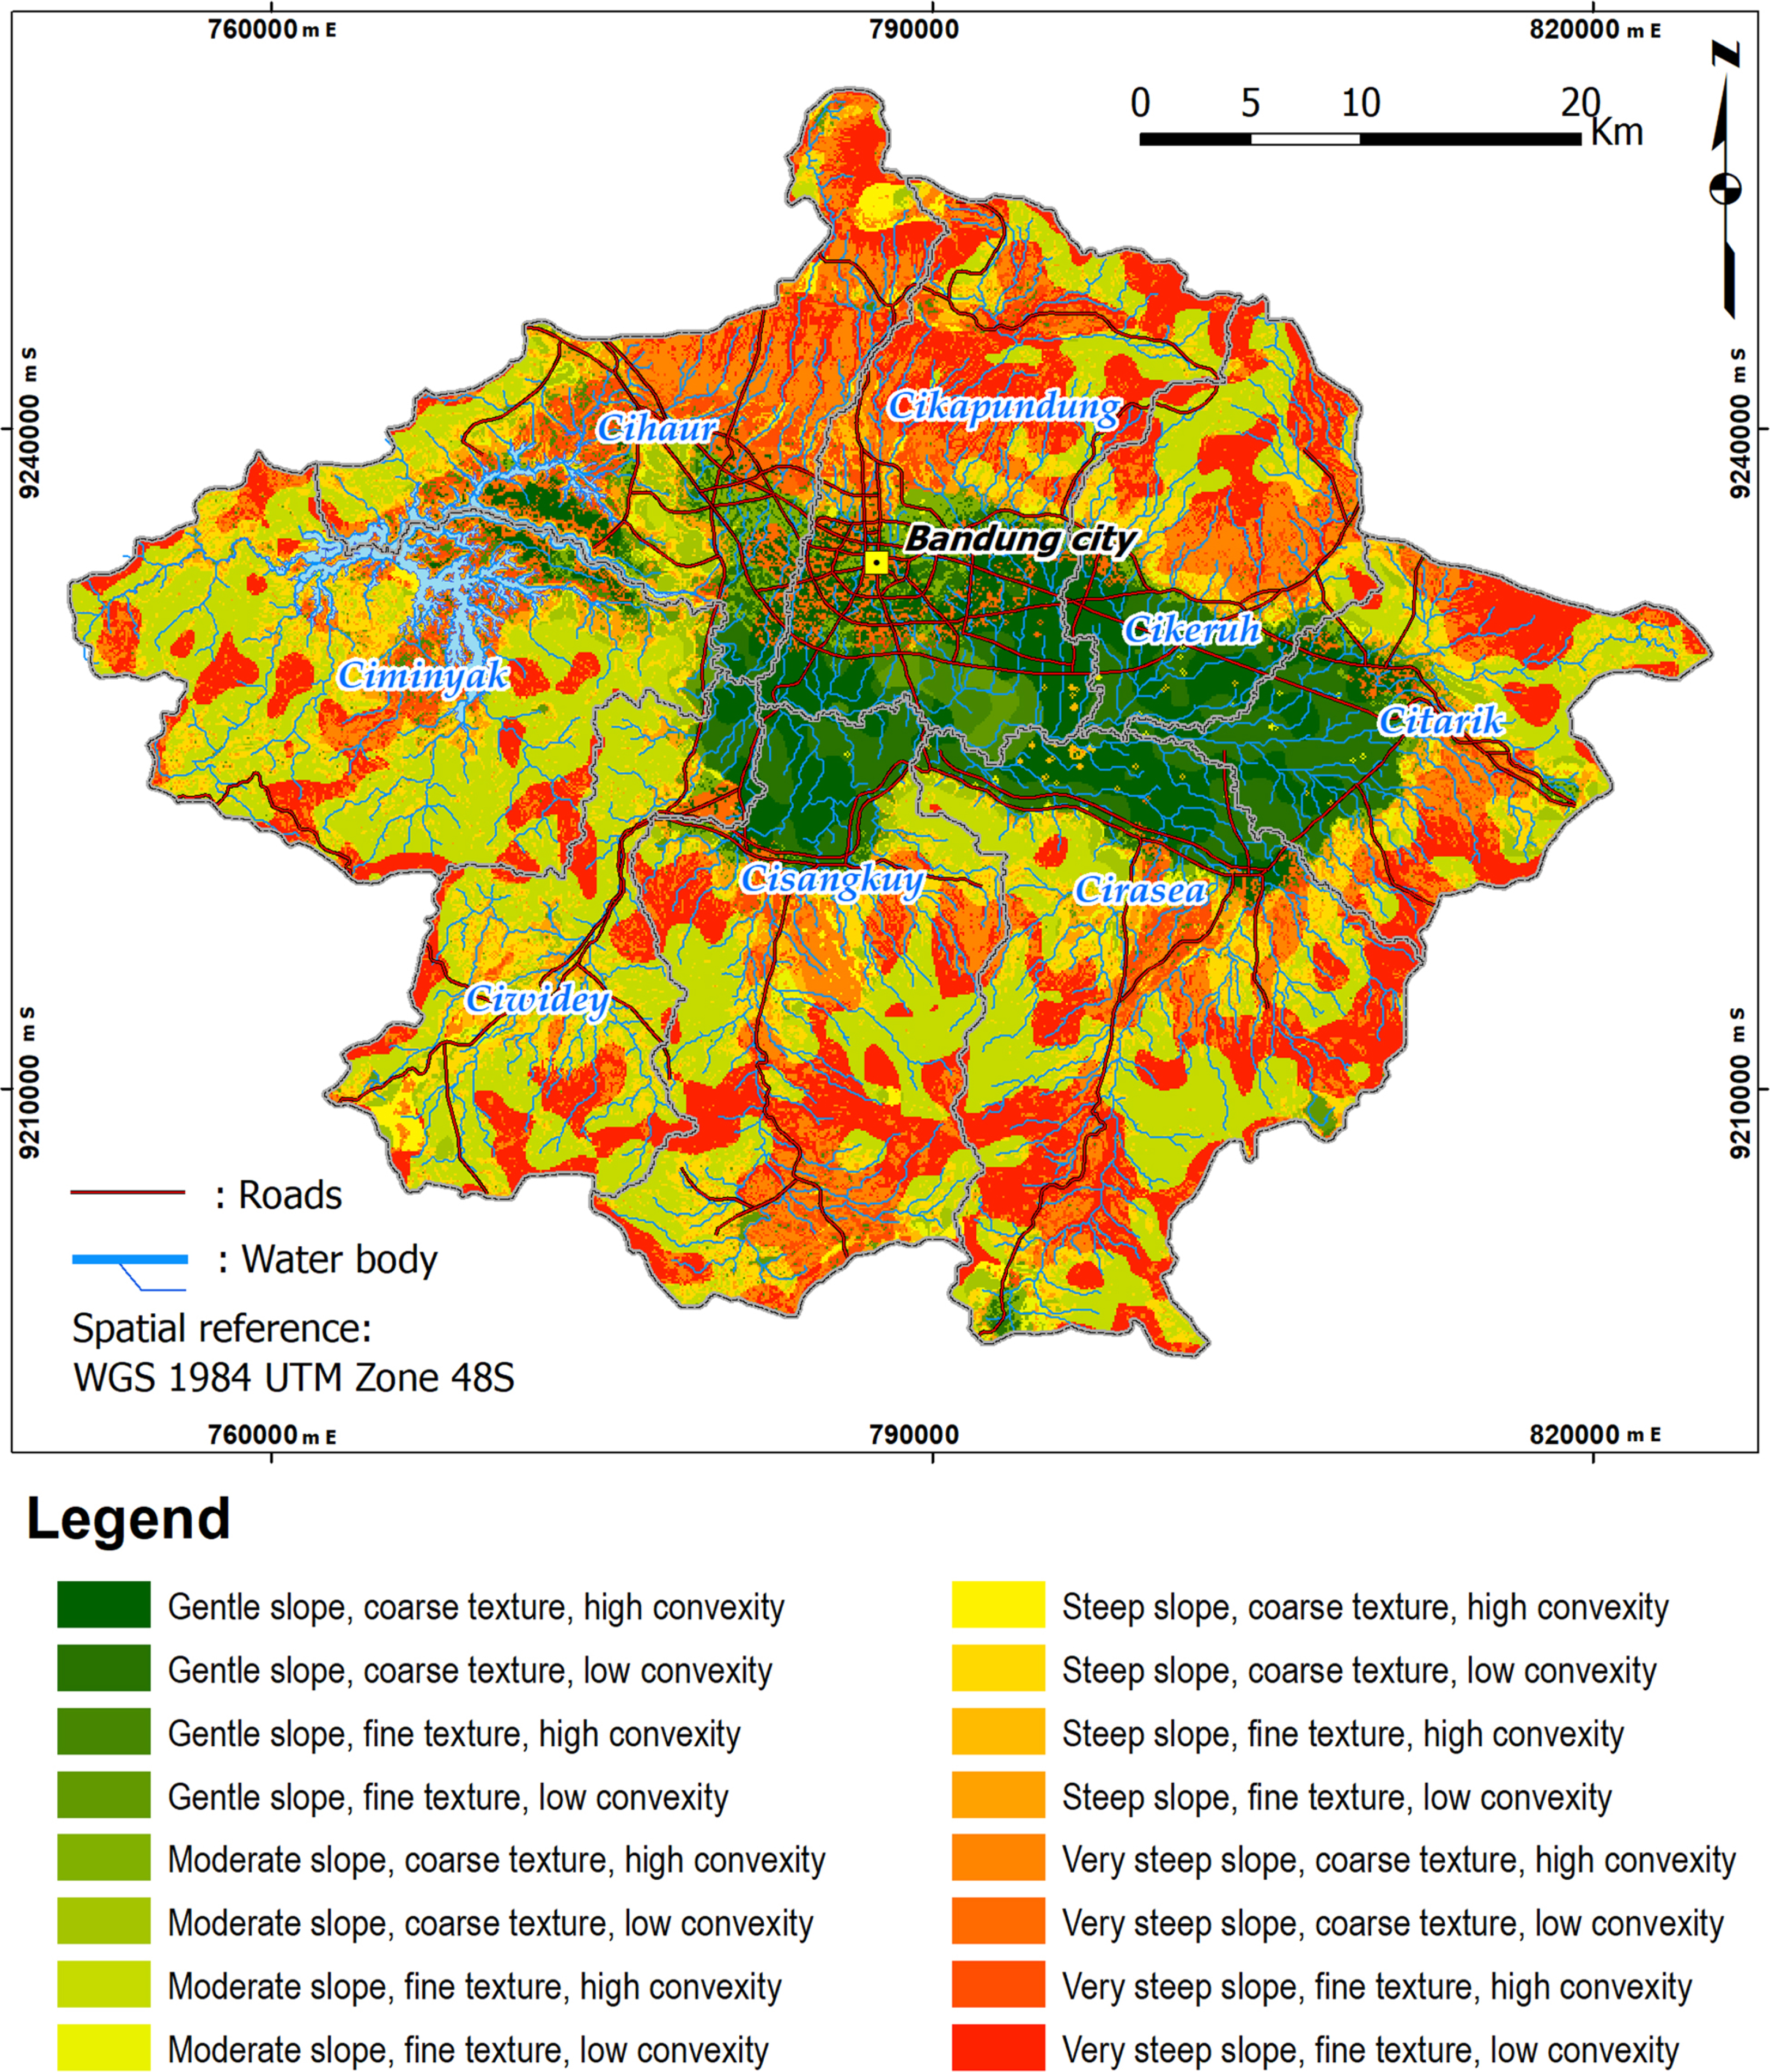
Fig. 7
Results of the terrain surface classification (TSC) as a micro-landform classification in the study area.
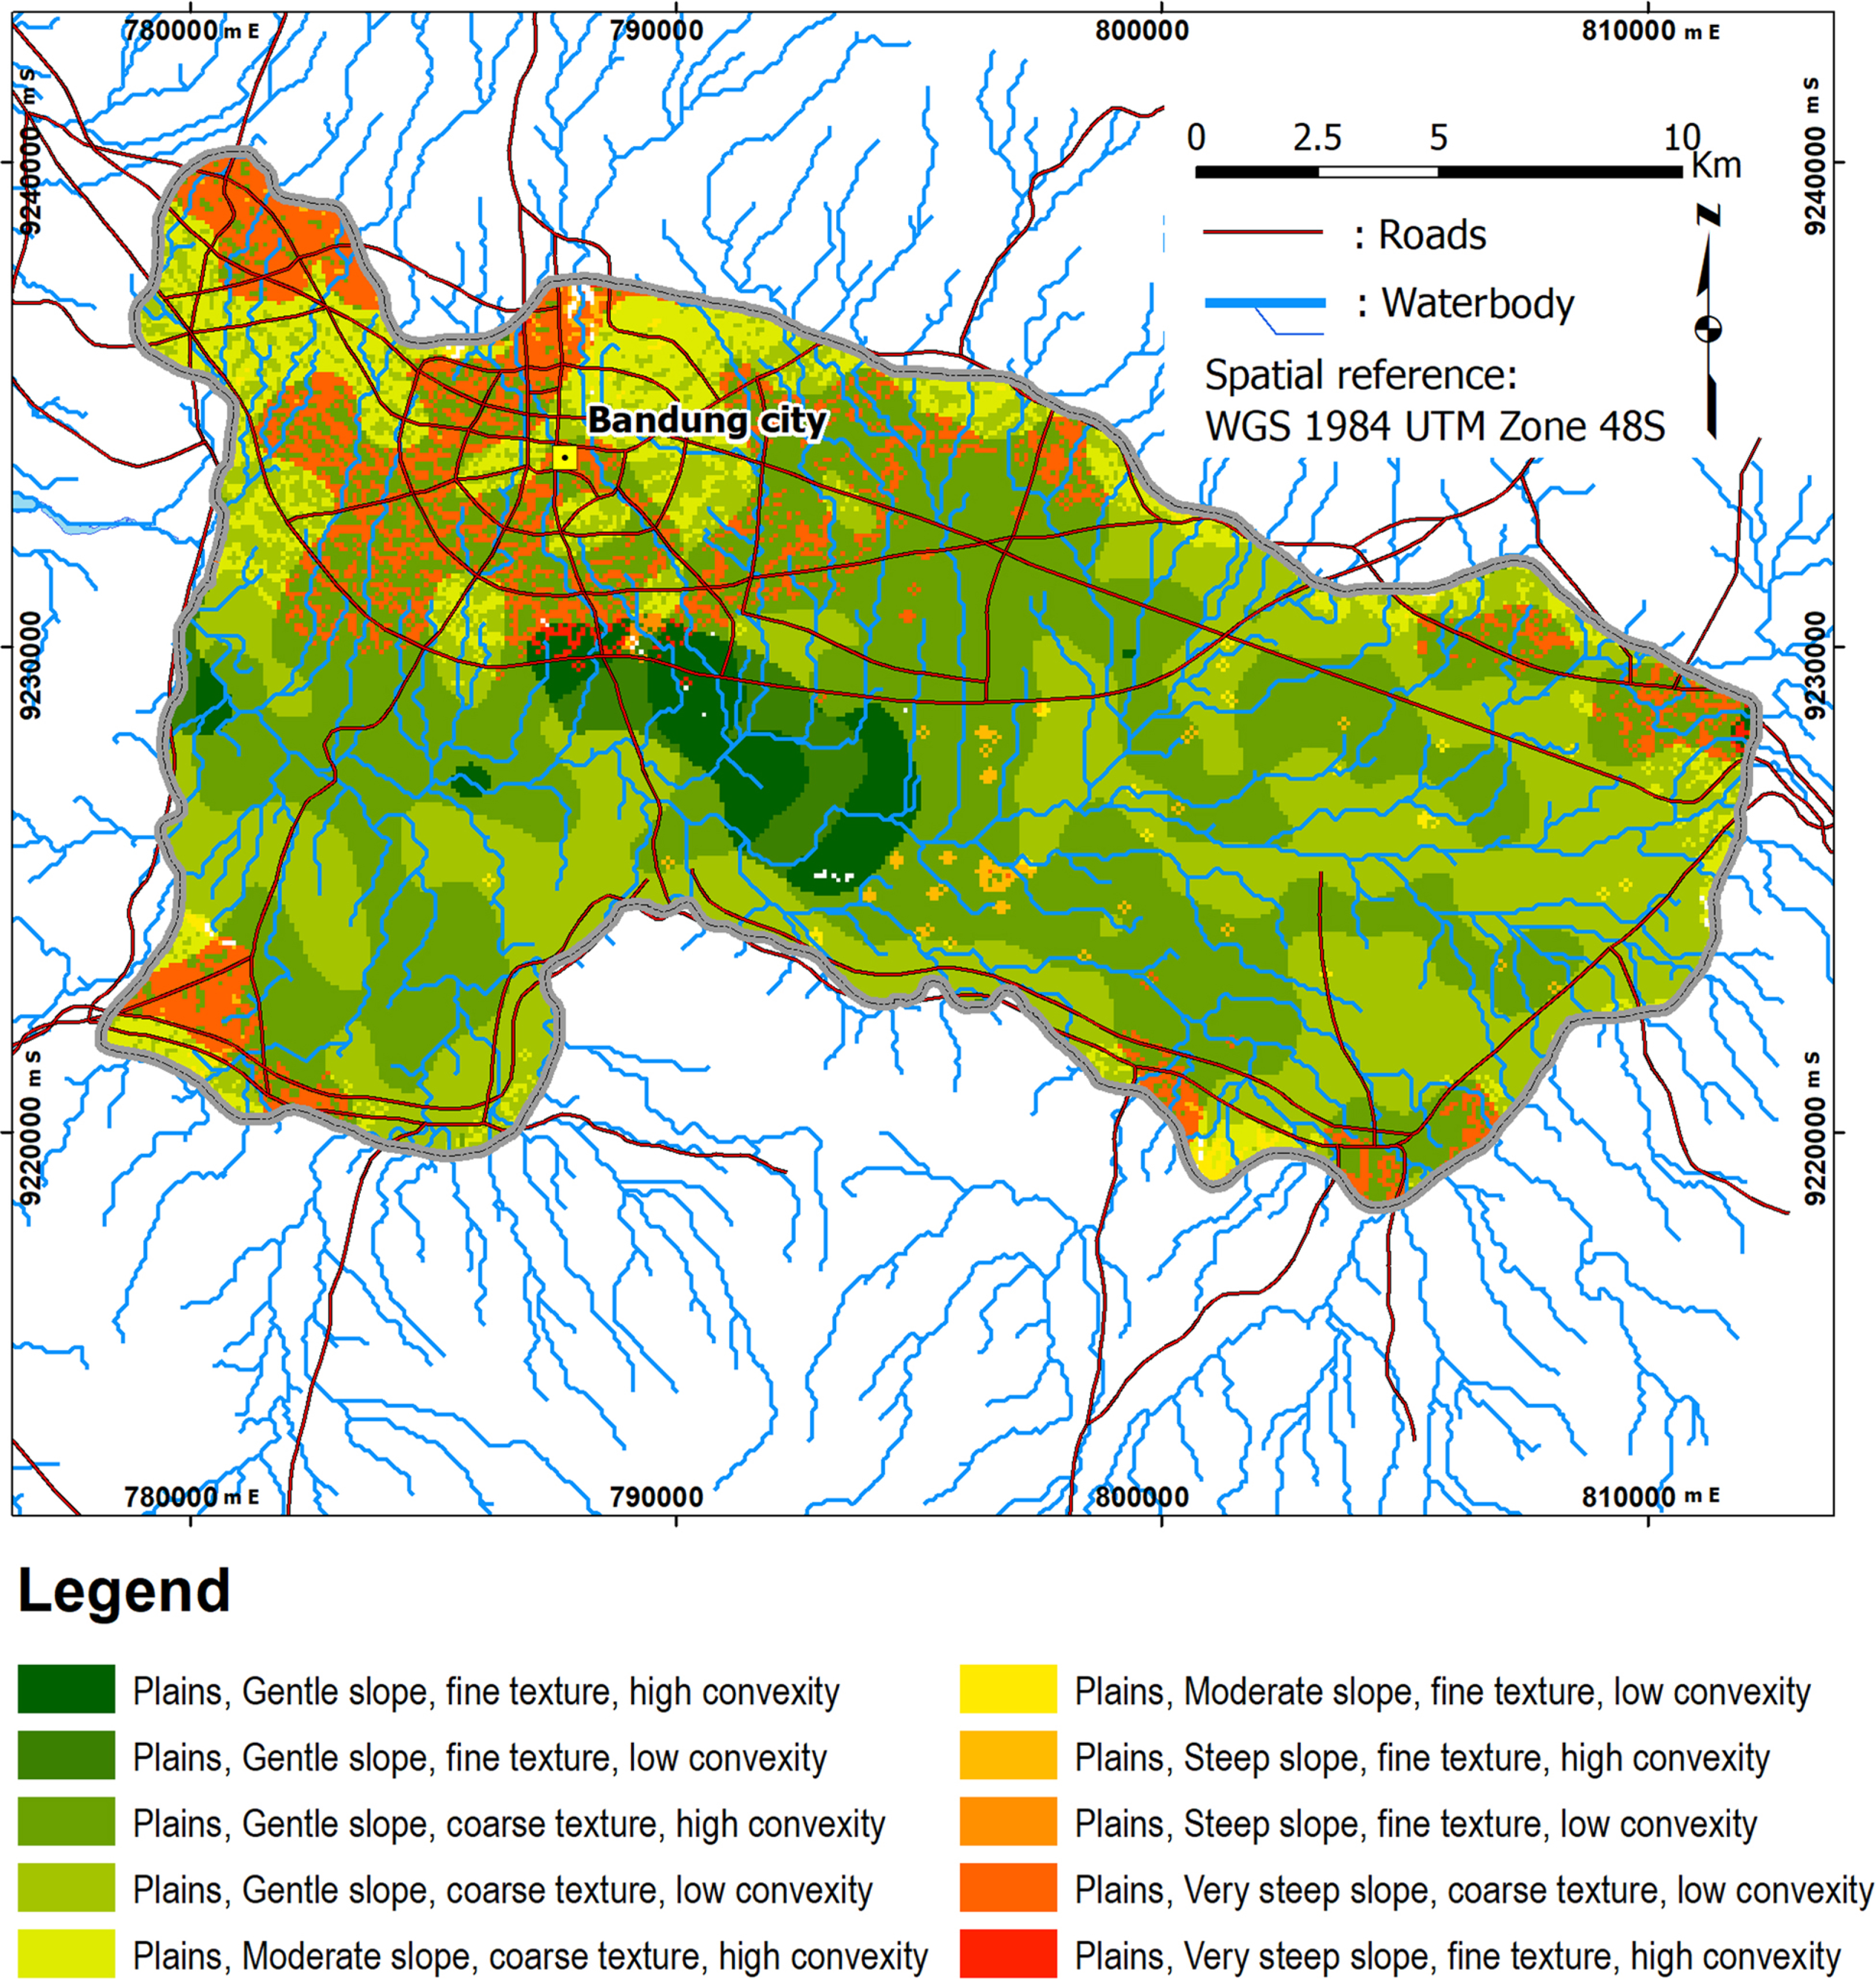
Fig. 8
Micro-landform classification uses the Bandung Basin as a unit area boundary to focus on classifying potential flood areas, which has been combined with information from the Topographic Position Index (TPI) approach by Yulianto et al. (2019).
Table 4
Terrain surface classification (TSC) micro-landform characteristics related to flood conditions in the study area.
| No | Micro-landform classification | Description | Flood hazard class |
|---|---|---|---|
| 1 | Plains, gentle slope, fine texture, high convexity | Plains area with the permissible range less than 9% gradient, dominant positive/concave convexity, fine texture indicates a high proportion of finer particles such as silt and clay. Depth of flooding in excess of 5 m | Very high flood hazard 1 |
| 2 | Plains, gentle slope, fine texture, low convexity | Plains area with the permissible range less than 9% gradient, dominant negative/concave convexity, fine texture indicates a high proportion of finer particles such as silt and clay. Depth of flooding 4–5 m. | Very high flood hazard 2 |
| 3 | Plains, gentle slope, coarse texture, high convexity | Plains area with the permissible range less than 9% gradient, dominant positive/concave convexity, coarse texture indicates a high proportion of sand. Depth of flooding 3–4 m. | High flood hazard 1 |
| 4 | Plains, gentle slope, coarse texture, low convexity | Plains area with the permissible range less than 9% gradient, dominant negative/concave convexity, coarse texture indicates a high proportion of sand. Depth of flooding 2–3 m. | High flood hazard 2 |
| 5 | Open slopes, moderate slope, coarse texture, high convexity | Open slope area with a gradient of slope between 10 and 15%, dominant positive/concave convexity, coarse texture indicates a high proportion of sand. Depth of flooding 1–2 m. | Moderate flood hazard 1 |
| 6 | Open slopes, moderate slope, fine texture, low convexity | Open slope area with a gradient of slope between 10 and 15%, dominant negative/concave convexity, fine texture indicates a high proportion of finer particles such as silt and clay. Depth of flooding 1–2 m. | Moderate flood hazard 2 |
| 7 | Upper slopes, steep slope, fine texture, high convexity | Upper slopes area with a gradient of slope between 16 and 30%, dominant positive/concave convexity, fine texture indicates a high proportion of finer particles such as silt and clay. Depth of flooding 0.5–1 m. | Low flood hazard 1 |
| 8 | Upper slopes, steep slope, fine texture, low convexity | Upper slopes area with a gradient of slope between 16 and 30%, dominant negative/concave convexity, fine texture indicates a high proportion of finer particles such as silt and clay. Flood depth less than 0.5 m. | Low flood hazard 2 |
| 9 | Upper slopes, very steep slope, fine texture, high convexity | Upper slopes area with a gradient of slope between 31 and 60%, and > 60%, dominant positive/concave convexity, fine texture indicates a high proportion of finer particles such as silt and clay. | No flood hazard 1 |
| 10 | Upper slopes, very steep slope, coarse texture, low convexity | Upper slopes area with a gradient of slope between 31 and 60%, and > 60%, dominant negative/concave convexity, coarse texture indicates a high proportion of sand. | No flood hazard 2 |
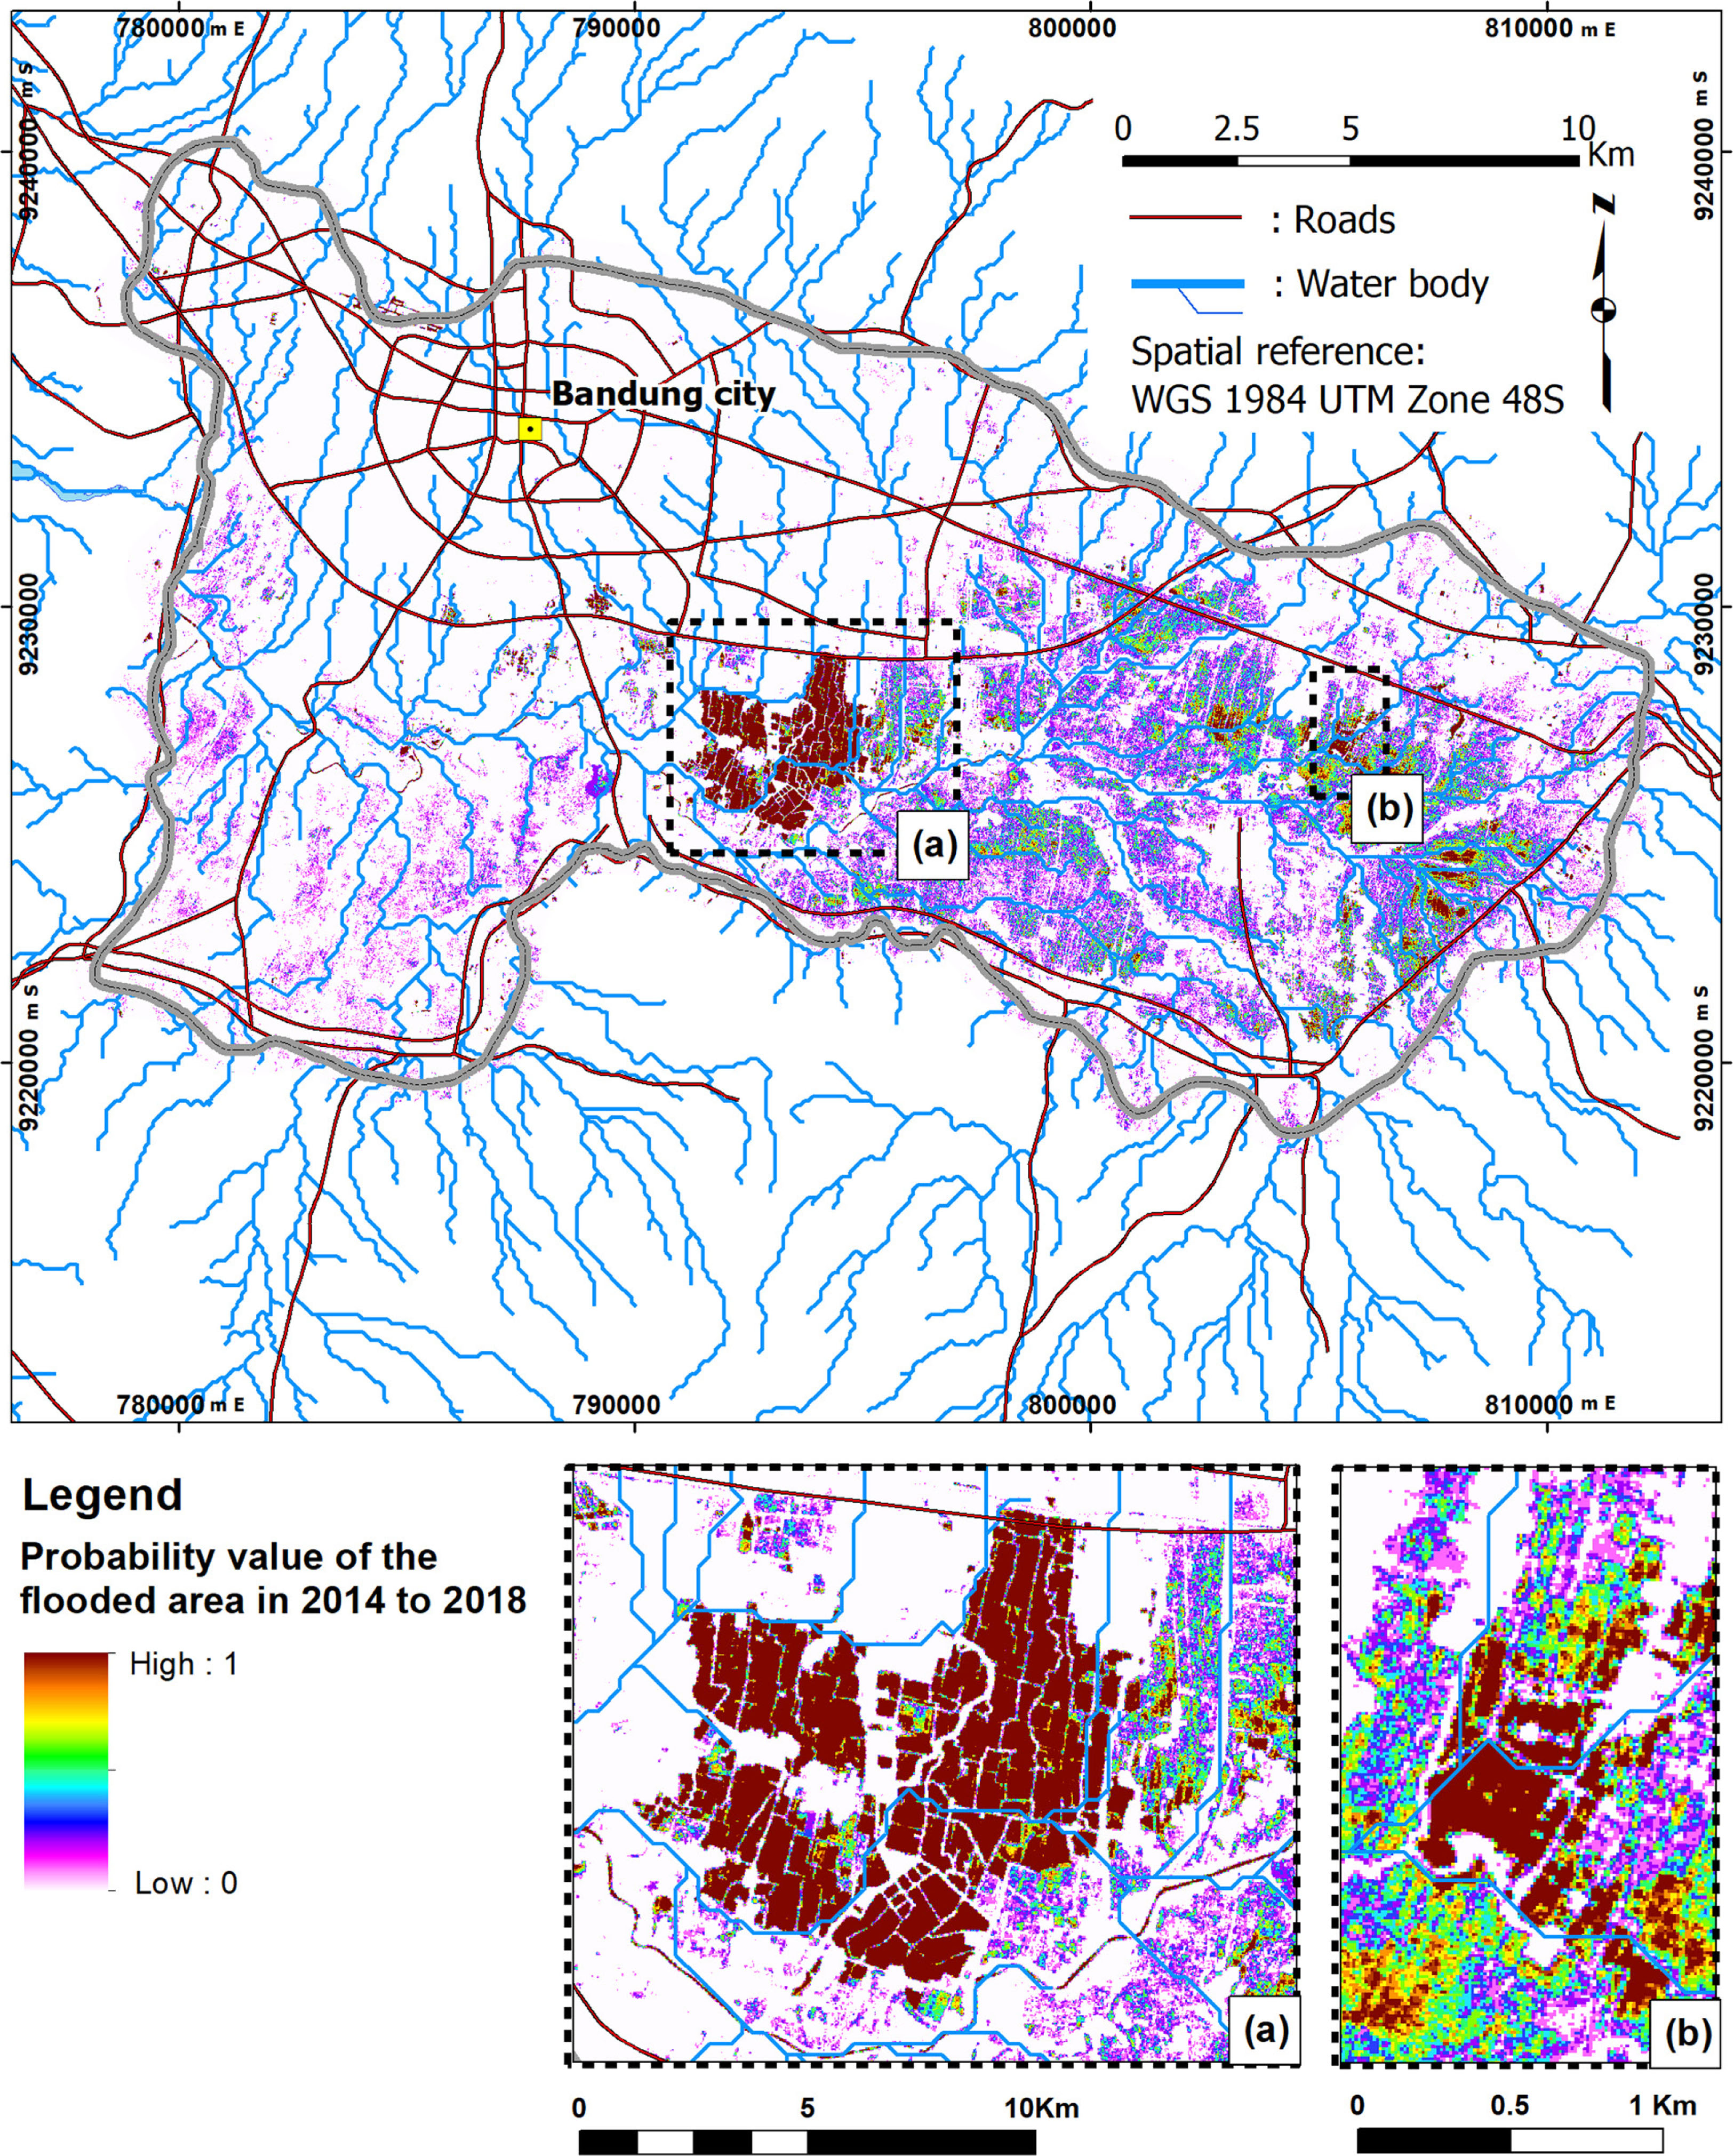
Fig. 9
Probability map for flood inundation from 2014 to 2018 in the study area.
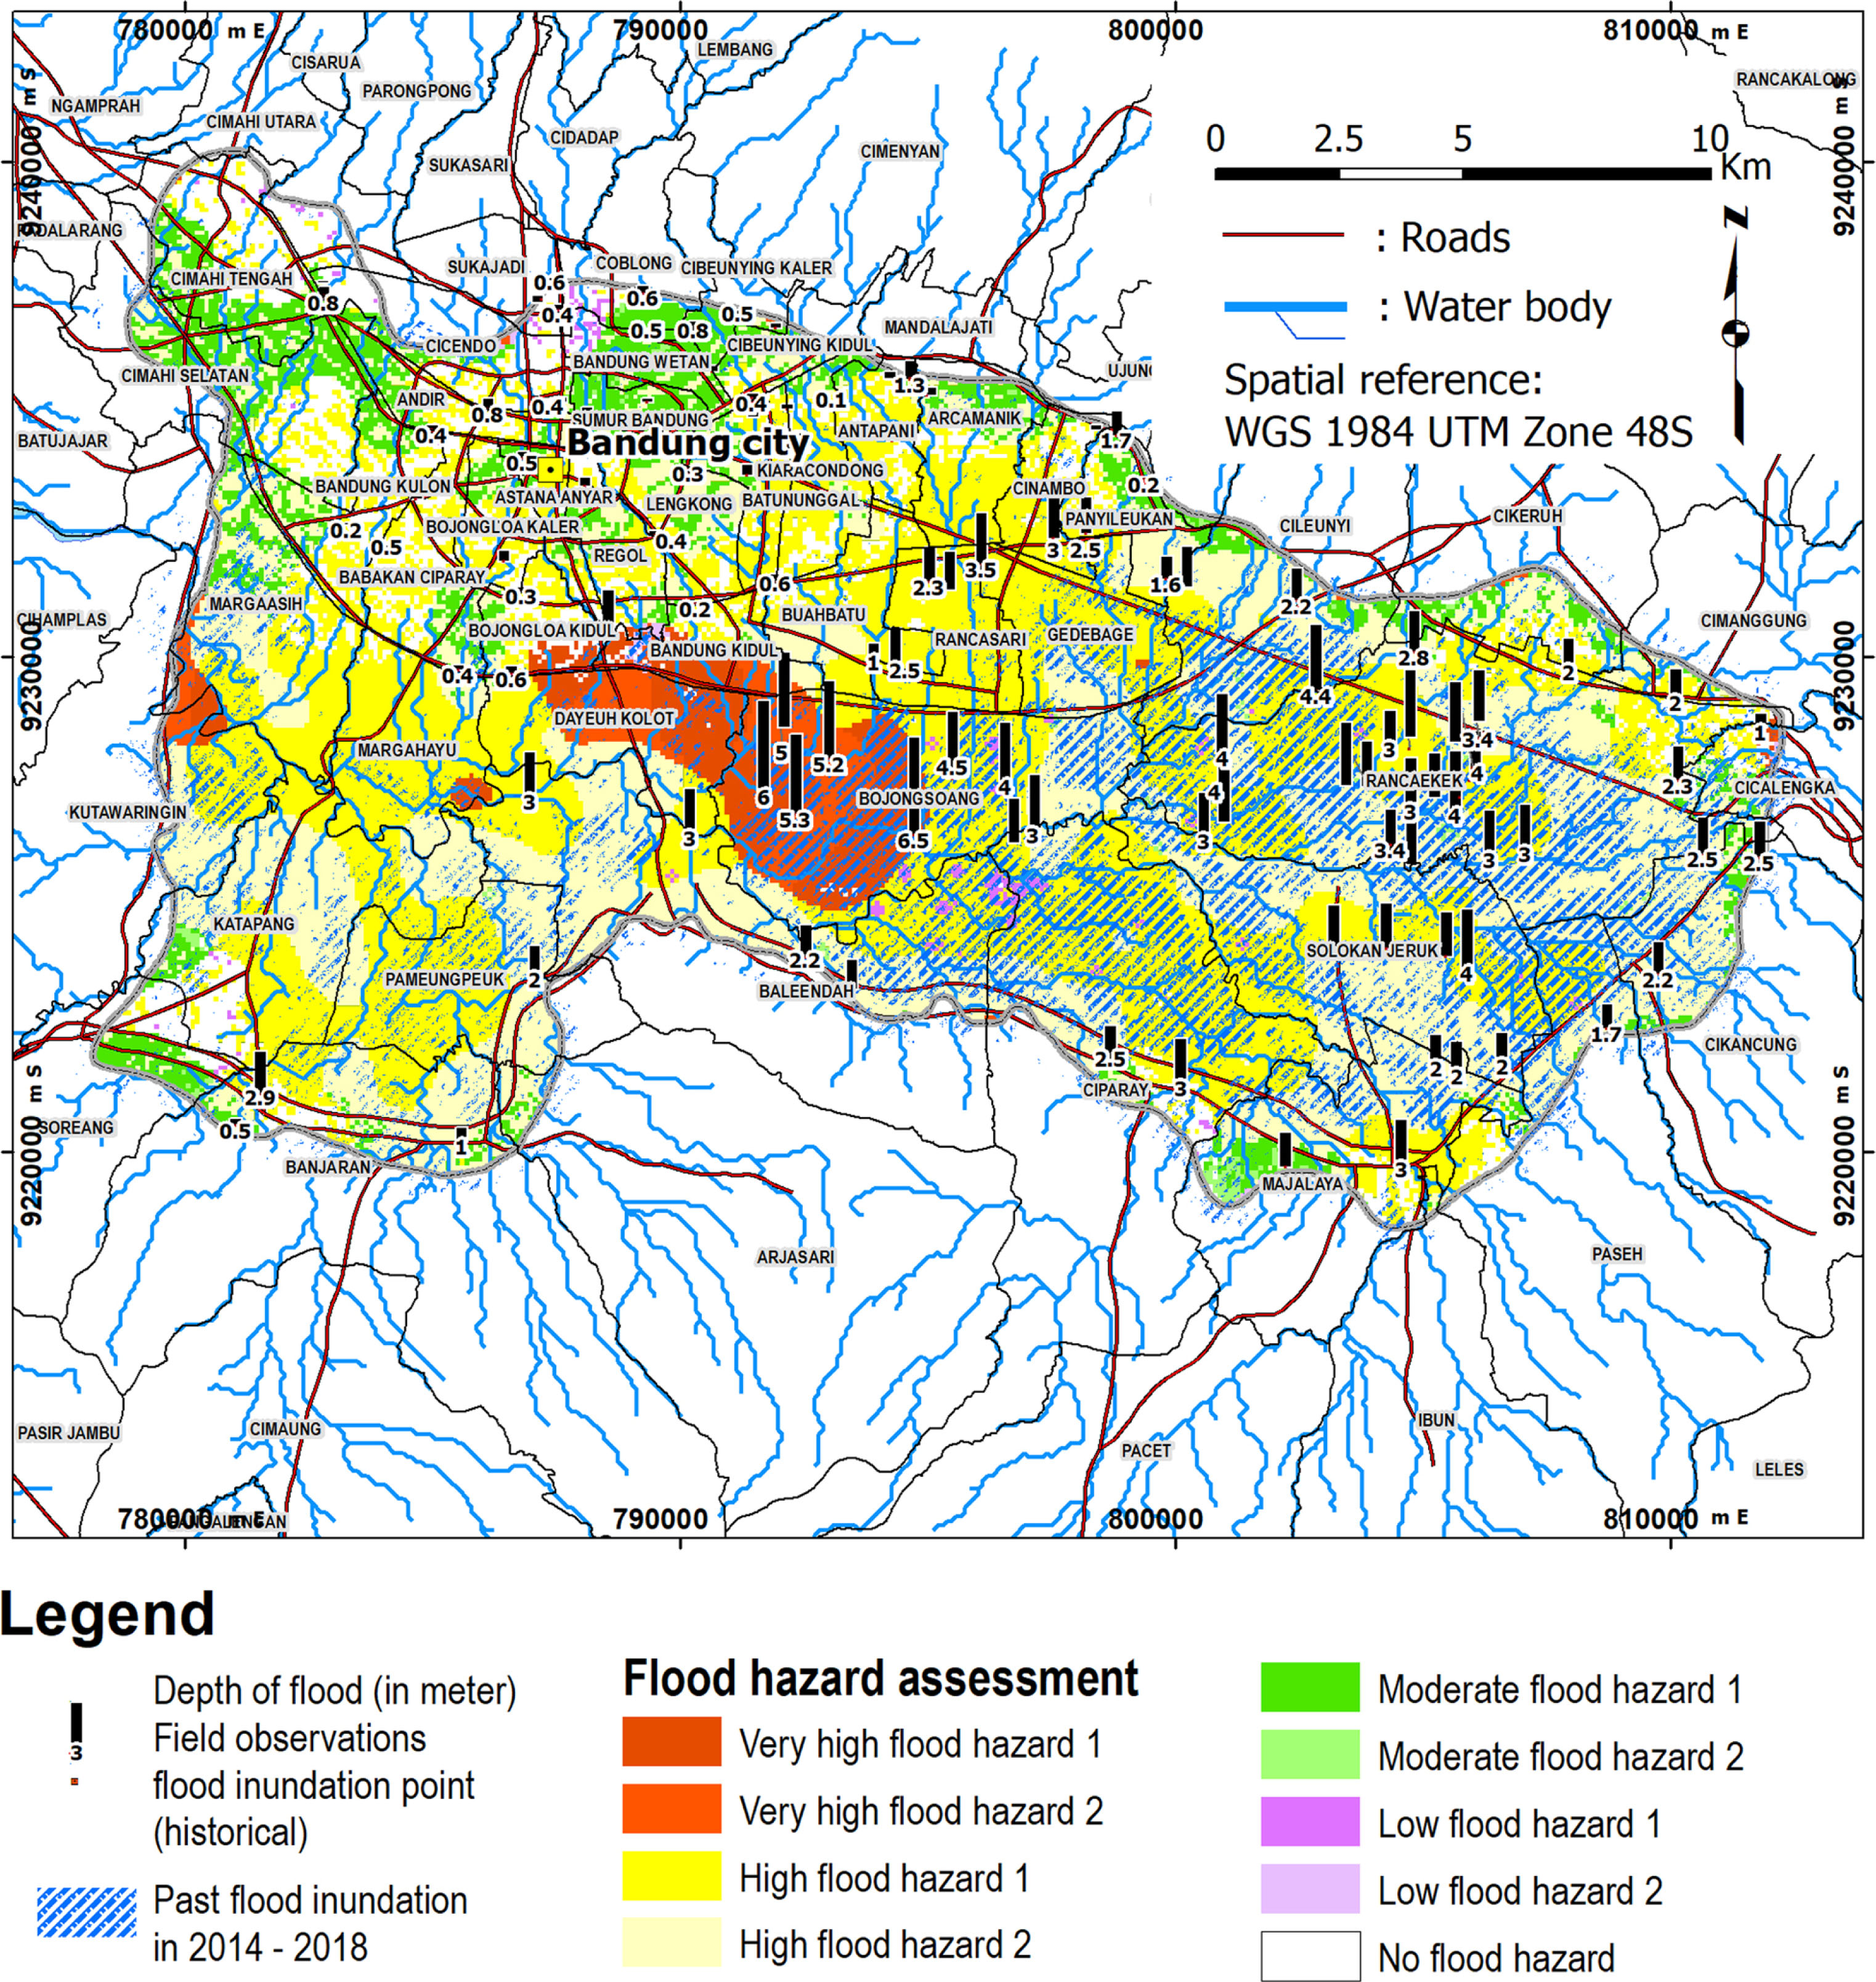
Fig. 10
The result of flood hazard assessment and mapping based on the integration of TSC as a micro-landform classification approach, probability map for flood inundation and flood depths from field observation.
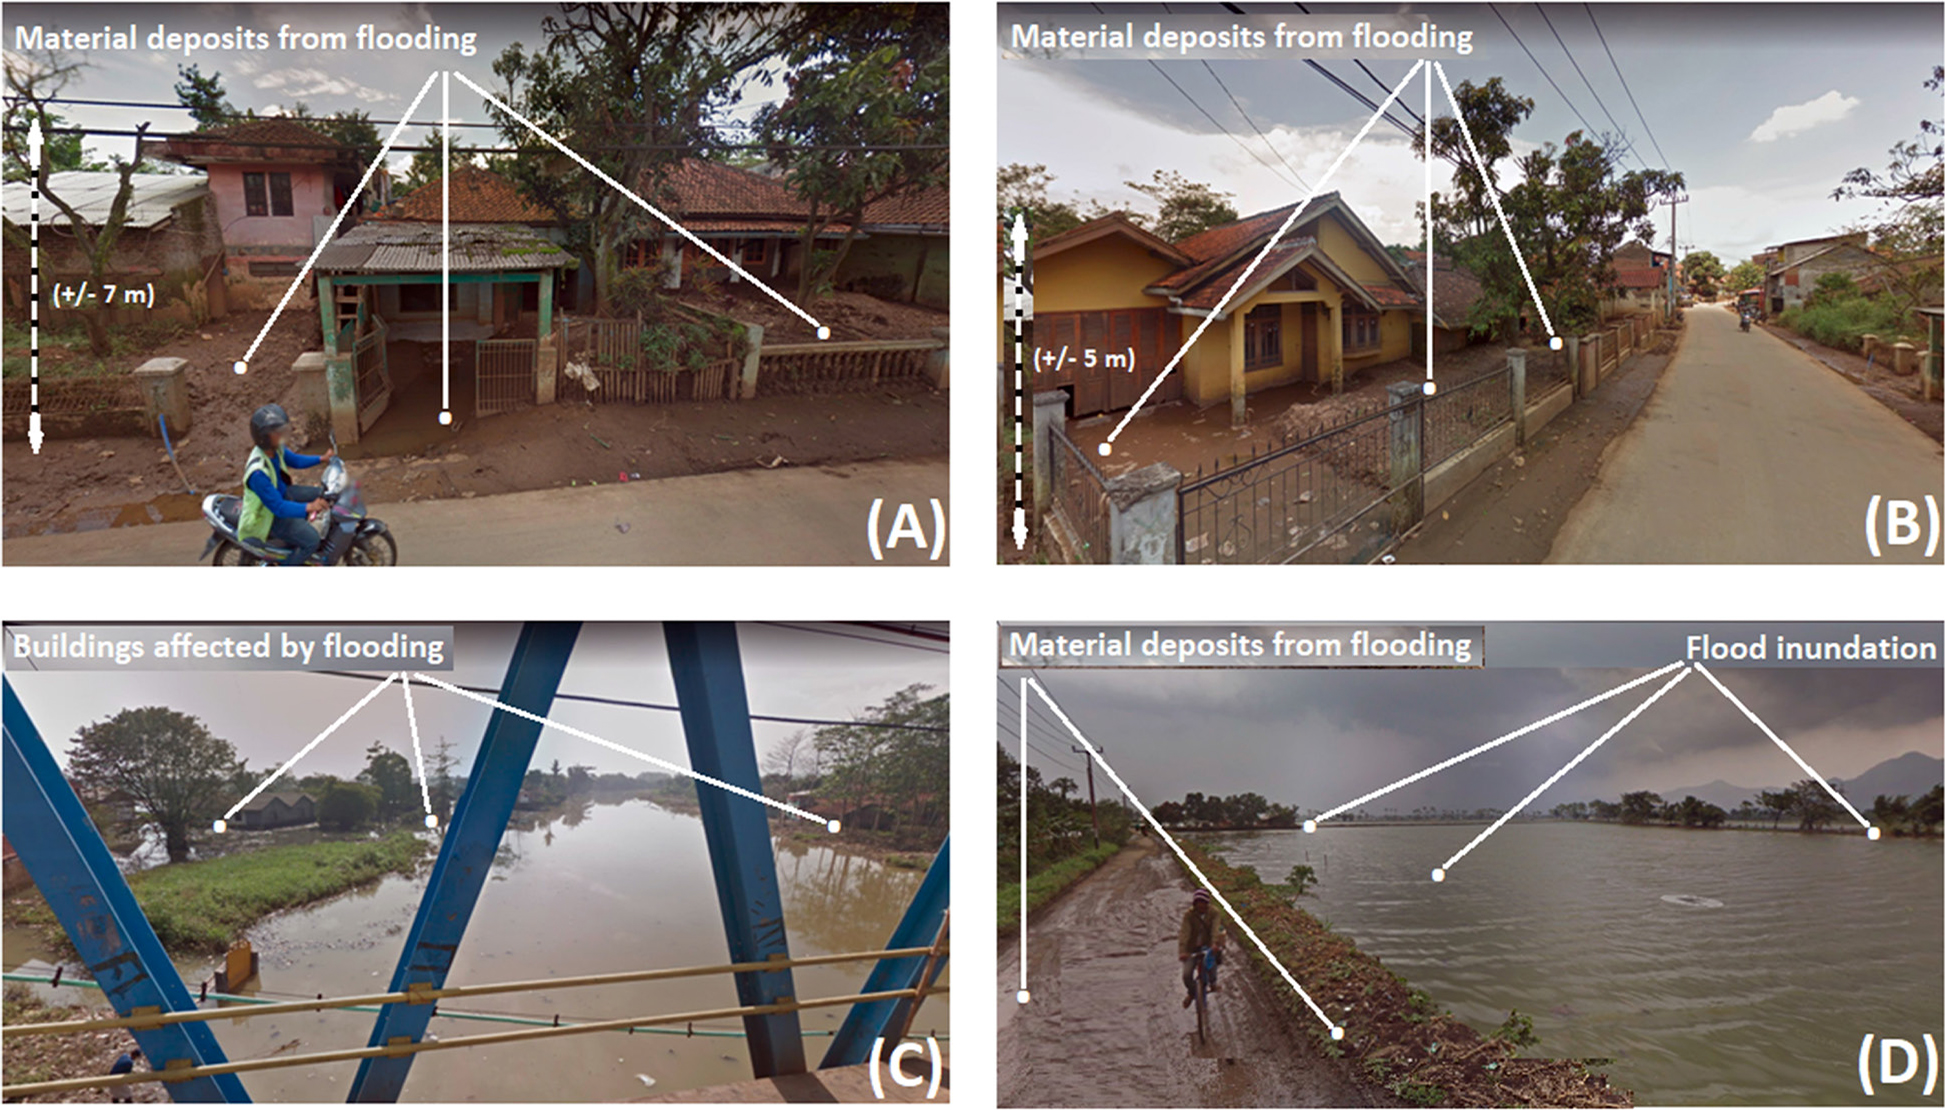
Fig. 11
Areas affected by flooding.
A, B – a very high flood hazard area in Baleendah, with TSC class of plains, gentle slope, fine texture, high convexity and a flood depth of more than 5 m. C – a high flood hazard area in Bojongsoang, with TSC class of plains, gentle slope, coarse texture, high convexity and a flood depth of 2–4 m. D – a moderate flood hazard area in Cibiroso, with TSC class of open slopes, moderate slope, coarse texture, high convexity and a flood depth of 1–2 m.