
Table 1
Population dynamics in small towns between 1970 and 2014.
| Population dynamics (base year = 100) | 1970–2014 | 1970–1978 | 1978–1988 | 1988–2002 | 2002–2014 |
|---|---|---|---|---|---|
| 102 and more | 544 | 482 | 570 | 370 | 179 |
| 98–102 | 20 | 83 | 33 | 135 | 190 |
| over 98 | 73 | 72 | 34 | 132 | 268 |
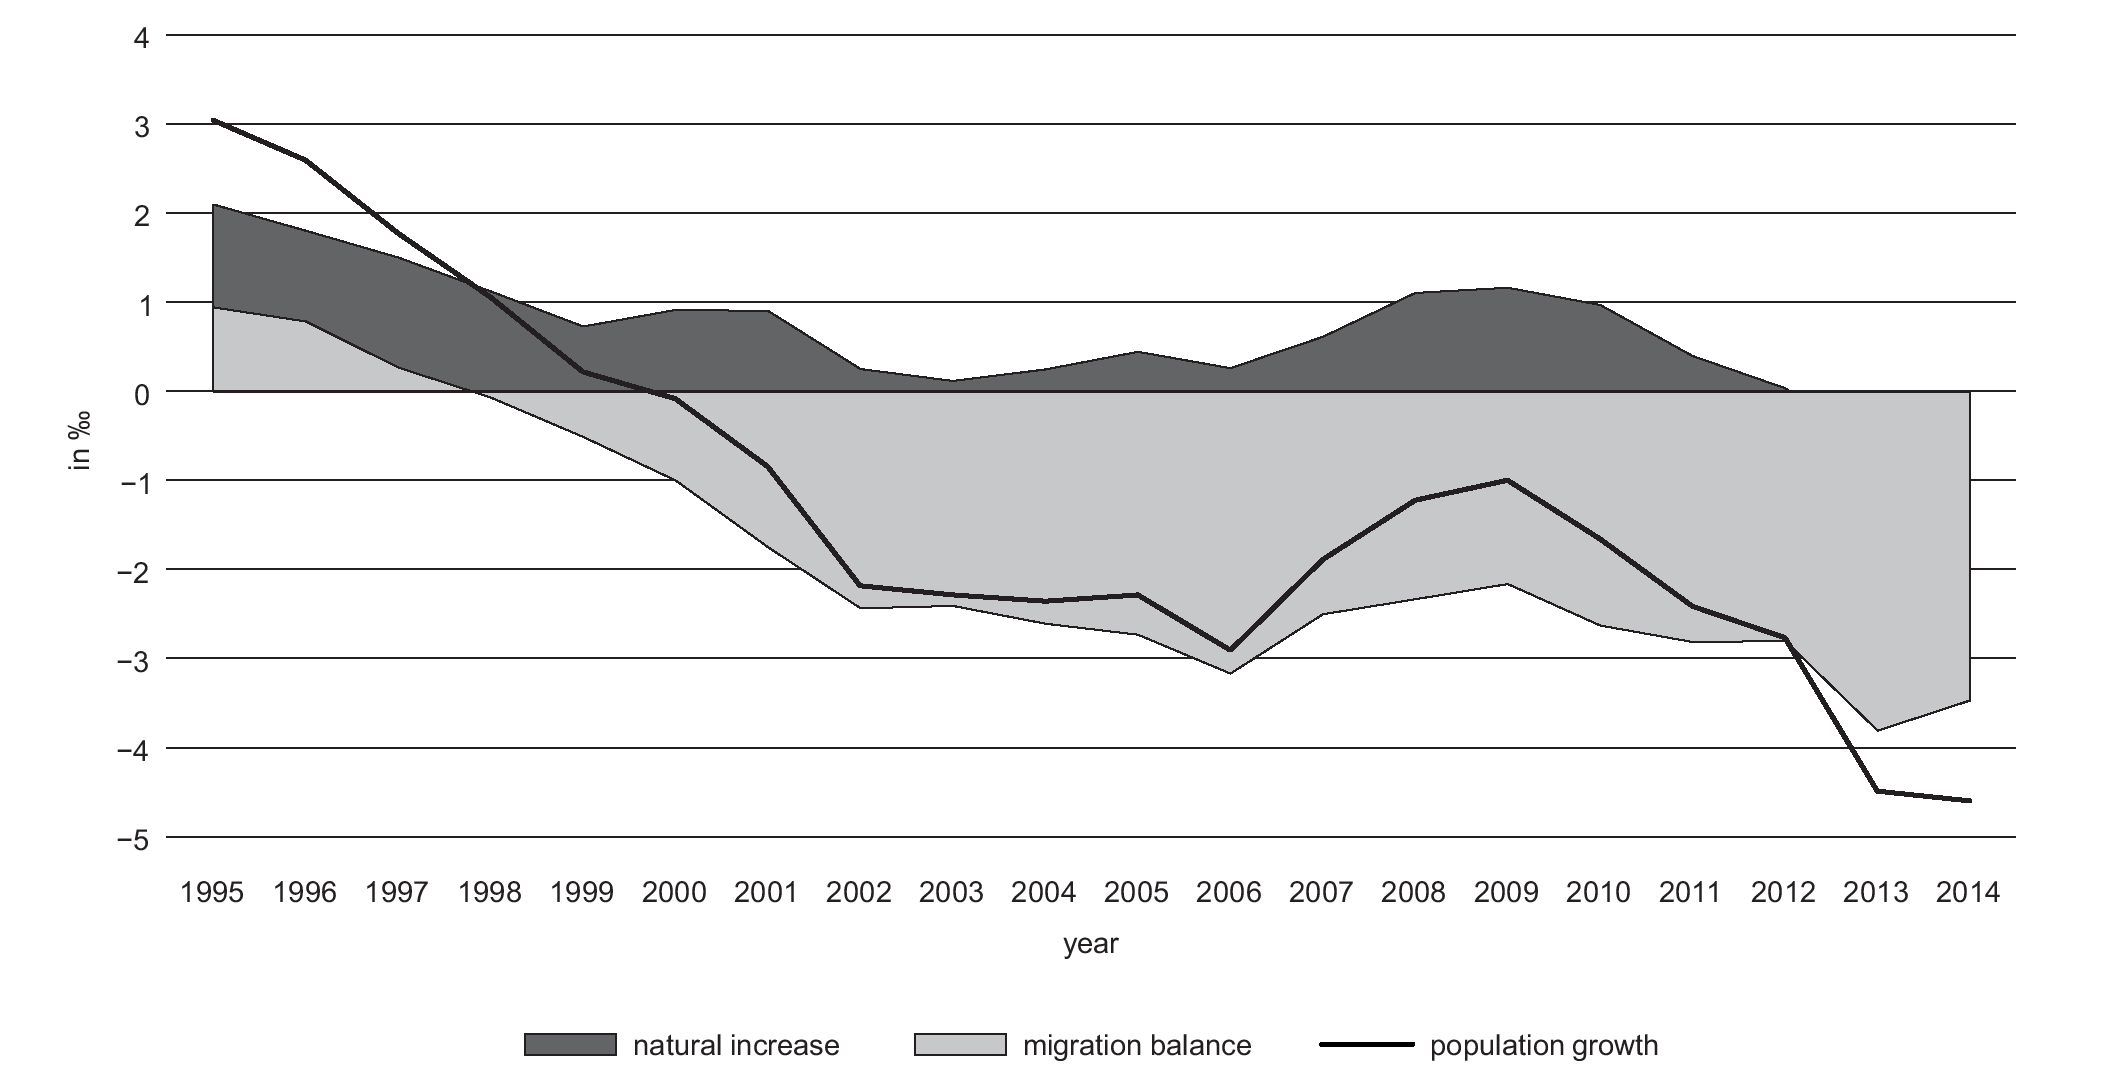
Fig. 1
Population growth in small towns and its components.
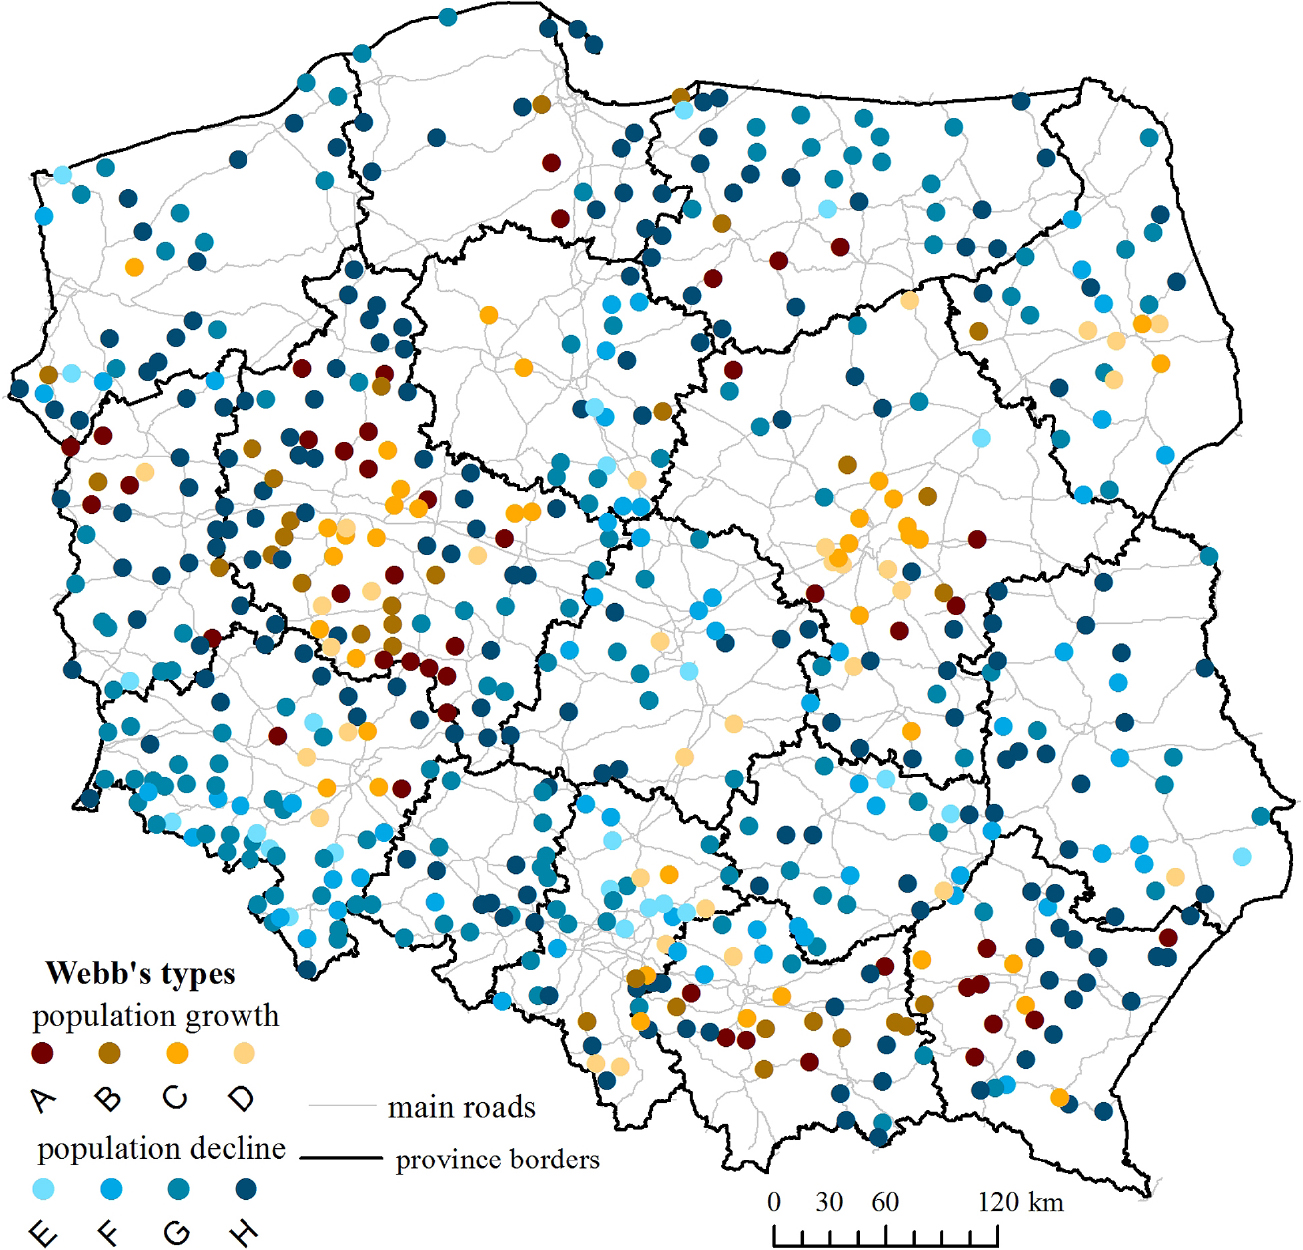
Fig. 2
Demographic types of population according to Webb in small towns in Poland between 2002 and 2014.
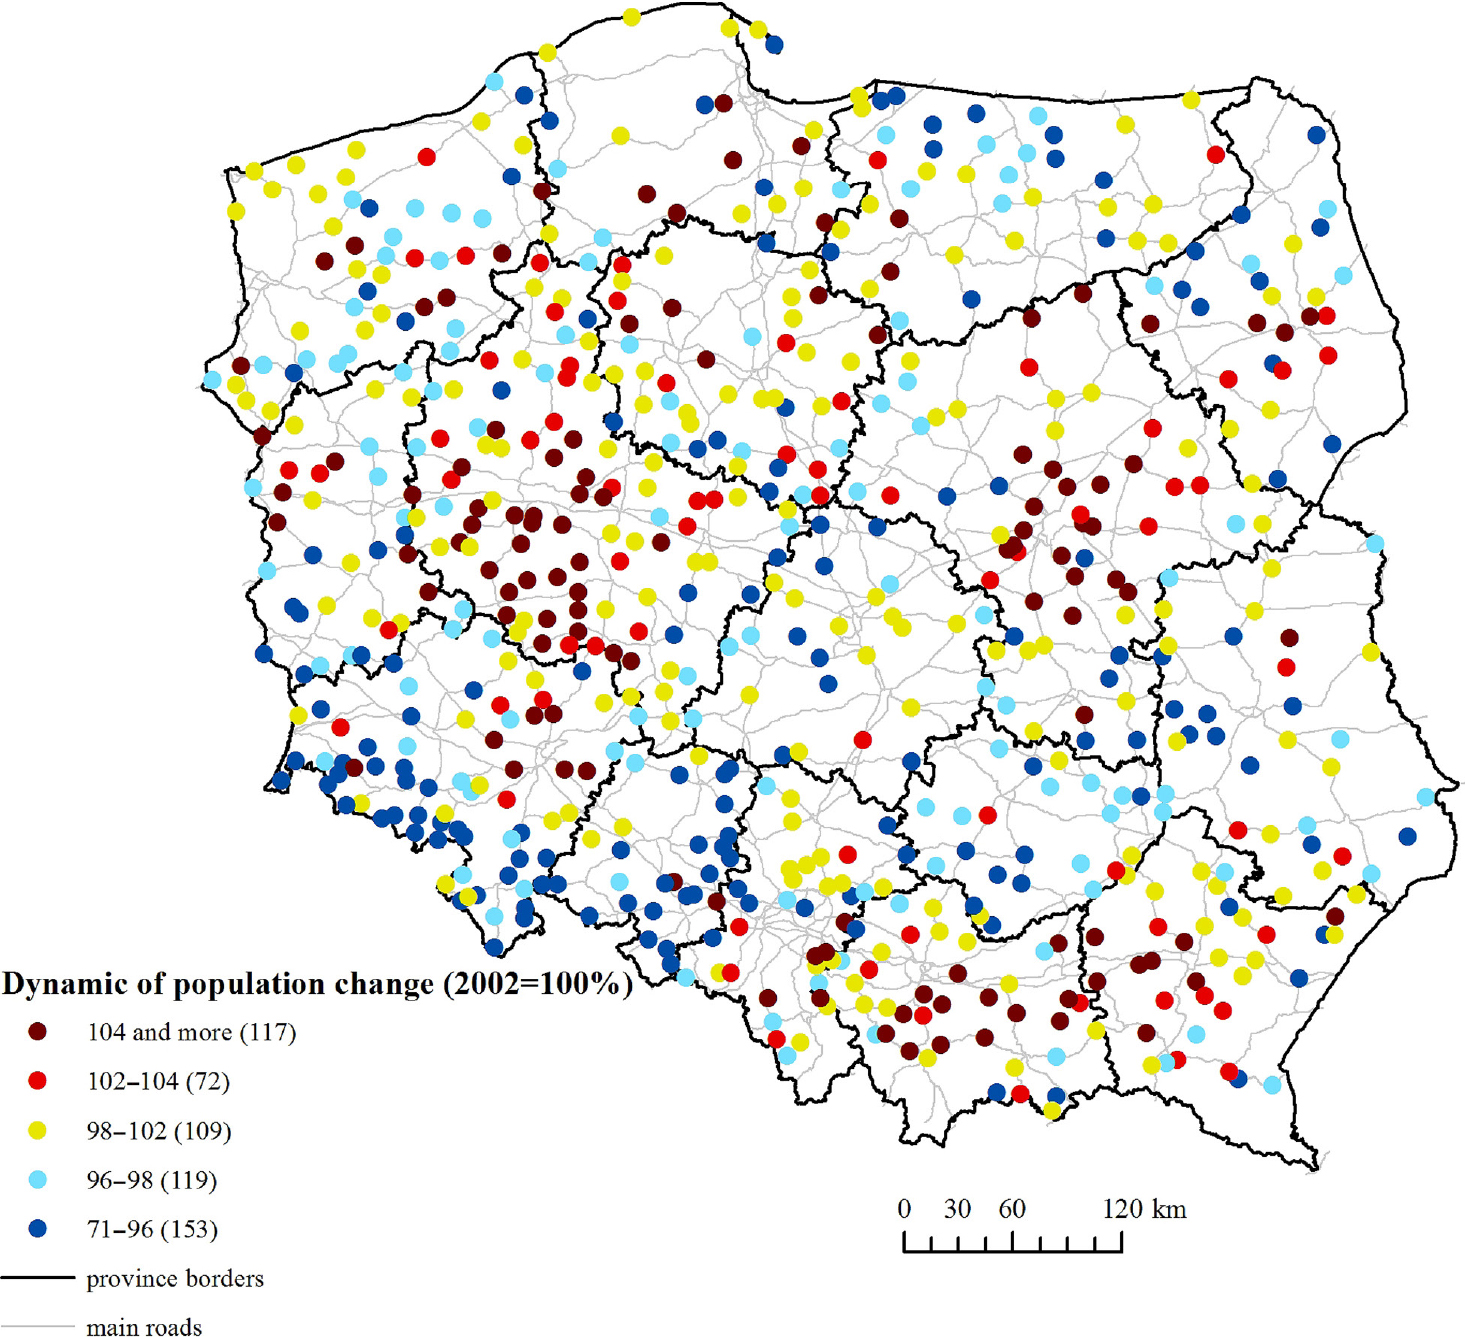
Fig. 3
Population dynamics in small towns between 2002 and 2014 (2002=100).
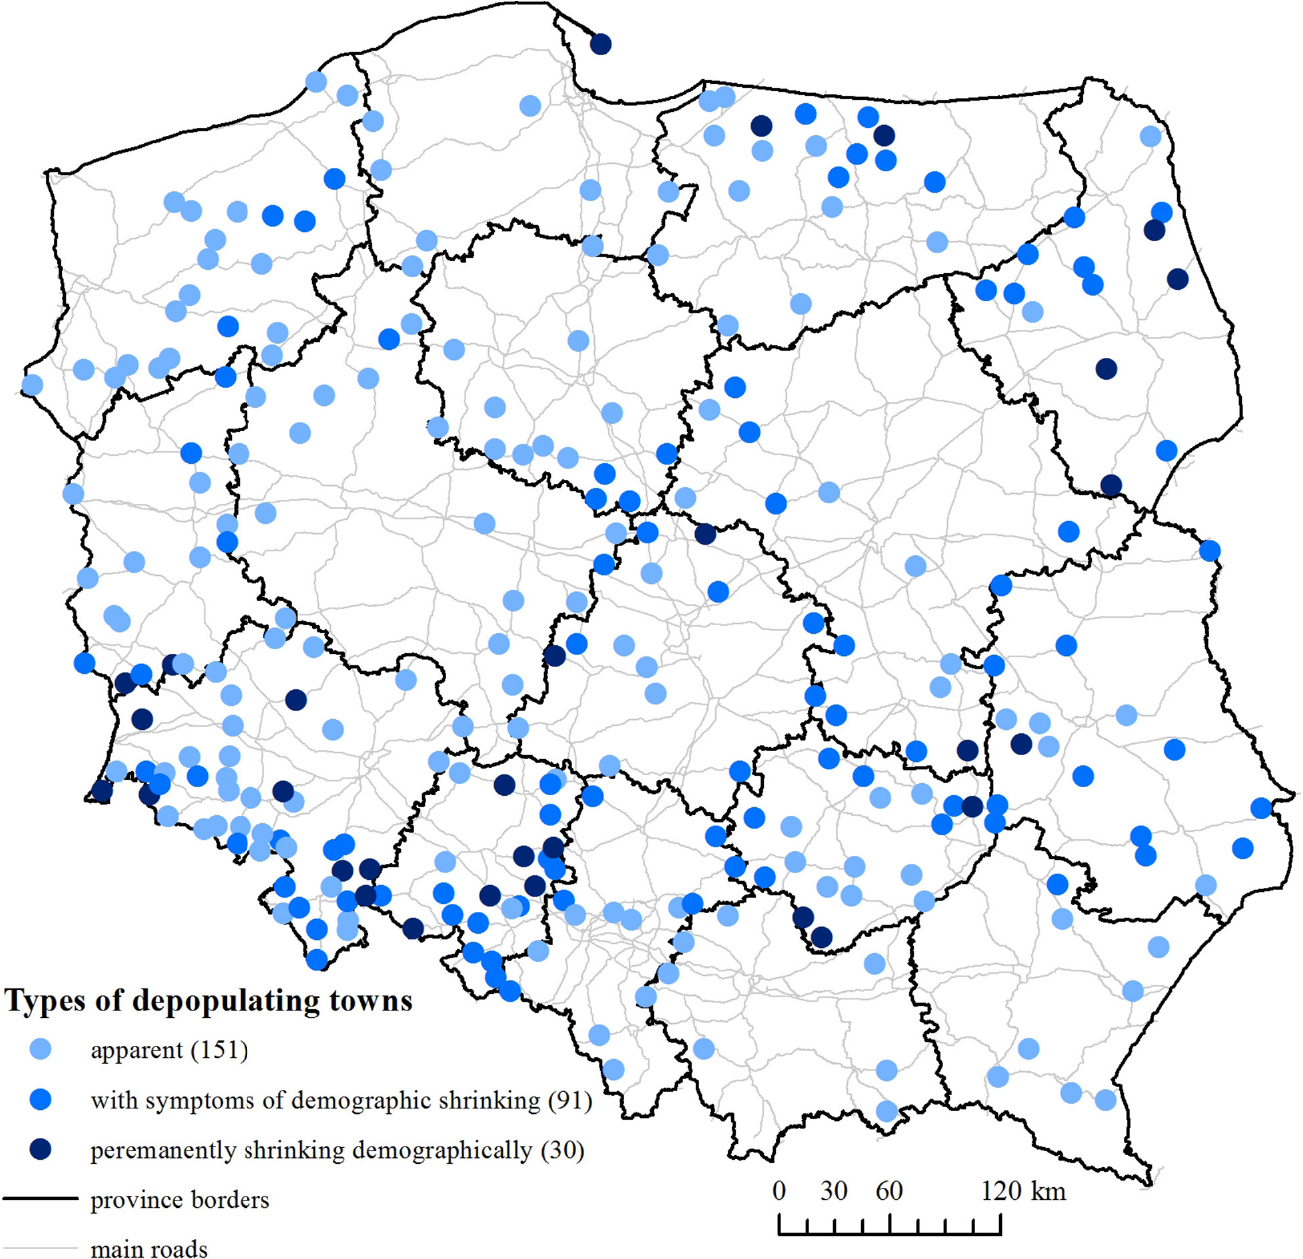
Fig. 4
Types of small depopulating towns.
Table 2
Shrinking small towns in Poland: basic information.
| Number of population | Number of small towns | Number of shrinking small towns | Share of shrinking small towns |
|---|---|---|---|
| up to 5,000 | 320 (47%) | 11 (37%) | 3.4% |
| 5,000–10,000 | 177 (26%) | 10 (33%) | 5.6% |
| 10,000–15,000 | 107 (15.5%) | 2 (7%) | 1.9% |
| 15,000–20,000 | 79 (11.5%) | 7 (23%) | 8.9% |
| In total | 683 | 30 | 4.4% |
Table 3
Values of part I and I of the indicator calculated with a shift-and-share analysis for the selected 5 shrinking small towns.
| Town | Values of part III of the method according to sectors | Real difference in the number of business entities in town between 2002 and 2014 | Hypothetical increase in the number of business entities – part I of the method | Difference be- tween real and hypothetical (part I) change in the number of business entities | Difference between real and hypothetical (part I) change in the number of business entities | |||
|---|---|---|---|---|---|---|---|---|
| sector I | sector II | sector III | sector IV | |||||
| Błaszki | 0.2 | −0.3 | −0.3 | −0.5 | −72 | 28.360 | −100 | −354 |
| Ożarów | −0.2 | −0.3 | −0.3 | −0.5 | −112 | 50.170 | −162 | −323 |
| Żychlin | 0.2 | −0.2 | −0.2 | −0.4 | −97 | 72.490 | −169 | −234 |
| Sokółka | −0.2 | −0.1 | −0.1 | −0.3 | −49 | 168.633 | −218 | −129 |
| Dobrodzień | −0.2 | 0.0 | −0.2 | −0.1 | −4 | 39.420 | −43 | −110 |
Table 4
The way of singling out 16 types of development levels of small towns in Poland between 2002 and 2014.
| Type 2002 | |||||
|---|---|---|---|---|---|
| A | I | II | III | IV | |
| B | V | VI | VII | VIII | |
| C | IX | X | XI | XII | |
| D | XIII | XIV | XV | XVI | |
| D | C | B | A | Type 2014 |
Table 5
Affiliation of shrinking small towns to the appointed types of changes in the level of social and economic development (Table 4).
| Type 2002 | |||||
|---|---|---|---|---|---|
| A | – | Błaszki | Świeradów Zdrój | Strzegom, Śląskie, Głuchołazy Ząbkowice | |
| B | Dobrodzień | Lipsko, Kazimierza Wielka, Ożarów | Bogatynia, Wołczyn, Siemiatycze | Ziębice, Strzelce Opolskie, Krapkowice, Paczków, Hel | |
| C | Poniatowa, Żychlin, Działoszyce, Pienięż- no | Węgliniec | Ozimek | – | |
| D | Gozdnica, Korsze, Dąbrowa Białostocka | Ścinawa, Małomice, Sokółka | Łapy | – | |
| D | C | B | A | Type 2014 |
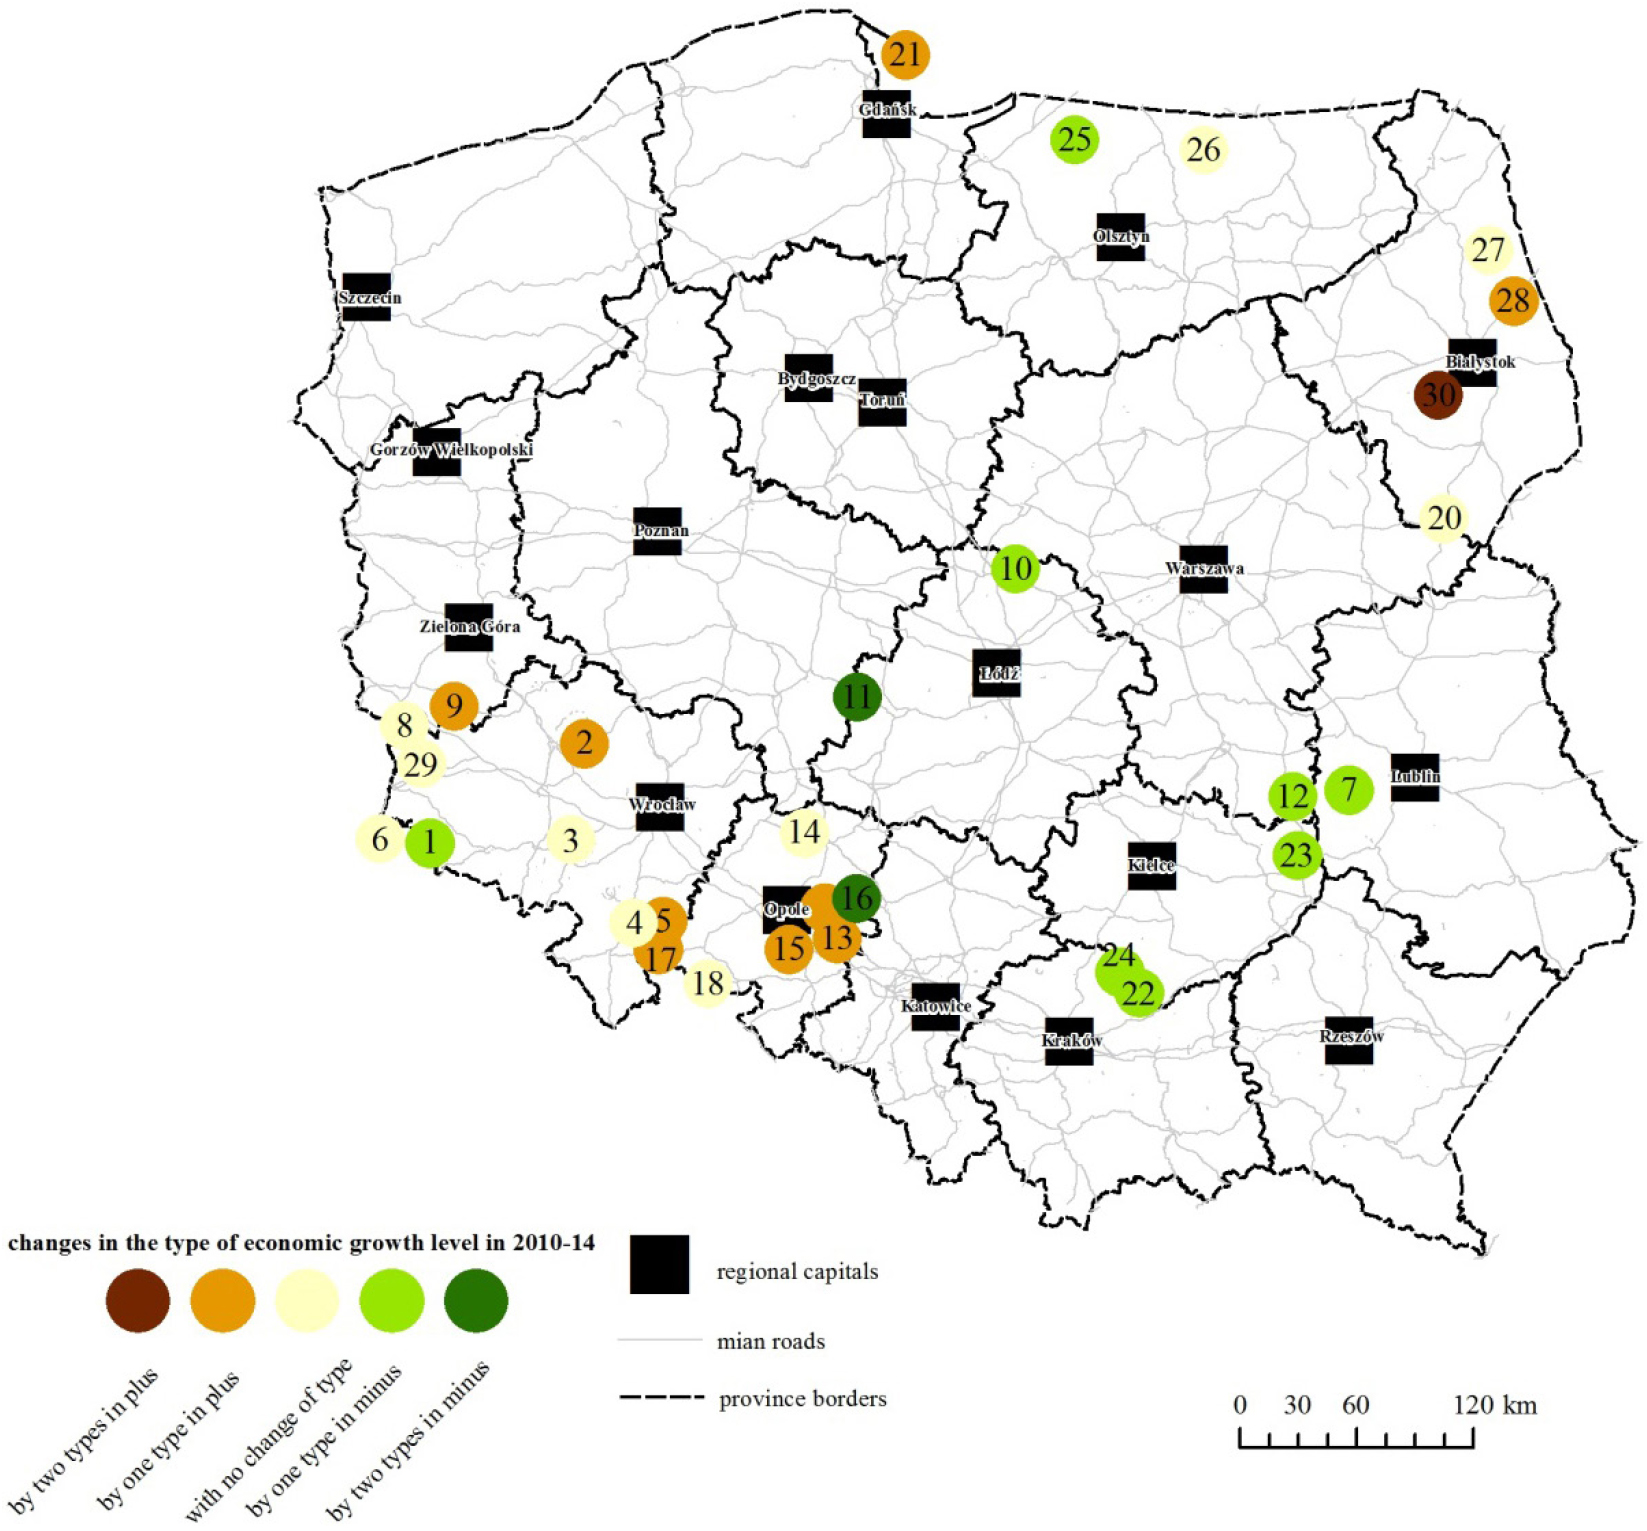
Fig. 5
Changes in the affiliation of depopulating small towns to the type of economic growth level (2002–2014). 1 – Świeradów Zdrój, 2 – Ścinawa, 3 – Strzegom, 4 – Ząbkowice Śląskie, 5 – Ziebice, 6 – Bogatynia, 7 – Poniatowa, 8 – Gozdnica, 9 – Małomice, 10 – Żychlin, 11 – Błaszki, 12 – Lipsko, 13 – Strzelce Opolskie, 14 – Wołczyn, 15 – Krapkowice, 16 – Dobrodzień, 17 – Paczków, 18 – Głuchołazy, 19 – Ozimek, 20 – Siematycze, 21 – Hel, 22 – Kazimierza Wielka, 23 – Ożarów, 24 – Działoszyce, 25 – Pieniężno, 26 – Korsze, 27 – Dąbrowa Białostocka, 28 – Sokółka, 29 – Węgliniec, 30 – Łapy.