
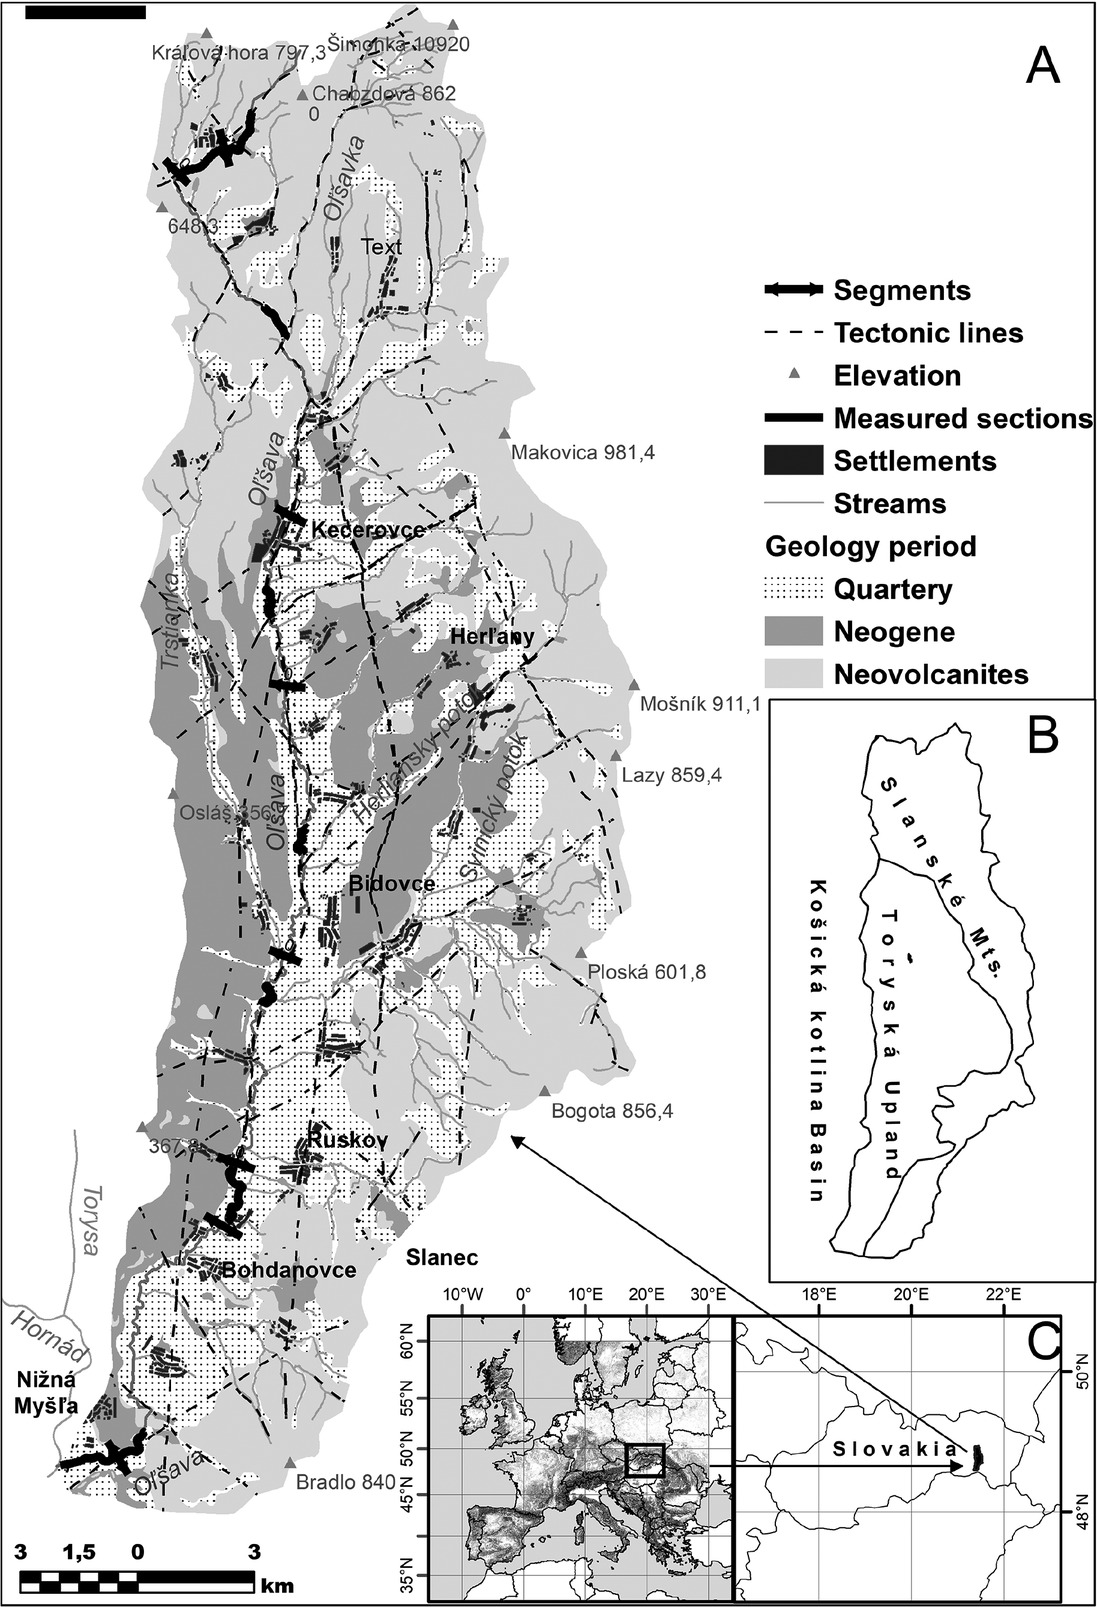
Fig. 1
Geological and tectonic structure of the Oľšava river catchment (A), geomorphological units of the Oľšava catchment area (B), the location of the basin (C).
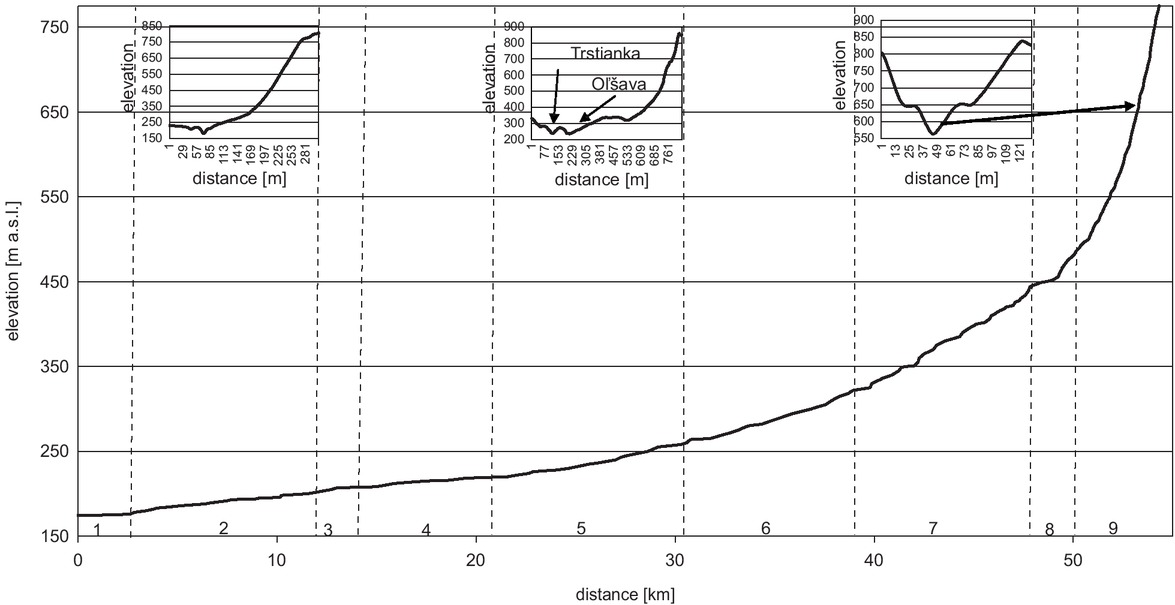
Fig. 2
The longitudinal profile of the Oľšava river valley showing the boundaries of the assessed segments. The top of the figure depicts transverse profiles of the Oľšava valley documenting the change in the width of the valley and its asymmetry.
Table 1
Basic parameters of evaluated segments of the longitudinal profile of the Oľšava River.
| segments | altitude [m a.s.l.] | lenght | hight/width valley (Vf) | stream lenght gradiet index (SL) | average slope segments [%] | width valley [m] | average slope segments [°] | sinuosity index | |
|---|---|---|---|---|---|---|---|---|---|
| min | max | ||||||||
| 1 | 174.5 | 175.0 | 1675.9 | 5.19 | 15.96 | 0.0298 | 384.16 | 0.01707 | 1.030 |
| 2 | 175.0 | 200.0 | 9856.3 | 1.59 | 121.02 | 0.2536 | 241.02 | 0.14530 | 1.495 |
| 3 | 200.0 | 207.3 | 1490.9 | 6.17 | 204.43 | 0.4896 | 1237.46 | 0.28052 | 1.042 |
| 4 | 207.3 | 222.0 | 9051.8 | 3.43 | 59.91 | 0.1624 | 1318.80 | 0.09305 | 1.604 |
| 5 | 222.0 | 265.0 | 9686.5 | 5.33 | 121.62 | 0.4439 | 1060.46 | 0.25430 | 1.569 |
| 6 | 265.0 | 305.0 | 5795.1 | 2.26 | 135.67 | 0.6902 | 550.25 | 0.39550 | 1.212 |
| 7 | 305.0 | 456.0 | 11692.2 | 0.26 | 140.93 | 1.2915 | 53.00 | 0.73990 | 1.296 |
| 8 | 456.0 | 504.0 | 1596.7 | 0.08 | 128.31 | 3.0062 | 10.00 | 1.72191 | 1.112 |
| 9 | 504.0 | 774.0 | 3469.7 | 0.15 | 135.00 | 7.7817 | 20.00 | 4.44960 | 1.056 |
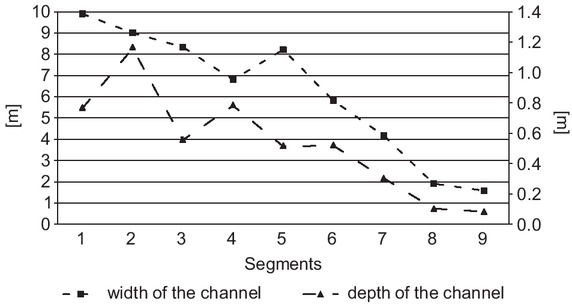
Fig. 3
The average width of the riverbed (left axis) and the depth of the channel (right axis) in the measured Oľšava River longitudinal profile section.
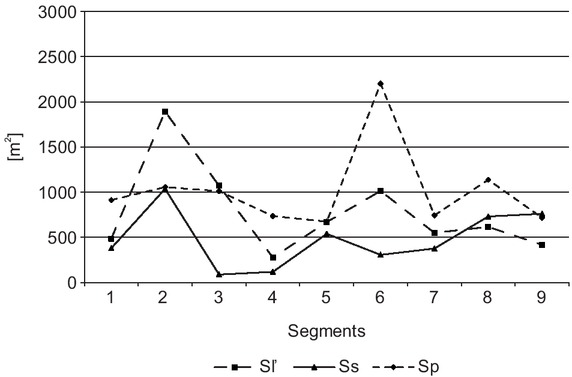
Fig. 4
Bar areas on the left (Sľ), centre (Ss) and right side (Sp).
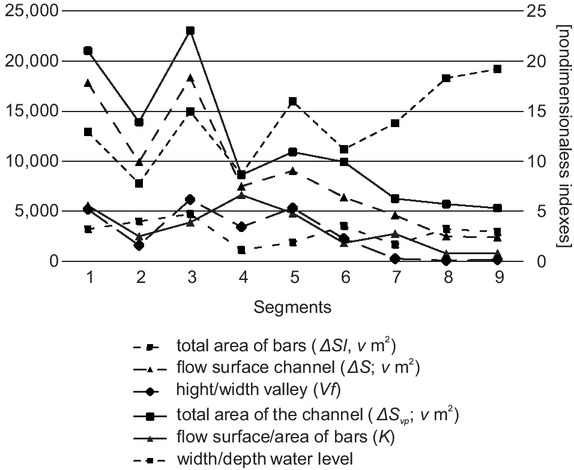
Fig. 5
Graph of individual parameters in the Oľšava flow measured section.
Left axis: total area of bars ΔSl [m2], total area of the channel ΔSvp [m2], flow surface channel ΔS [m2]. Right axis: height/width valley Vf, width/depth water level, and flow surface/area of bars K.
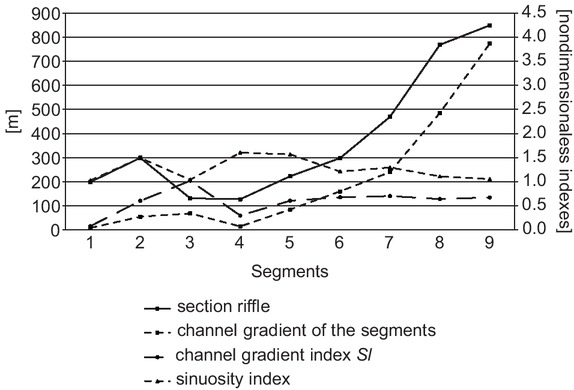
Fig. 6
Graph of the different parameters in the Oľšava measured section.
Left axis: section riffle type [m], channel gradient index SL. Right axis: average channel segment slope and degree of sinuosity.
Table 2
Correlation matrix of the individual Oľšava flow parameters in the segments of the mapped sections.
| type river reach [m] | average width of river bed [m] | area of the bars ΔSl [m2] | total area of the channel ΔSvp [m2] | water area ΔS [m2] | water area/area bars [K] | stream gradients [SL] | slope segments | height/width valley [Vf] | sinuosity index | |
|---|---|---|---|---|---|---|---|---|---|---|
| type river reach [m] | – | |||||||||
| average width of river | ||||||||||
| bed [m] | −0.9089 | – | ||||||||
| area of the bars ΔSl | 0.0004 | 0.3437 | – | |||||||
| [m2] | ||||||||||
| total area of the chan- | −0.6758 | 0.8196 | 0.5862 | – | ||||||
| nel ΔSvp [m2] | ||||||||||
| water area ΔS [m2] | −0.7447 | 0.8359 | 0.4502 | 0.9873 | – | |||||
| water area/area bars | ||||||||||
| [K] | −0.8181 | 0.5971 | −0.4002 | 0.4733 | 0.6001 | – | ||||
| stream gradients [SL] | 0.2060 | −0.0460 | 0.4379 | −0.0413 | −0.1313 | −0.5419 | – | |||
| slope segments | 0.9576 | −0.9016 | 0.0121 | −0.6263 | −0.6926 | −0.7654 | 0.2821 | – | ||
| height/width valley | −0.8158 | 0.7603 | 0.1637 | 0.8112 | 0.8620 | 0.7471 − | 0.1214 | −0.7021 | – | |
| [Vf] | ||||||||||
| sinuosity index | −0.4078 | 0.2685 | −0.5840 | −0.2729 | −0.1863 | 0.4380 − | 0.1873 | −0.4496 | 0.0689 | – |
| Index width/depth water level | 0.6817 | −0.6568 | 0.0603 | −0.2456 | −0.2827 | −0.4714 | 0.3372 | 0. 7426 | −0.1801 | −0.5676 |
[i] Significant level = 0.05, N=9.