
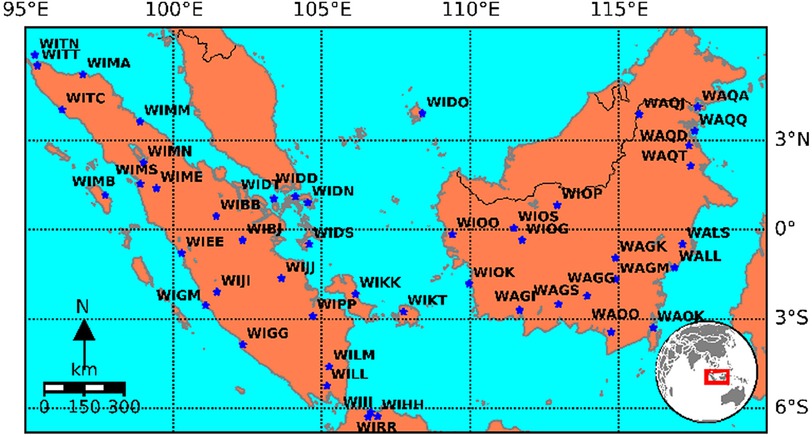
Fig. 1
Research Area and Airports location.
Table 1
Visibility below minima criteria for VFR and IFR (Glahn et al. 2015., Rudack, Ghirardelli 2010, FAA 2009, DGCA 2015).
| Class | Flight Rule | Minimum Visibility Condition | Scale |
|---|---|---|---|
| H1 | VFR (Visual Flight Rule) | More than 4.8 km (>3 SM) | 1 |
| H2 | SVFR (Special Visual Flight Rule) | 3.2–4.8 km (2–3 SM) | 2 |
| H3 | IFR (Instrument Flight Rule I) | 1.6–3.2 km (1–2 SM) | 3 |
| H4 | LIFR (instrument Flight Rule II) | Less than 1600 m (< 1 SM) | 4 |
Table 2
Probability of occurrence (State-Argentina 2016).
| Probability | Explanation | Prob (Scale) |
|---|---|---|
| Frequent | occurred frequently, probability more than 0.7 | 5 |
| Occasional | occurred infrequently, probability is 0.5 s/d 0.7 | 4 |
| Remote | occurred rarely), probability is 0.1 s/d 0.5 | 3 |
| Improbable | not known to have occurred, probability 0.01 s/d 0.1 | 2 |
| Extremely improbable | Impossible to occur, probability less than 0.01 | 1 |
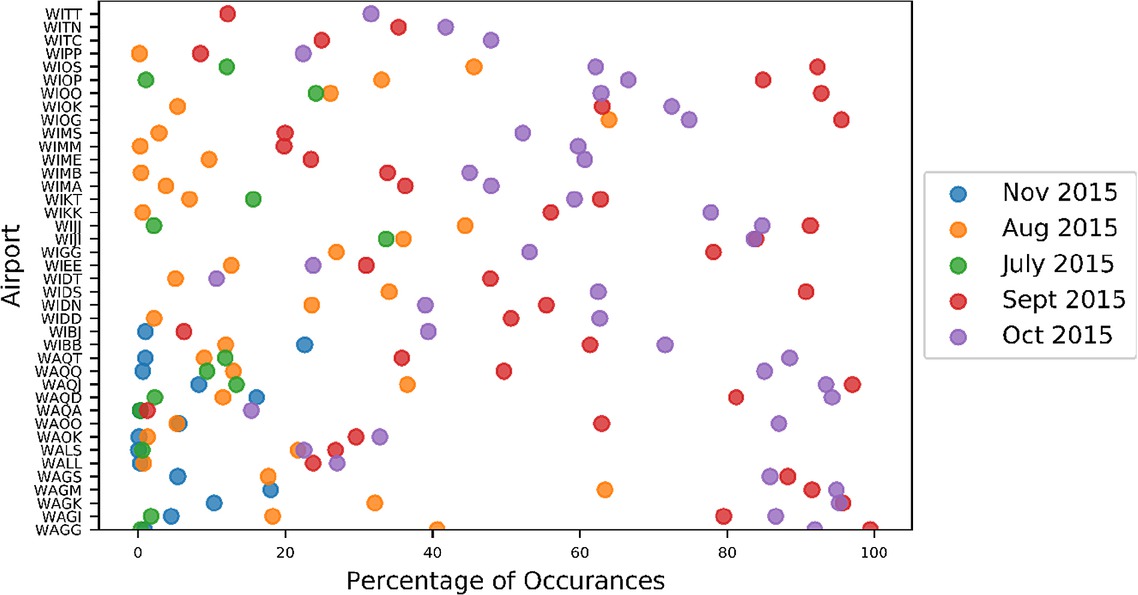
Fig. 2
Airport smoke frequency in month of July, August, September, October, and November 2015; no smoke occurred in December 2015.
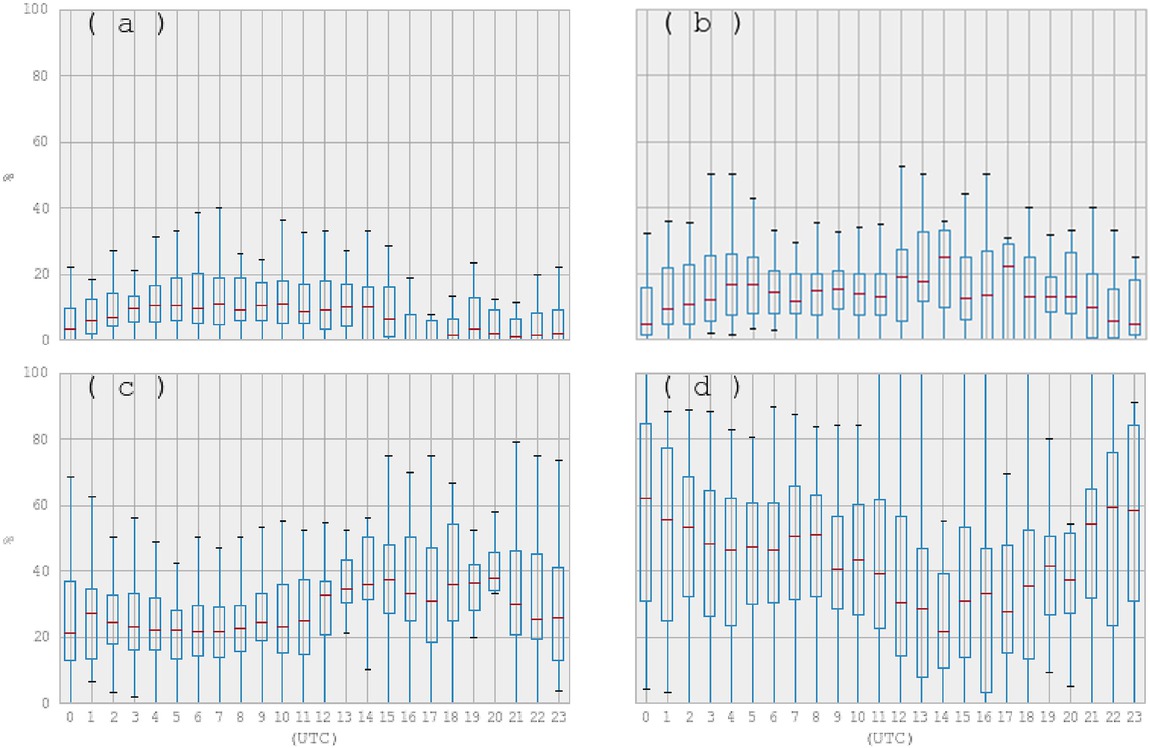
Fig. 3
Box plot diagram of visibility frequencies in a day from 42 airports with periods from July to December 2015. The impact of smoke is quantified based on visibility values (Table 1) dividing into 4 classes: H1 (VFR) (a), H2 (SVFR) (b), H3 (IFR) (c), H4 (LIFR) (d). H1: smoke with visibility > 4.8 km; H2: smoke with visibility 3.2–4.8 km; H3: smoke with visibility 1.6–3.2 km; while H4: smoke with visibility <1.6 km.
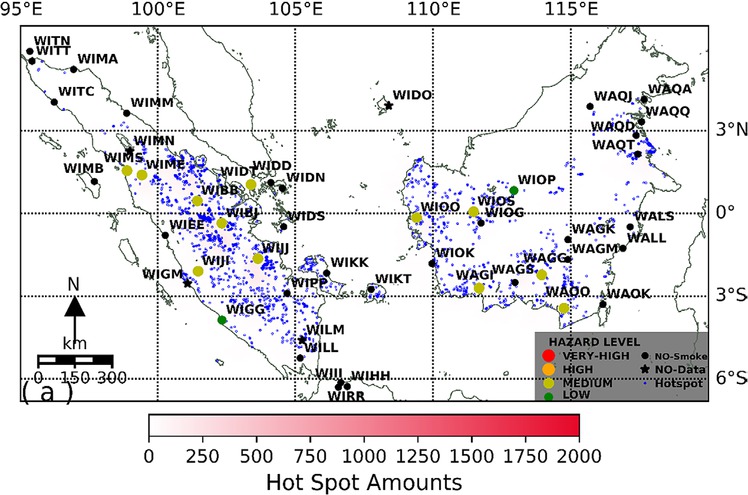
Fig. 4 a
Visibility Severity Index (VSI) July 2015. Blue dot: hotspot; hotspot density showed in a red colour heat map.
 : No-Smoke;
  : Low VSI;
  : Medium VSI;
  : High VSI;
  : Very High VSI.
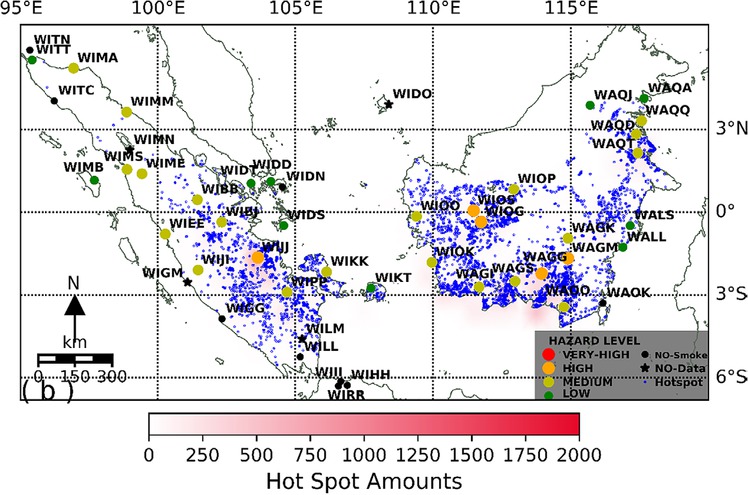
Fig. 4 b
The same as Fig. 4 a, for month August 2015.
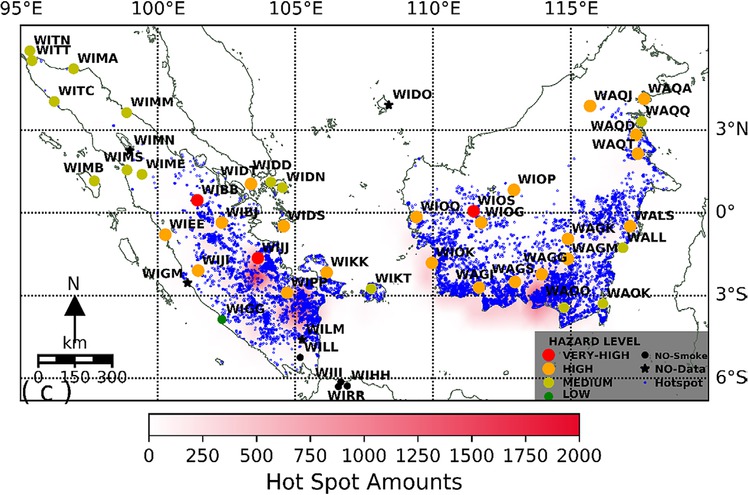
Fig. 4 c
The same as Fig. 4 a, for month September 2015.
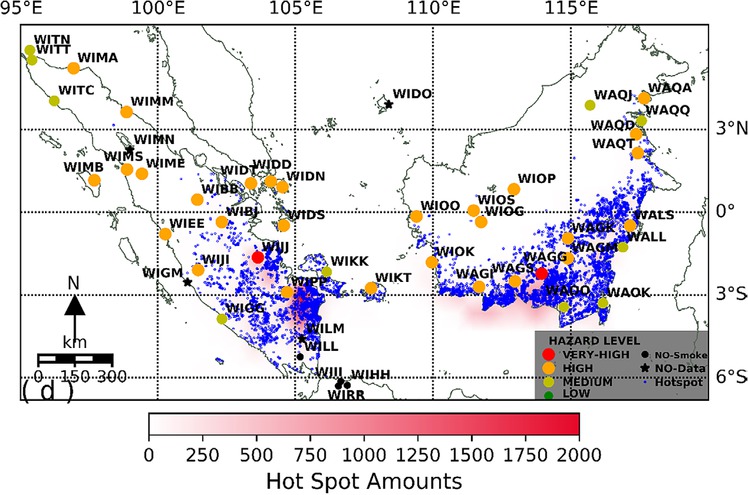
Fig. 4 d
The same as Fig. 4 a, for Month October 2015.
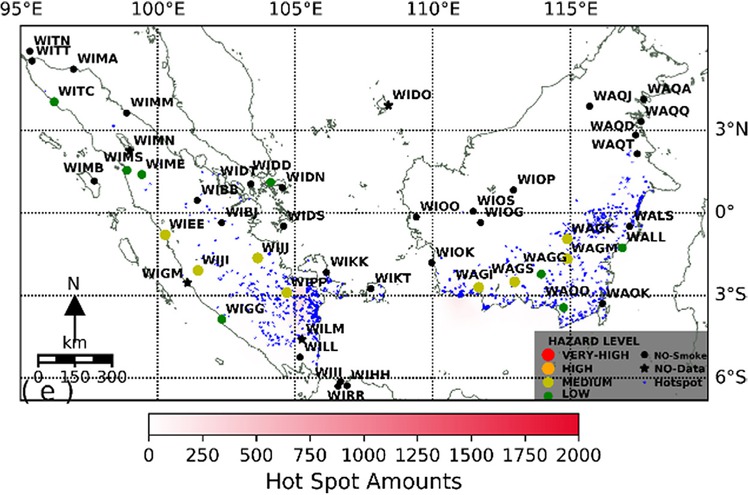
Fig. 4 e
The same as Fig. 4 a, for Month November 2015.
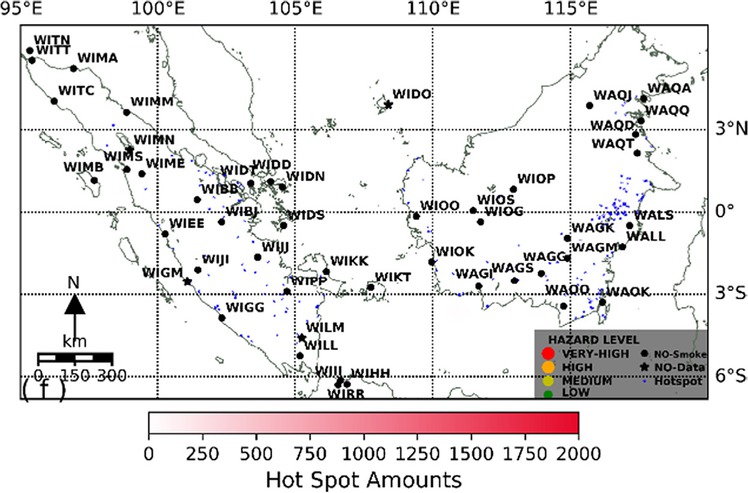
Fig. 4 f
The same as Fig. 4 a, for Month December 2015.
Table 3
Visibility Class Frequency at very high VSI (Sources: data analysis and Indonesian aerodrome/airport chart legend (INDOAVIS 2013)).
| Airport Code (ICAO 4 Letter) | Airport Name | Month (2015) | Frequency (Class) | Flight Operation | |||
|---|---|---|---|---|---|---|---|
| H1 (VFR) | H2 (SVFR) | H3 (IFR) | H4 (LIFR) | ||||
| WIJJ | Sultan Thaha Jambi | October | 0.28 | 3.55 | 12.50 | 77.13 | IFR & VFR |
| WIBB | Sultan Syarif Kasim IIPekanbaru | September | 0.99 | 0.99 | 10.73 | 71.26 | IFR & VFR |
| WAGG | TjilikRiwutPalangkaraya | October | 0.29 | 1.08 | 10.71 | 79.86 | IFR & VFR |
| WIOS | SusiloSintang | September | 0.31 | 1.23 | 20.00 | 70.77 | VFR |
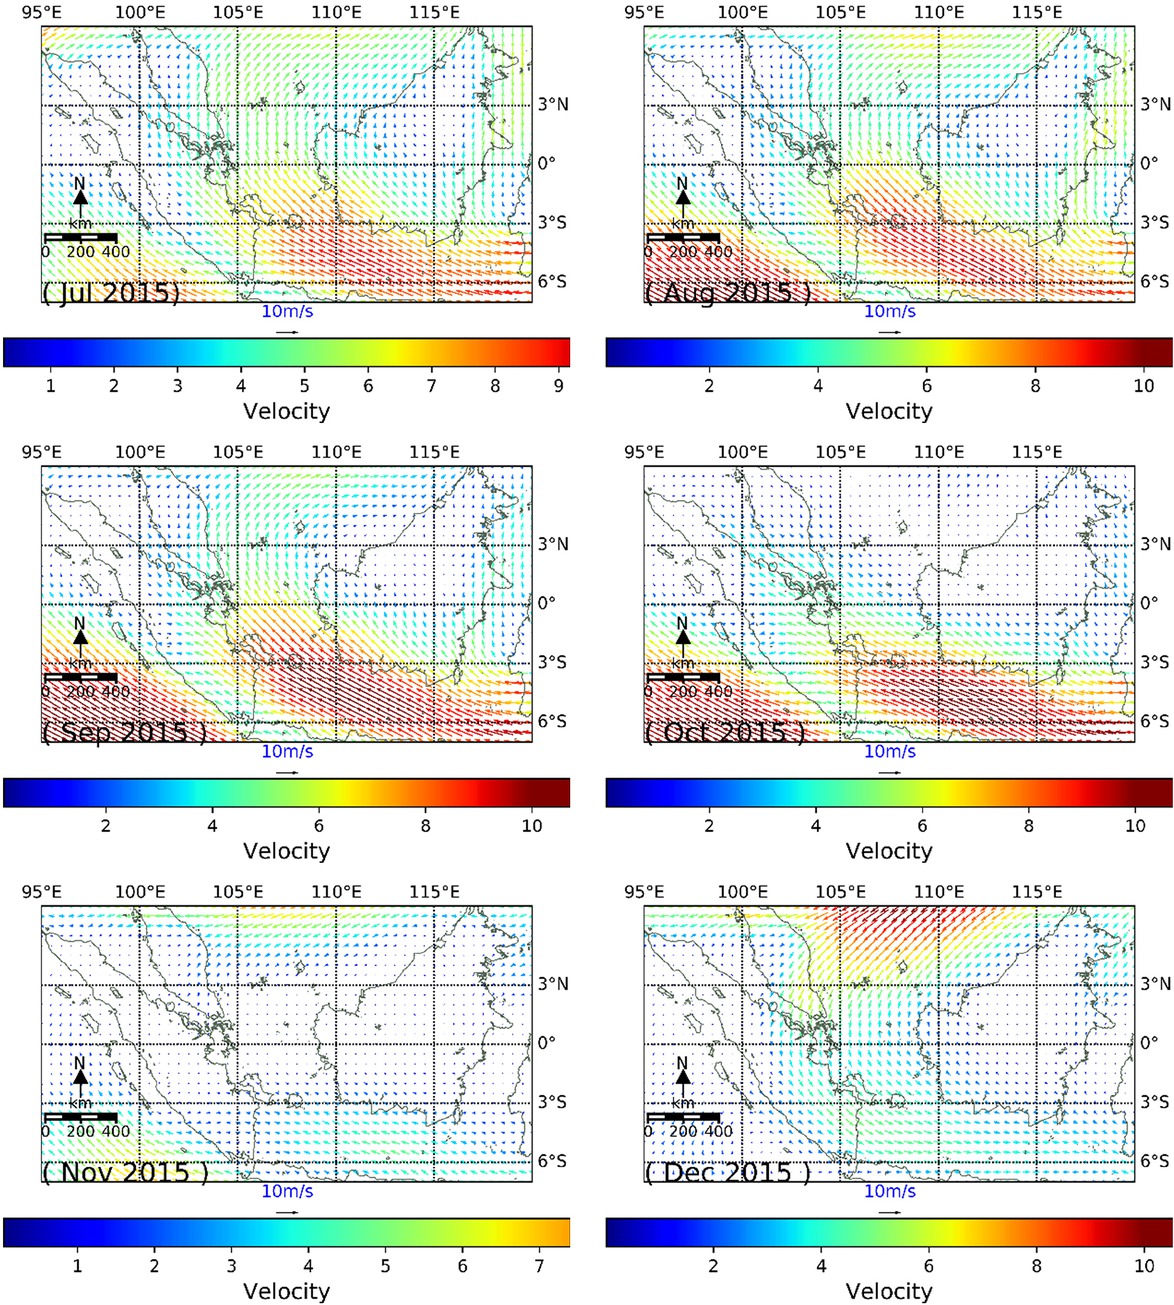
Fig. 5
Monthly mean wind level ± 762 m (925 mbar) 0.5 × 0.5 degree ECMWF model for period from July to December 2015.