
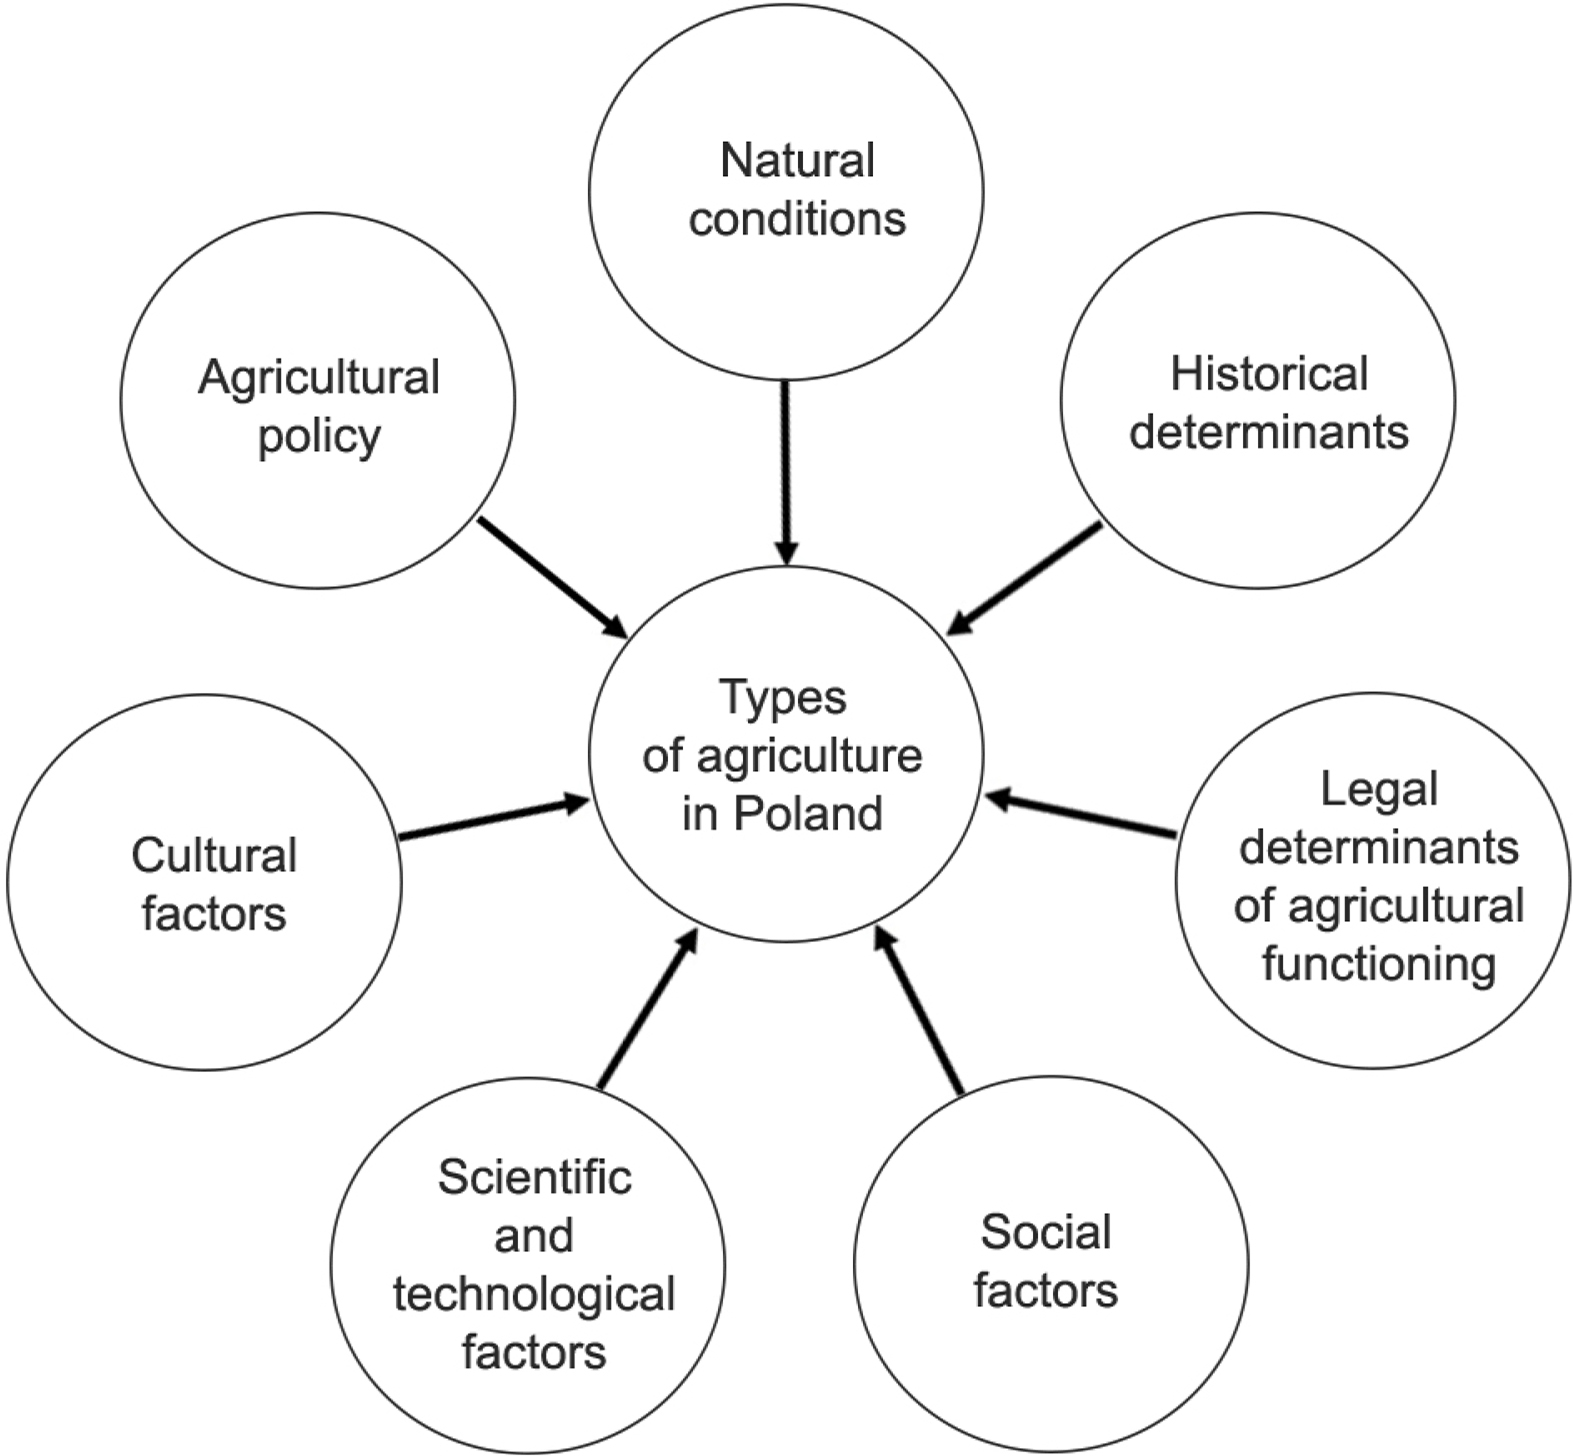
Fig. 1
Conditions and factors determining the types of agriculture in Poland after 1945.
Source: own elaboration.
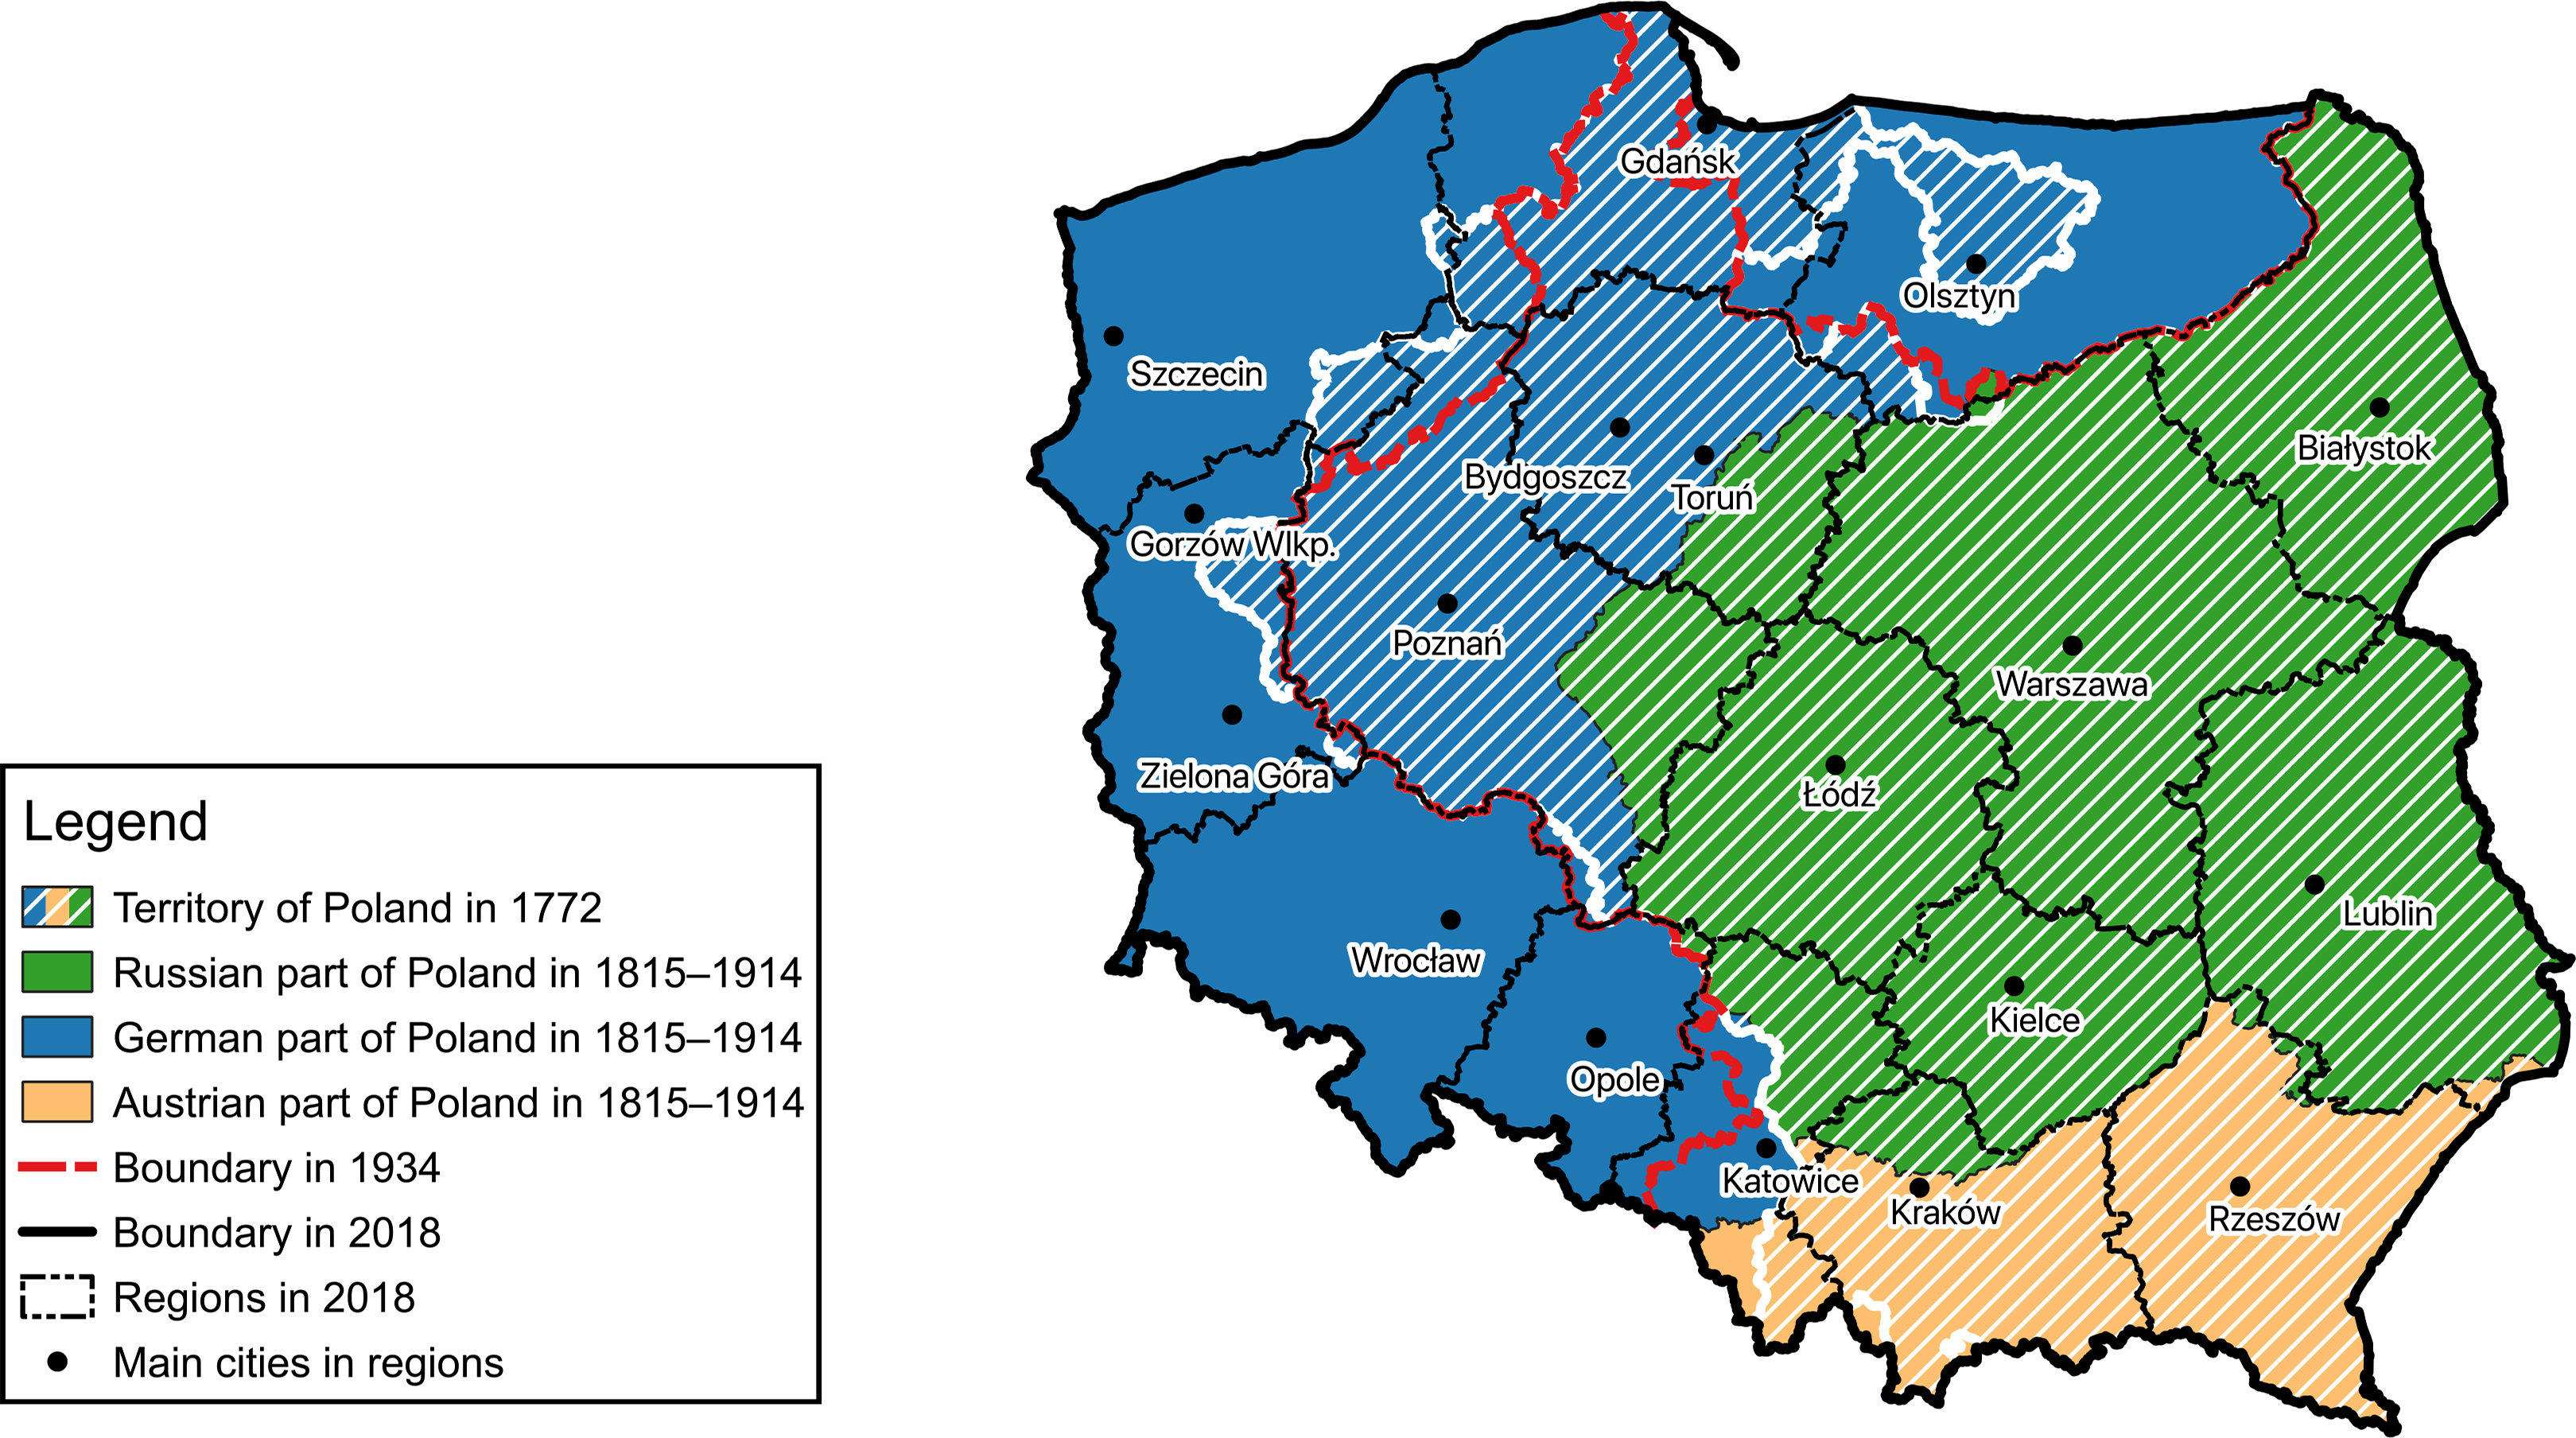
Fig. 2
Polish borders in 1772–2018.
Source: own elaboration.
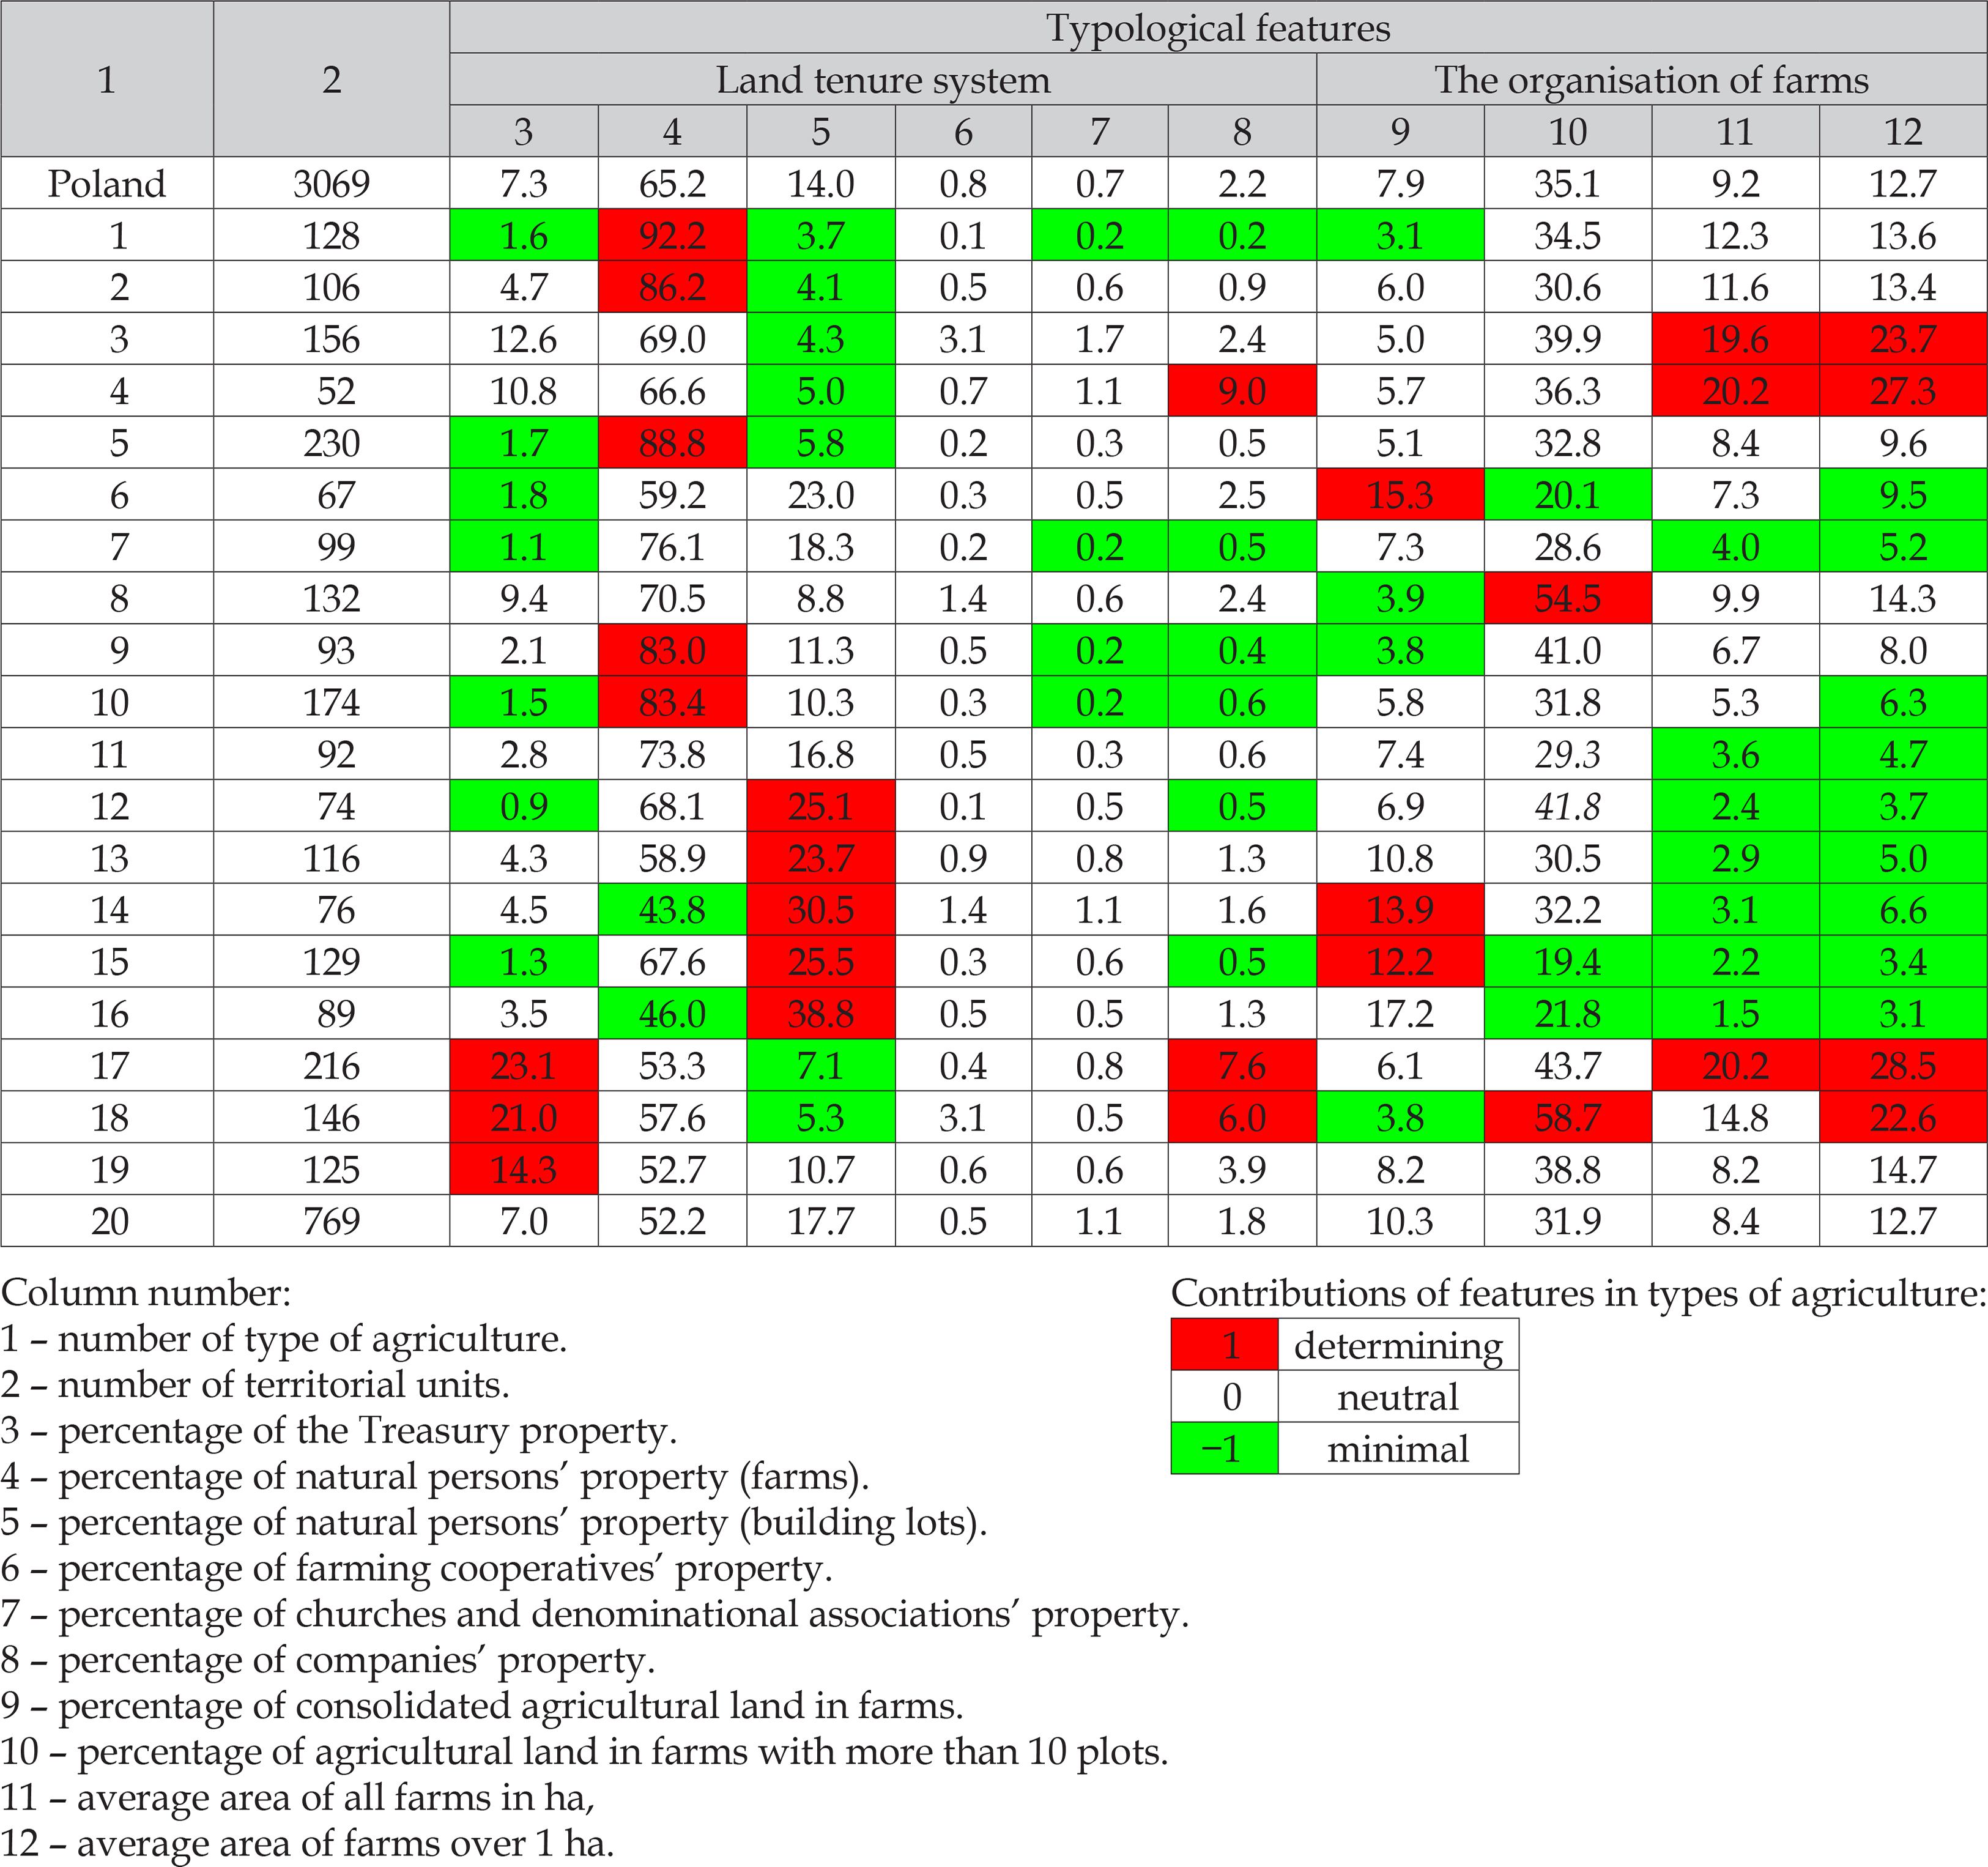
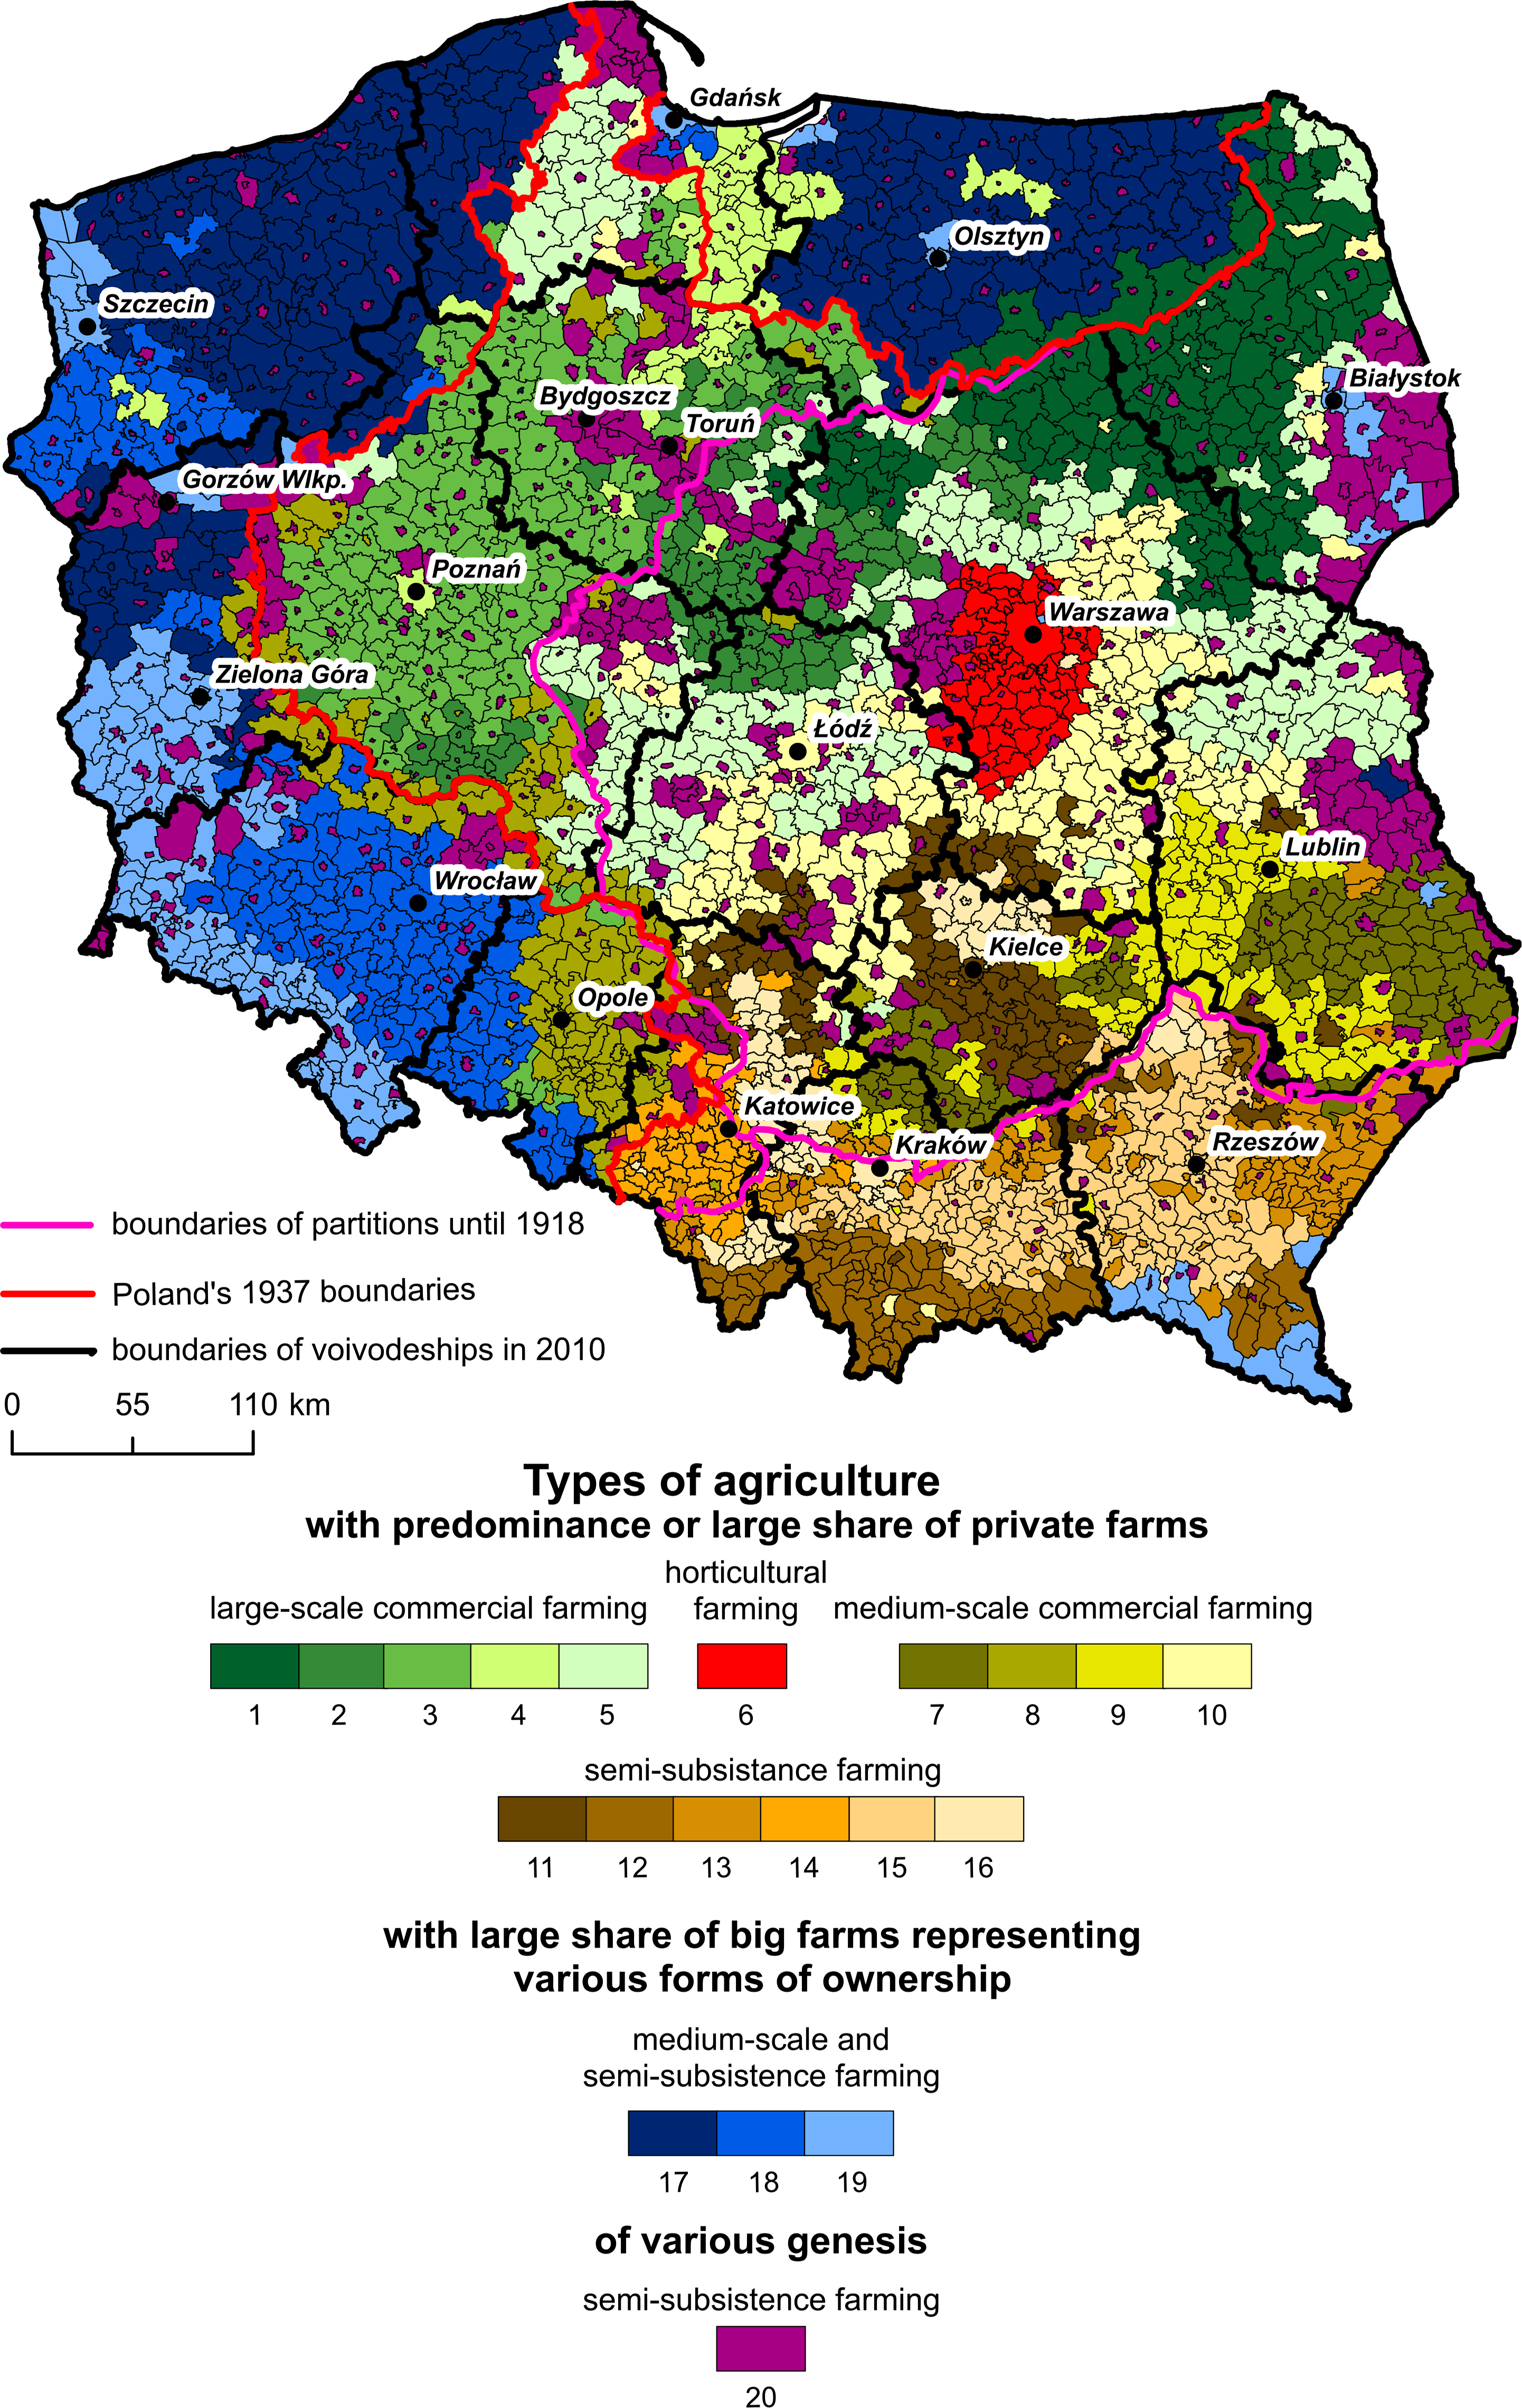
Fig. 3
Types of agriculture in 2010.
Source: own elaboration.
Appendix 1
Typological features in 2010.
| Land tenure system (2012) and organisation of production space (2010) | Labour resources and quality | Means of production | Natural resources and structure of crops | Proportion and concentration of animal husbandry | Effects of agricultural production |
|---|---|---|---|---|---|
| 1 – percentage of the Treasury property | 11 – number of working per 100 ha of agricultural land | 21 – number of cereal combine harvesters per 100 ha of agricultural land | 30 – percentage of arable land in agricultural land | 48 – number of horses per 100 ha of agricultural land, | 63 – percentage of farms in which more than 50% of farm income comes from agricultural activity |
| 2 – percentage of natural persons’ property (farms) | 12 – percentage of people with higher education | 22 – number of potato combine harvesters per 100 ha of agricultural land | 31 – percentage of wasteland in agricultural land | 49 – total number of cattle per 100 ha of agricultural land, | 64 – percentage of farms in which more than 50% of farm income comes from hired labour |
| 3 – percentage of natural persons’ property (building lots) | 13 – percentage of people with secondary education | 23 – number of beat combine harvesters per 100 ha of agricultural land | 32 – percentage of orchards in agricultural land | 50 – number of cows per 100 ha of agricultural land, | 65 – percentage of farms in which more than 50% of farm income comes from disability and old-age pensions |
| 4 – percentage of farming cooperatives’ property | 14 – percentage of people with post-primary vocational education | 24 – number of tractors per 100 ha of agricultural land | 33 - percentage of house gardens in agricultural land | 51 – percentage of cows in herd, | 66 – percentage of farms running agricultural activity |
| 5 – percentage of churches and denominational associations’ property | 15 – percentage of people with no education | 25 – percentage of farms raising cows using churn milking machines | 34 – percentage of meadows in agricultural land | 52 – number of swine per 100 ha of agricultural land, | 67 – percentage of farms not running agricultural activity |
| 6 – percentage of companies’ property | 16 – mobile age (up to 44 years old) | 26 – percentage of farms raising cows using pipeline milking machines | 35 – percentage of pastures in agricultural land | 53 – total number of poultry per 100 ha of agricultural land, | 68 – percentage of farms in which final production is fully commercial |
| 7 – percentage of consolidated agricultural land in farms | 17 – mobile age (up to 34 years old) | 27 – percentage of farms raising cows using bucket milk coolers | 36 – percentage of wheat in sown area | 54 – number of hens per 100 ha of agricultural land | 69 – percentage of farms in which final production is destined exclusively for self-supplying farms |
| 8 – percentage of agricultural land in farms with more than 10 plots | 18 – non-mobile age (45-64 years old) | 28 – percentage of farms raising cows using tank milk coolers, | 37 – percentage of rye in sown area | 55 – number of broilers per 100 ha of agricultural land | |
| 9 – average area of all farms in ha | 19 – post-working age (over 65), | 29 – use of mineral (artificial) fertilisers NPK in pure component in kg/1 ha of agricultural land | 38 – percentage of barley in sown area | 56 – number of turkeys per 100 ha of agricultural land | |
| 10 – average area of farms over 1 ha | 20 – percentage of women managing farms | 39 – percentage of triticale in sown area | 57 – number of geese per 100 ha of agricultural land |
Appendix 2
Features determining types of agriculture.
| No. of type | Land tenure system (2012) and organisation of production space (2010) | Labour resources and quality | Means of production | Resources, crops and husbandry | Effects of agricultural production | |
|---|---|---|---|---|---|---|
| Natural resources and structure of crops | Proportion and concentration of animal husbandry | |||||
| 1 | 2 | 14, 16, 17 | 26, 28 | 34, 35, 40, 45 | 49, 50, 60 | 63, 66 |
| 2 | 2 | 13, 14, 16, 17 | 23, 25, 28, 29 | 30, 44, 45 | 49, 50, 52, 60 | 63, 66 |
| 3 | 9, 10 | 13, 14 | 25, 28, 29 | 30, 38, 39, 42, 44 | 52, 60 | 63 |
| 4 | 6, 9, 10 | 14 | 26, 28, 29 | 30, 36, 42, 44 | 60 | 63 |
| 5 | 2 | 14, 16, 17 | 37, 39, 40 | 49, 50 | 63, 66 | |
| 6 | 7 | 24, | 46, 47 | 68 | ||
| 7 | 21, 24 | 32, 38 | 51 | |||
| 8 | 8 | 21, 25, 29 | 30, 38 | 52 | ||
| 9 | 2, 9 | 16, 17 | 21, 23, 24 | 30, 36, 38, 44 | 66 | |
| 10 | 2 | 37, 39, 40 | ||||
| 11 | 15 | 24 | 37, 39 | 58 | 65, 69 | |
| 12 | 3 | 11, 15, 19, 20 | 24 | 34, 39, 43 | 48, 51 | 65, 67, 69 |
| 13 | 3 | 11, 20 | 24 | 36 | 51, 58 | 64, 69 |
| 14 | 3, 7 | 11, 20 | 21, 24 | 38 | 65, 67, 69 | |
| 15 | 3, 7 | 11, 19, 20, | 24, | 34, 36, 43 | 51 | 65, 69 |
| 16 | 3 | 11, 15, 19, 20 | 24 | 31, 43 | 65, 67, 69 | |
| 17 | 1, 6, 9, 10 | 31, 32, 37, 43 | 60 | |||
| 18 | 1, 6, 8, 10 | 29 | 30, 36, 41, 42 | |||
| 19 | 1 | 34, 35 | ||||
| 20 | No significant features in this type | |||||
[i] Source: own calculations on the basis of data of the 2010 National Agricultural Census, Statistics Poland and the Head Office of Geodesy and Cartography in Warsaw.