
Table 1
Characteristics of broad-scale population grids.
| Project | Region | Resolution | Timestamp | Availability |
|---|---|---|---|---|
| WorldPop | South America, Central America, Africa, Asia | 100 m (country), 1 km (continent) | 2010–2020 with 5 year interval | http://www.worldpop.org.uk |
| LandScan | world-wide | 1 km | 2000–2017 with 1 year interval | https://landscan.ornl.gov |
| GPWv4 | world-wide | 1 km | 2000, 2010, 2015, 2020 | http://sedac.ciesin.columbia.edu |
| E.U. pop grid | European Union countries | 100 m | 2000 | http://www.eea.europa.eu |
| Australian pop.grid | Australia | 1 km | 2011 | http://www.abs.gov.au |
| SEDAC-USA | United States | 1 km (USA), 250 m (MSA) | 1990, 2000, 2010 | http://sedac.ciesin.columbia.edu |
| SocScape | United States | 30 m | 1990, 2000, 2010 | http://sil.uc.edu |
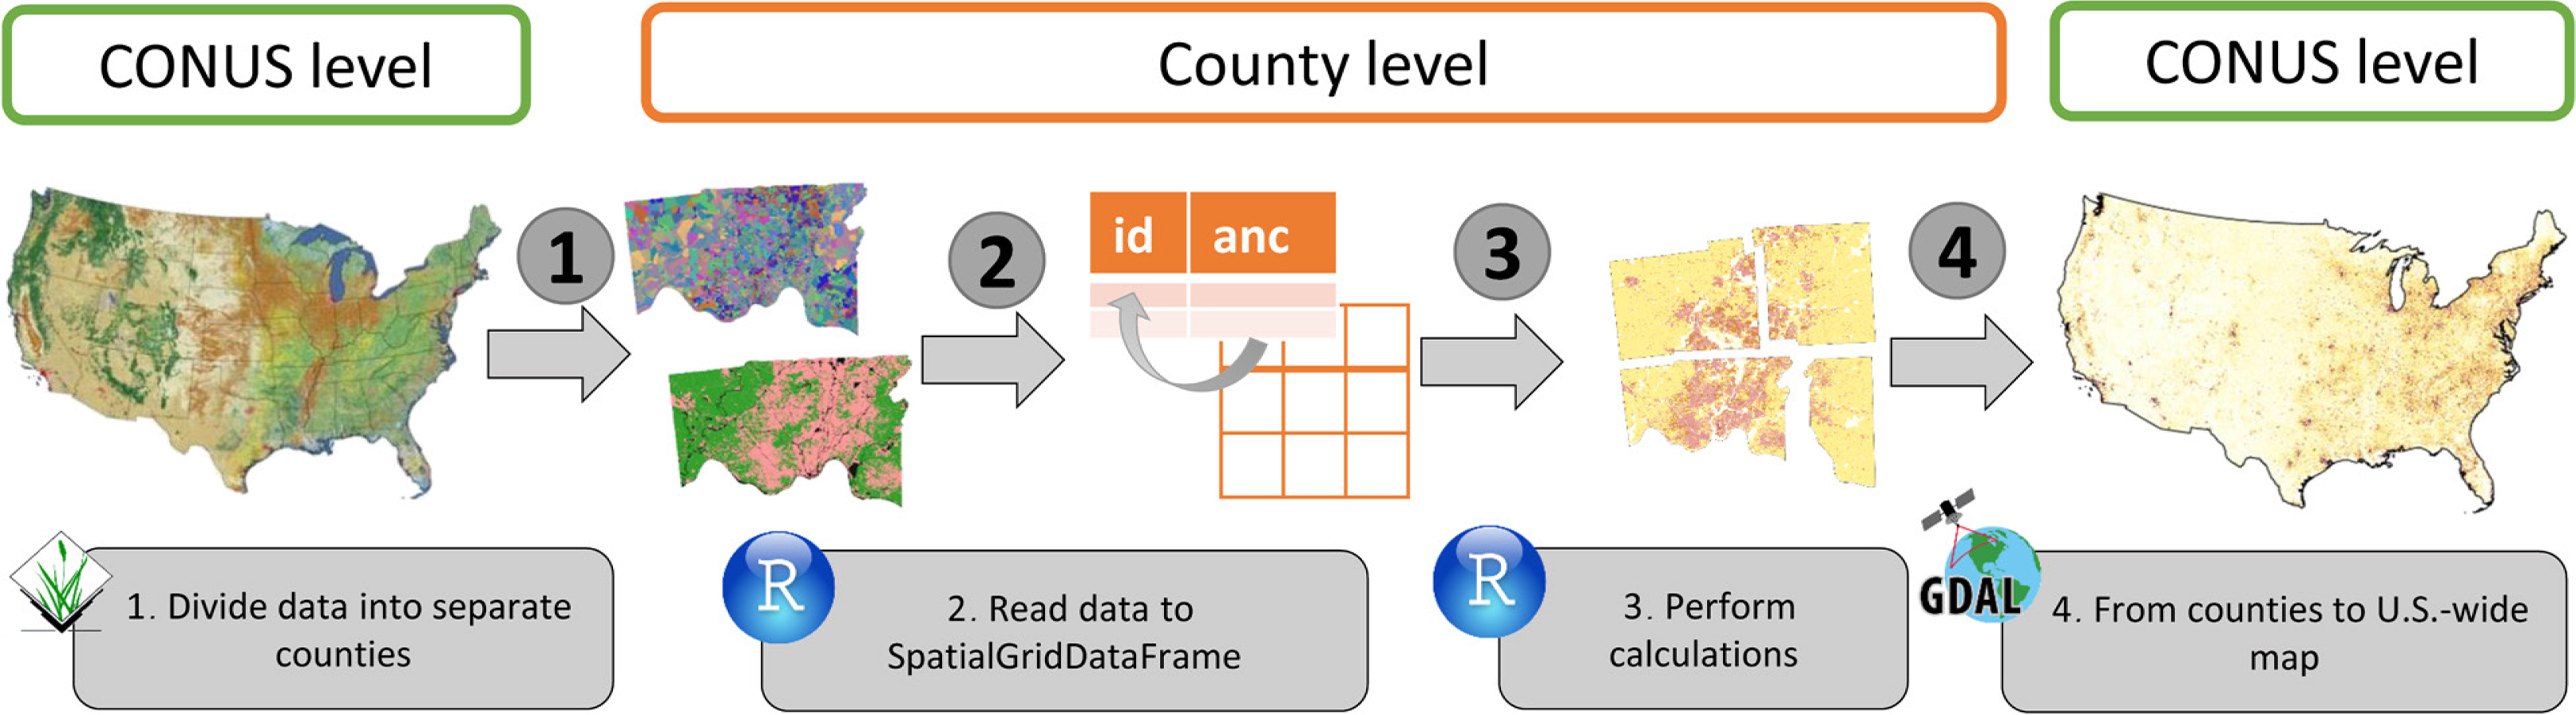
Fig. 1
Process of handling large datasets in R.
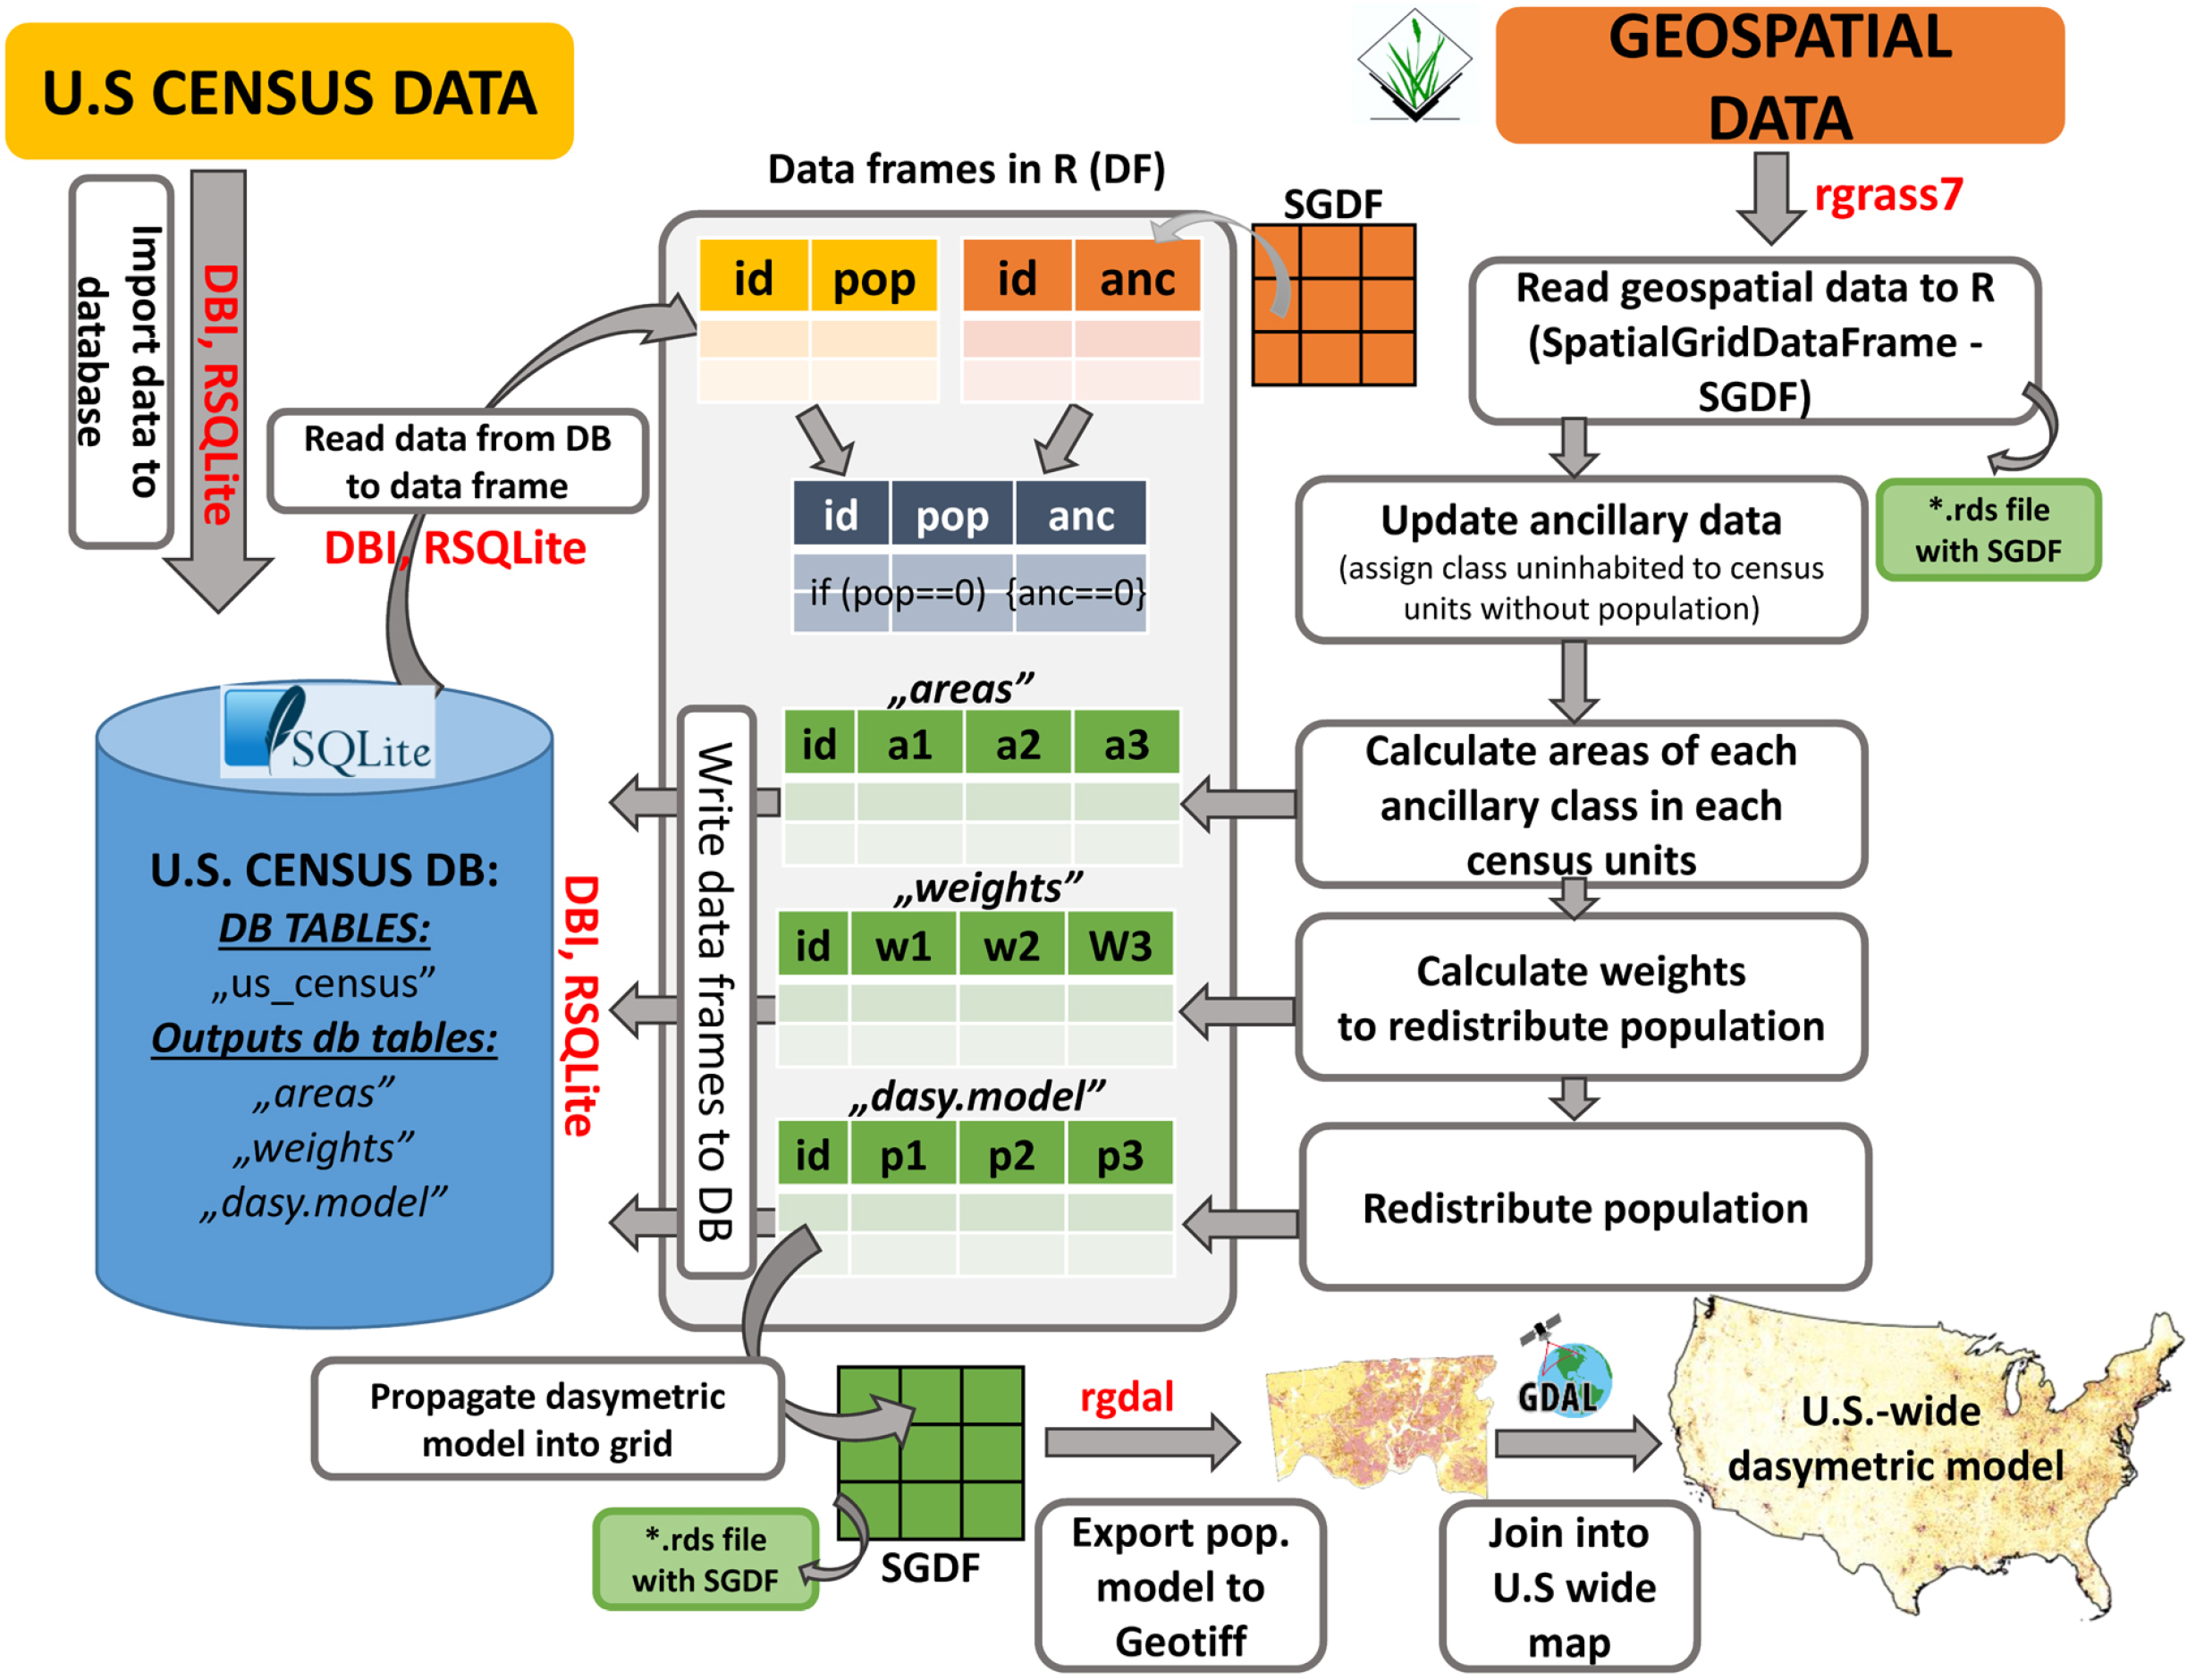
Fig. 2
Framework of calculation dasymetric modelling in R.
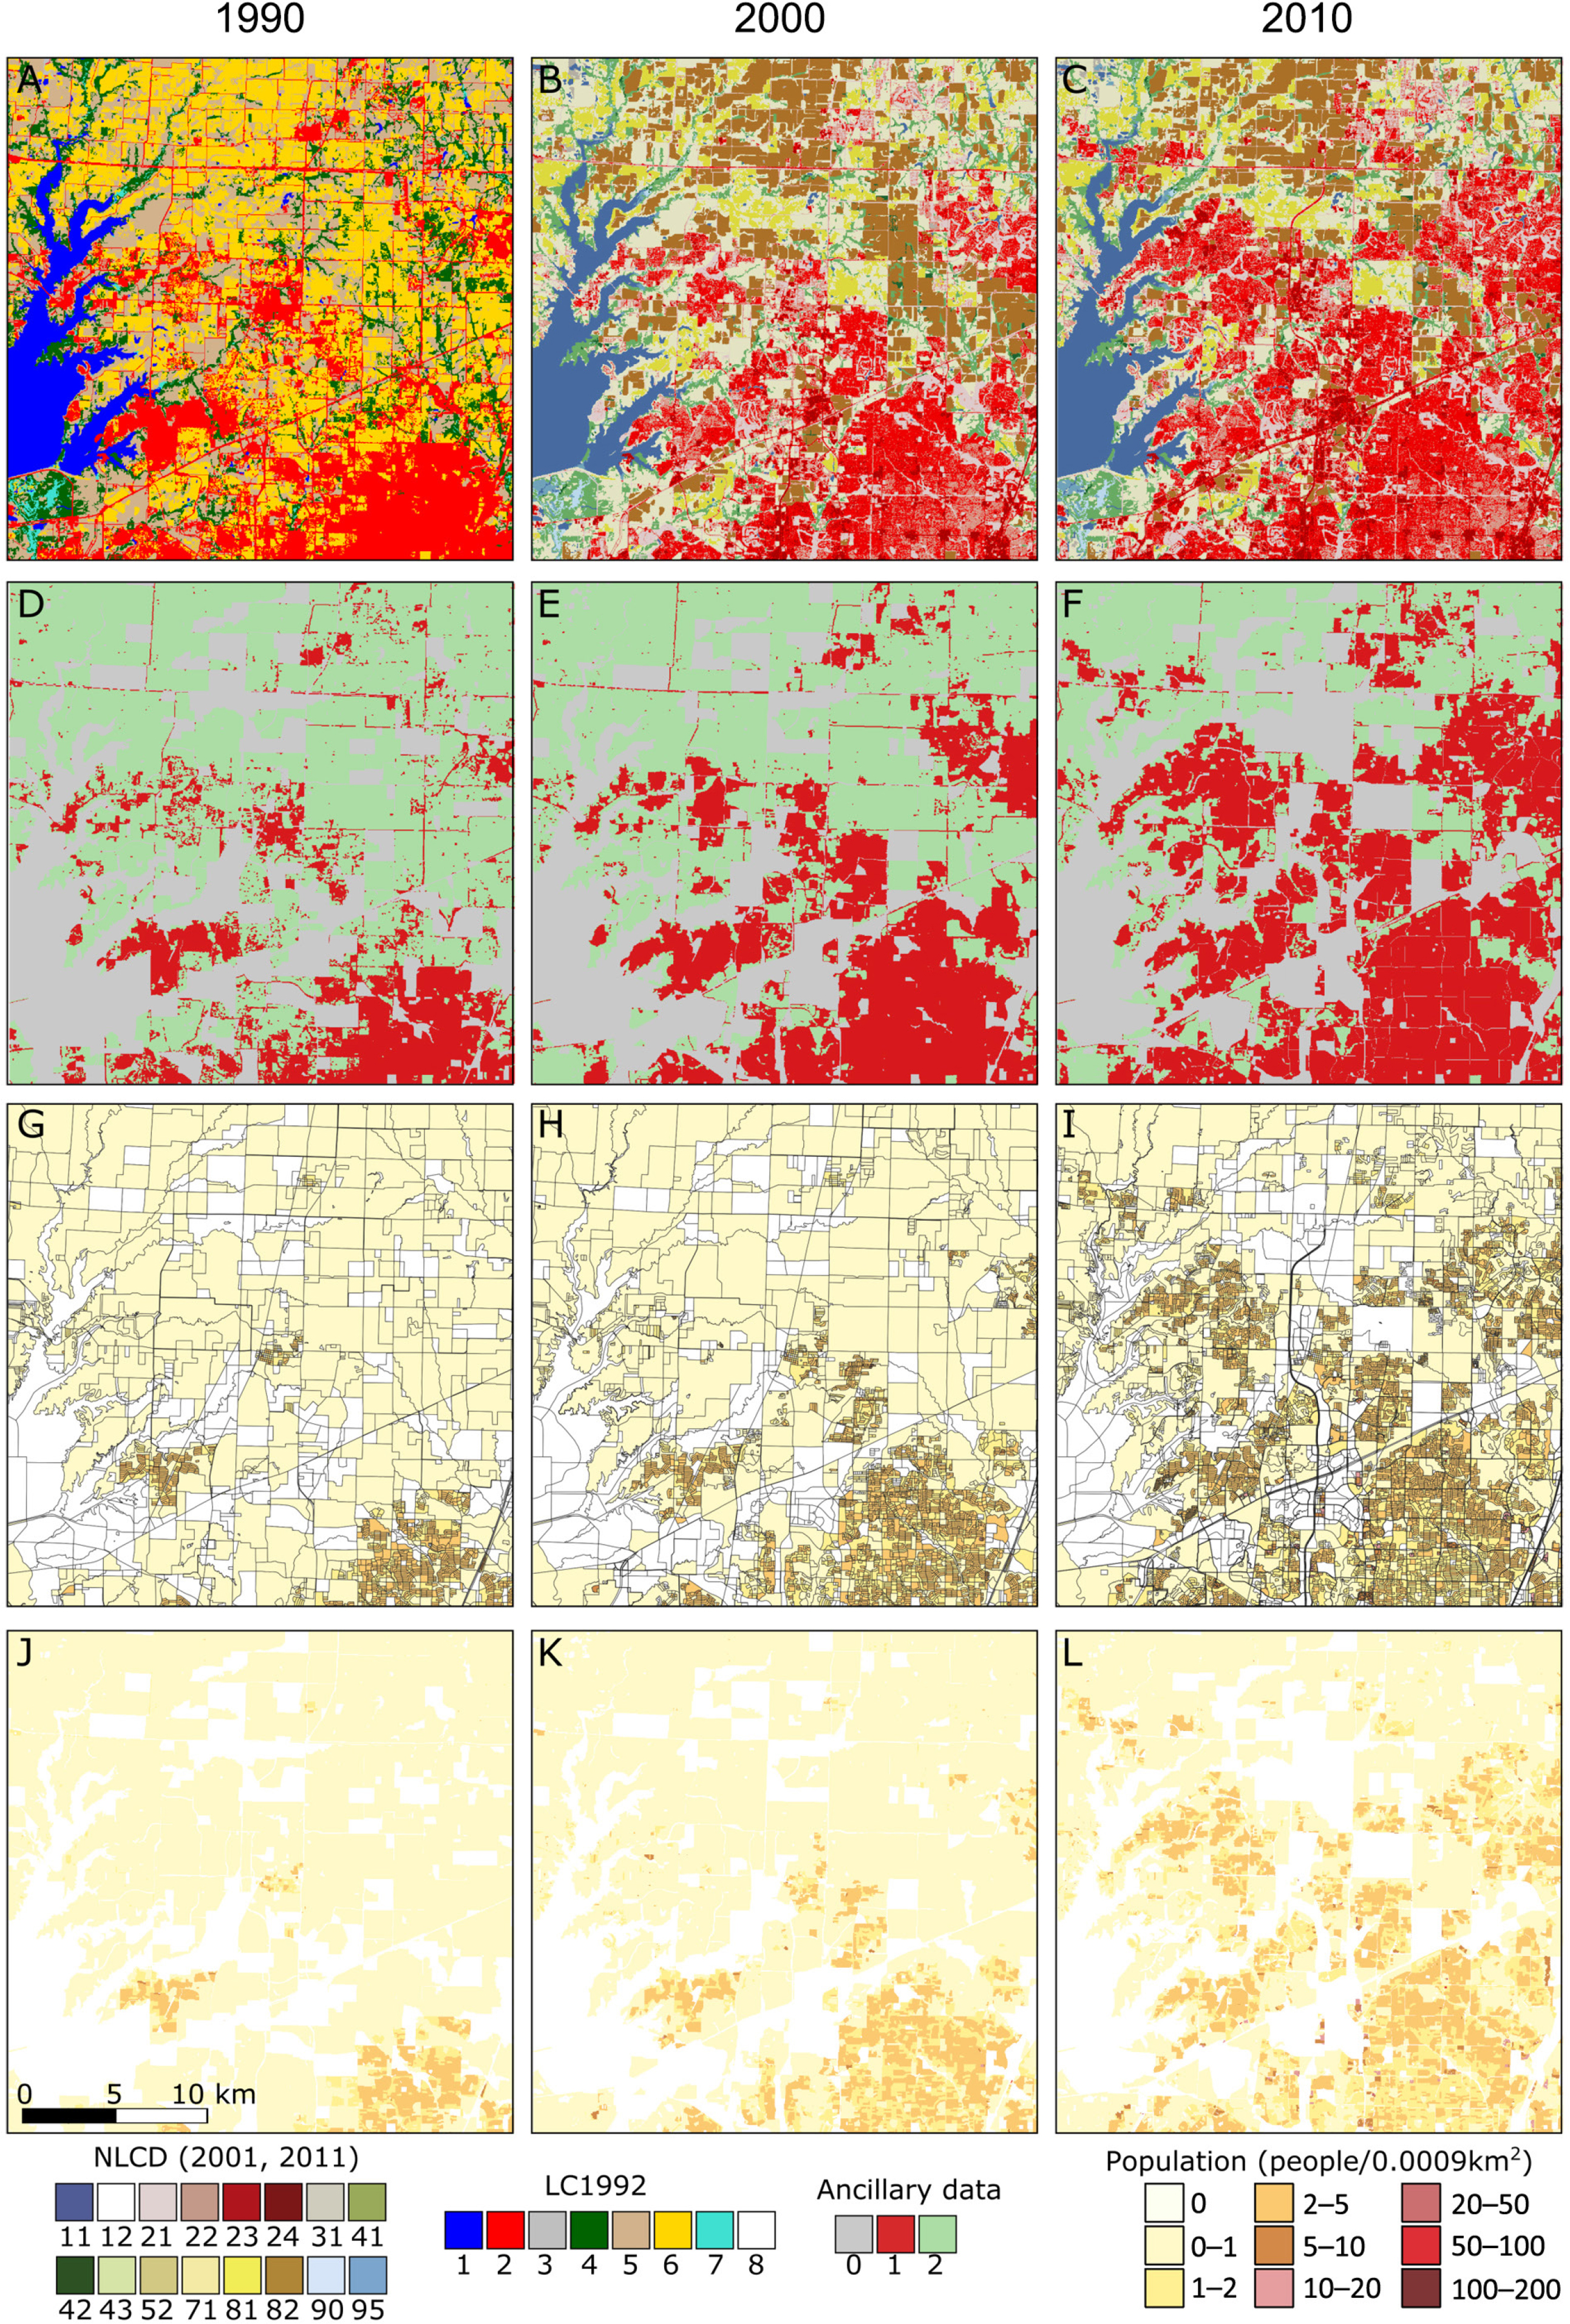
Fig. 3
The city of Frisco, TX located in Collin and Denton county.
(A) Land cover map for 1992 based on 1992/2001 Retrofit Land Cover Change Product. (B) NLCD 2001. (C) NLCD 2011. (D–F) Land cover data reclassified into 3 categories. (G–I) Block level population data. (J–L) Population density shown in 30 m resolution grids.
NLCD 2001, 2011: 11 – open water; 12 – ice/snow; 21 – developed, open space; 22 – developed, low intensity; 23 – developed, medium intensity; 24 – developed, high intensity; 31 – barren land; 41 – deciduous forest, 42 – evergreen forest, 43 – mixed forest, 52 – shrub/scrub; 71 – grassland; 81 – pasture/hay; 82 – cultivated crops, 90 – woody/wetlands, 95 – emergent wetlands.
LC1992: 1 – open water; 2 – urban; 3 – barren; 4 – forest; 5 – grass/shrub; 6 – wetlands; 7 – wetlands; 8 – ice/snow
Ancillary data: 0 – uninhabited; 1 – urban areas; 2 – nonurban areas.