
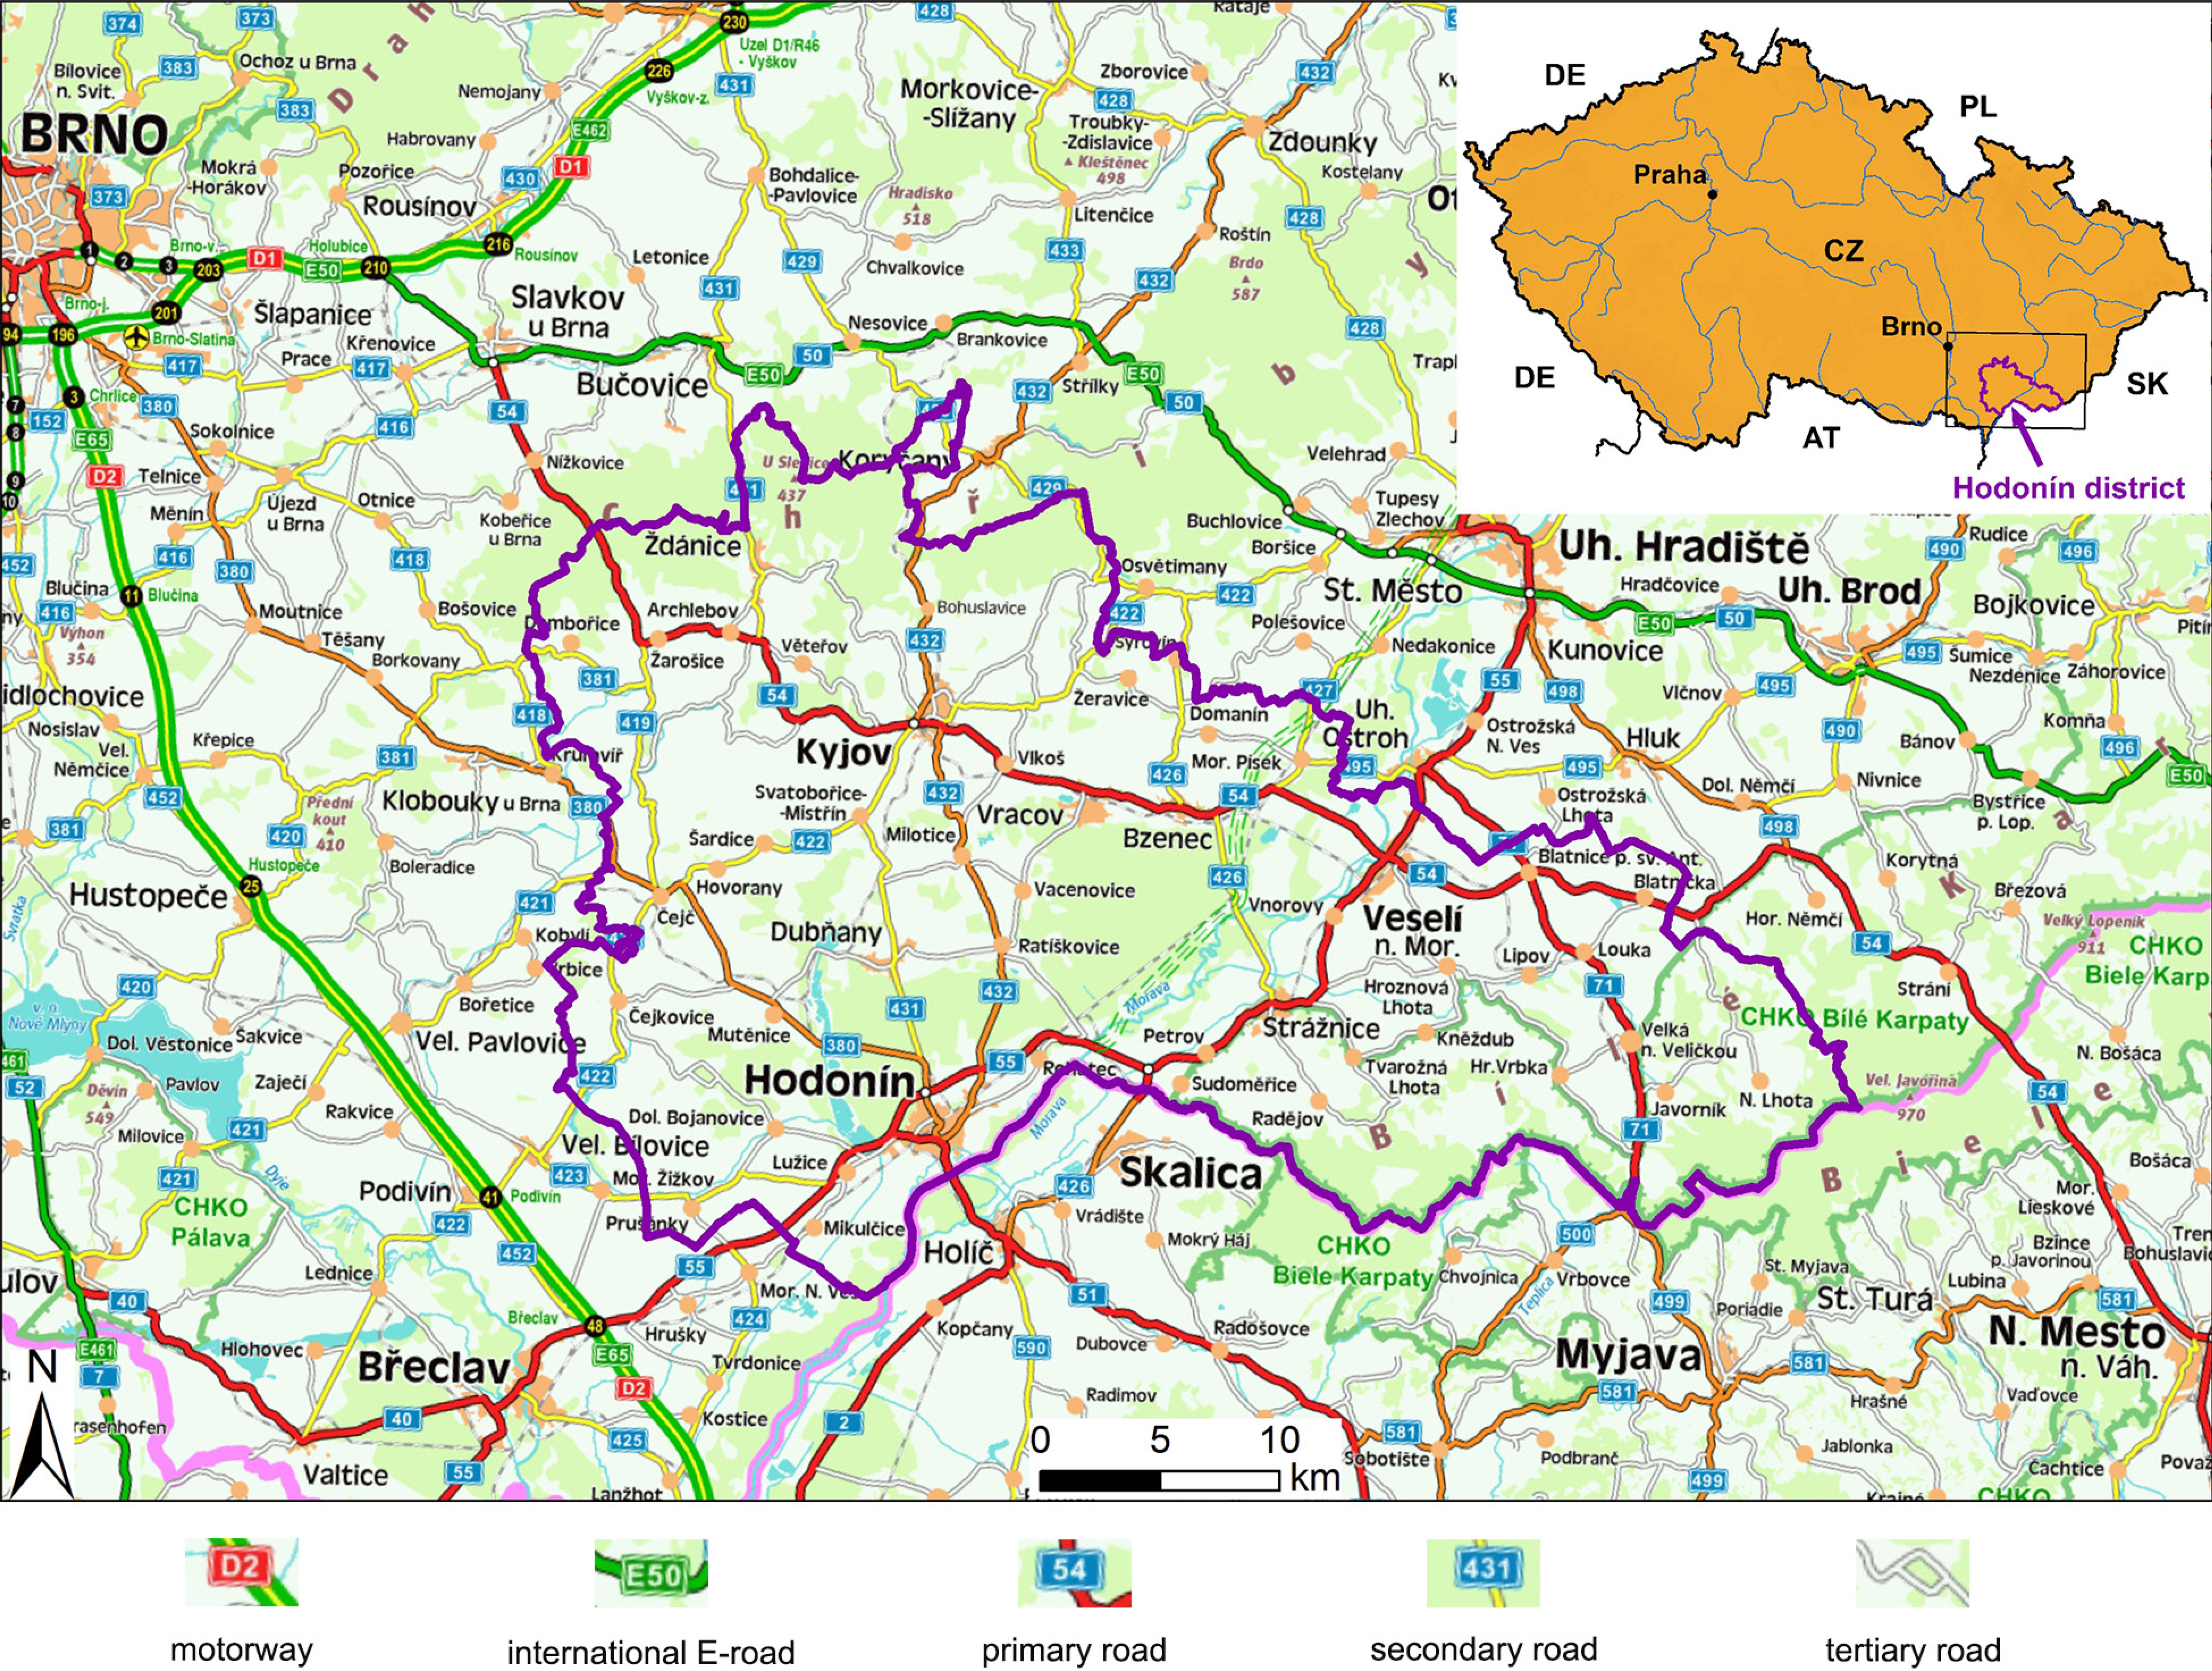
Fig. 1
The Hodonín model region and surroundings with important roads.
Source: Czech National Geoportal, CENIA, 2017.
Table 1
Topographic maps covering the Hodonín region.
| Name of the map set | Scale | Year of publishing | Time period |
|---|---|---|---|
| The 2nd Austrian Military Survey | 1:28,800 | 1836–1841 | 1840s |
| The 3rd Austrian Military Survey | 1:25,000 | 1876 | 1880s |
| Czechoslovak military topographic maps | 1:25,000 | 1953–1955 | 1950s |
| Czechoslovak military topographic maps | 1:25,000 | 1991 | 1990s |
| Czech topographic base maps | 1:10,000 | 2016 | 2010s |
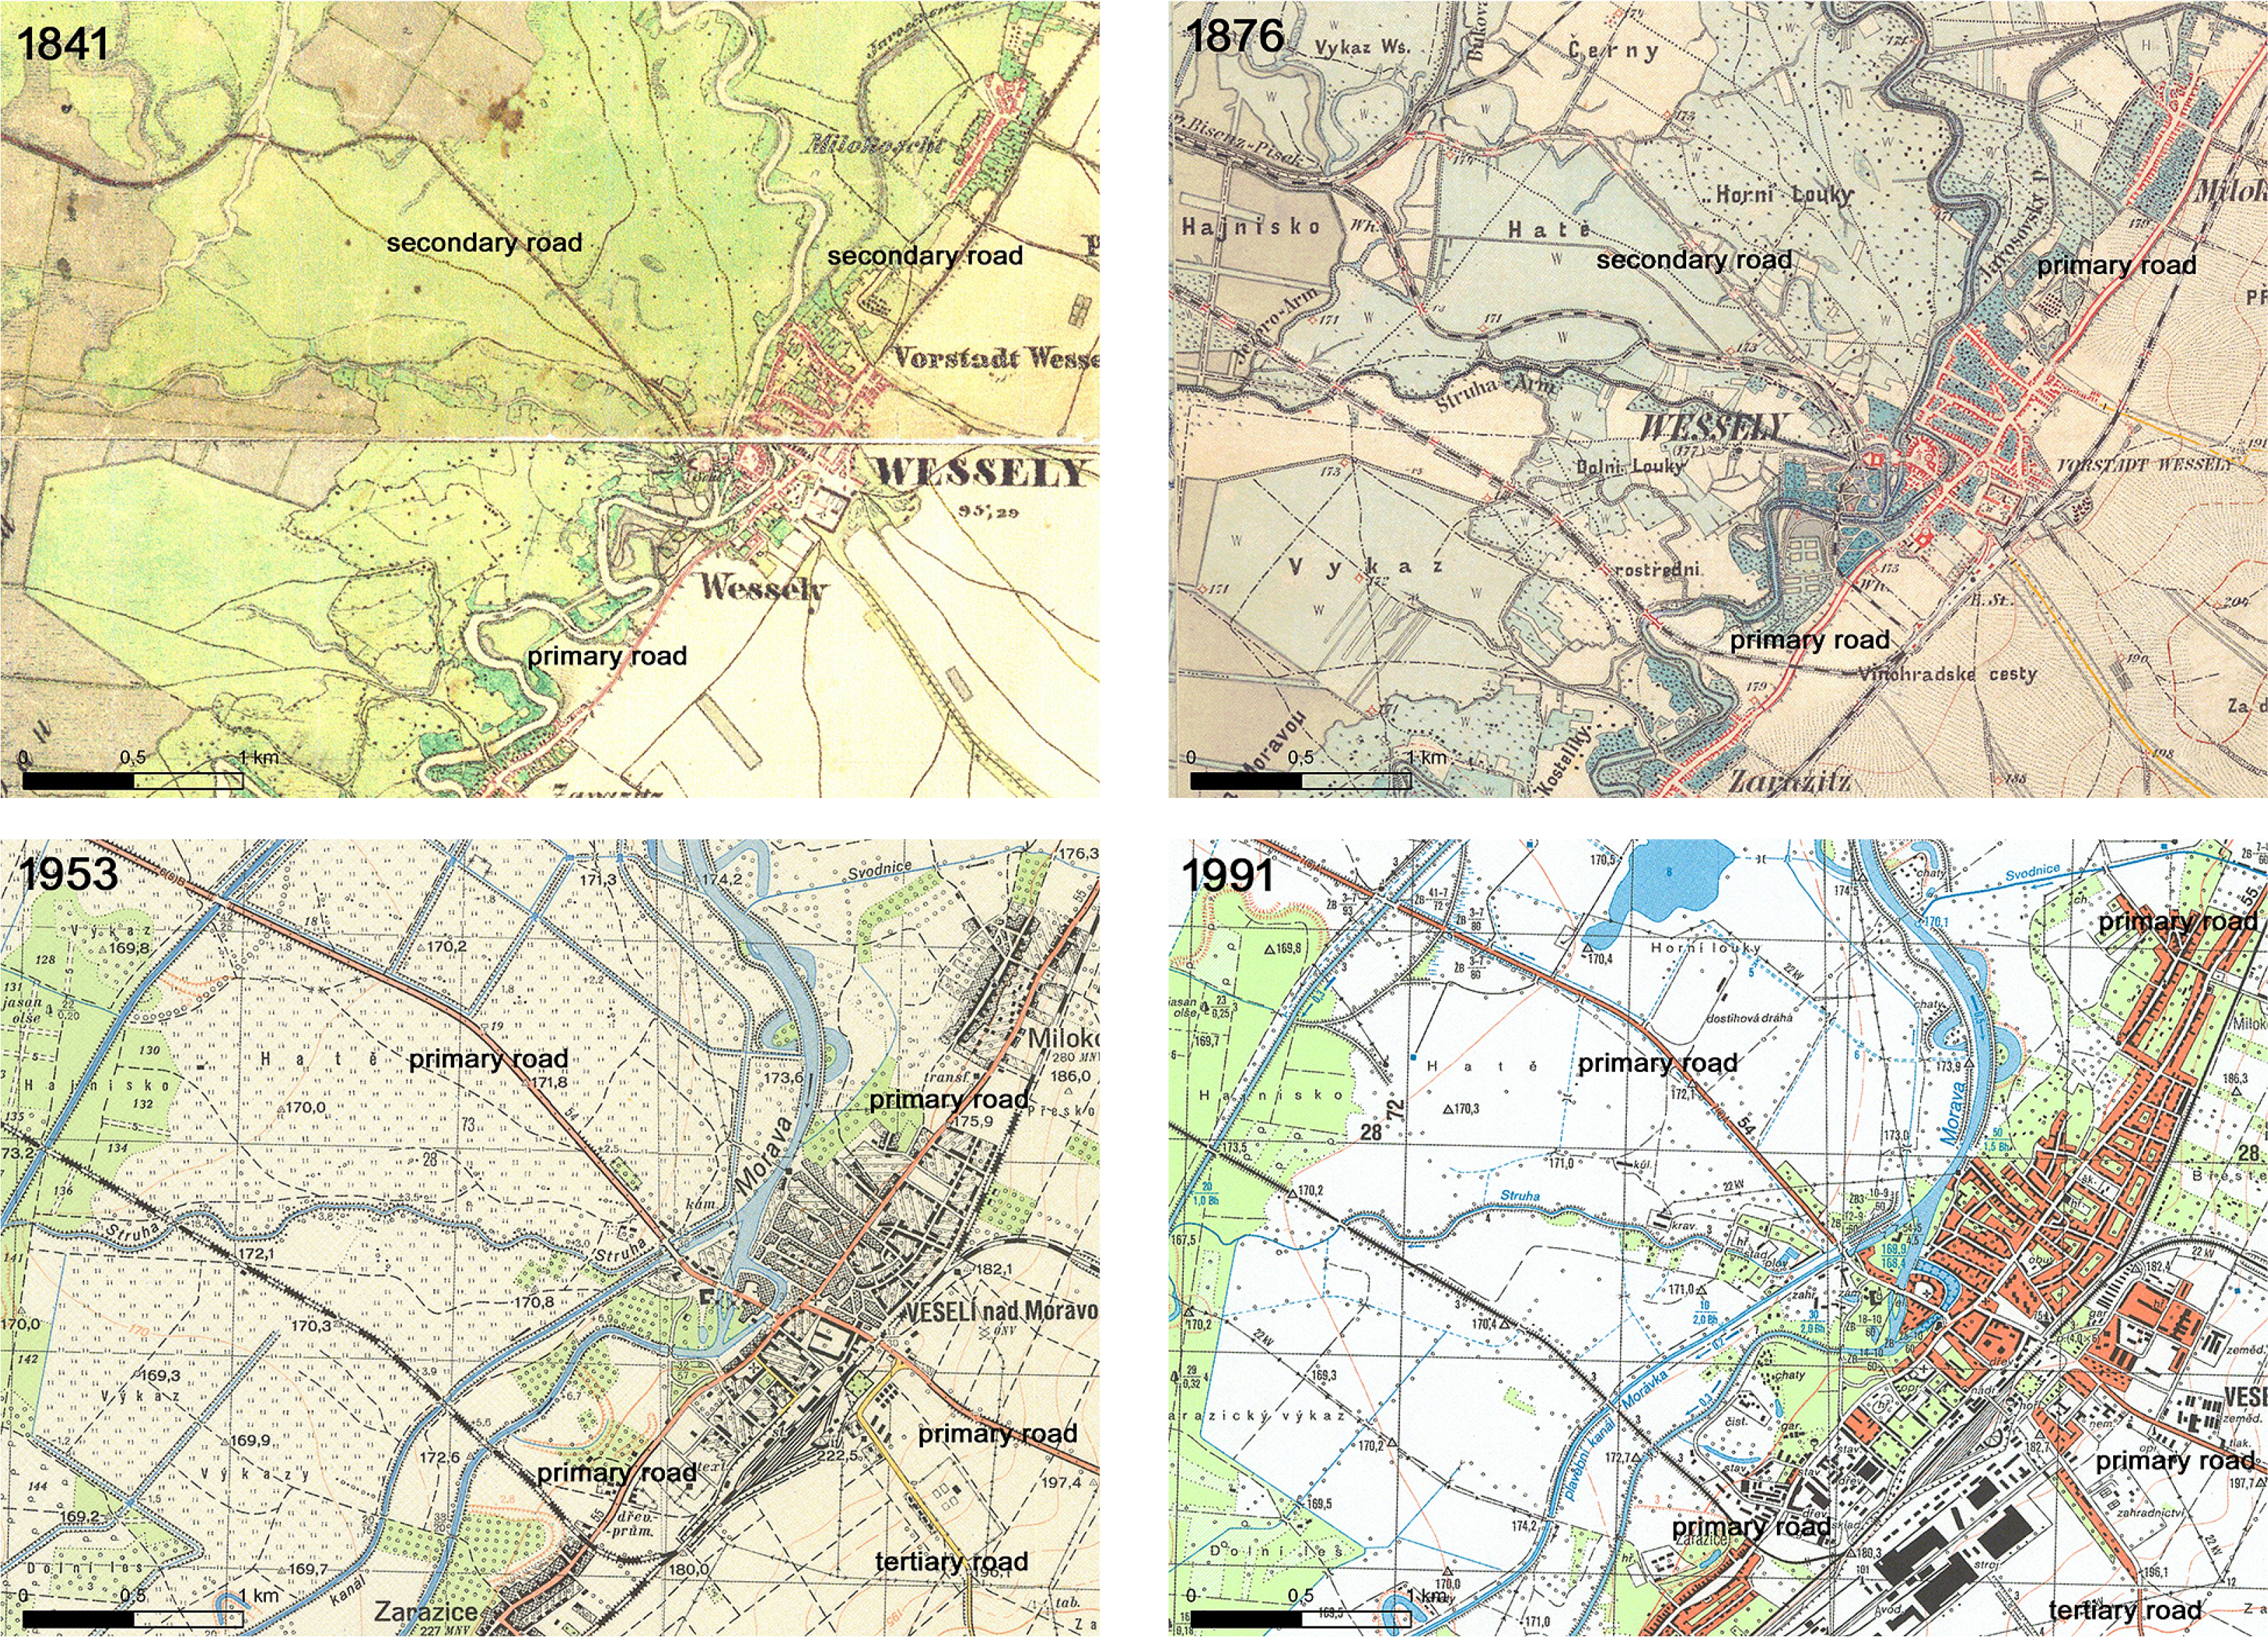
Fig. 2
Examples of the road network around the town of Veselí nad Moravou on maps from 1841, 1876, 1953, 1991 with the addition of road classification to the map.
Source: State Archive/Military Archive, Vienna, Geoinformatics laboratory, J. E. Purkyně University, Ústí nad Labem, Map collection Faculty of Science, Charles University of Prague, Military Geographic and Hydrometeorologic Office, Dobruška.
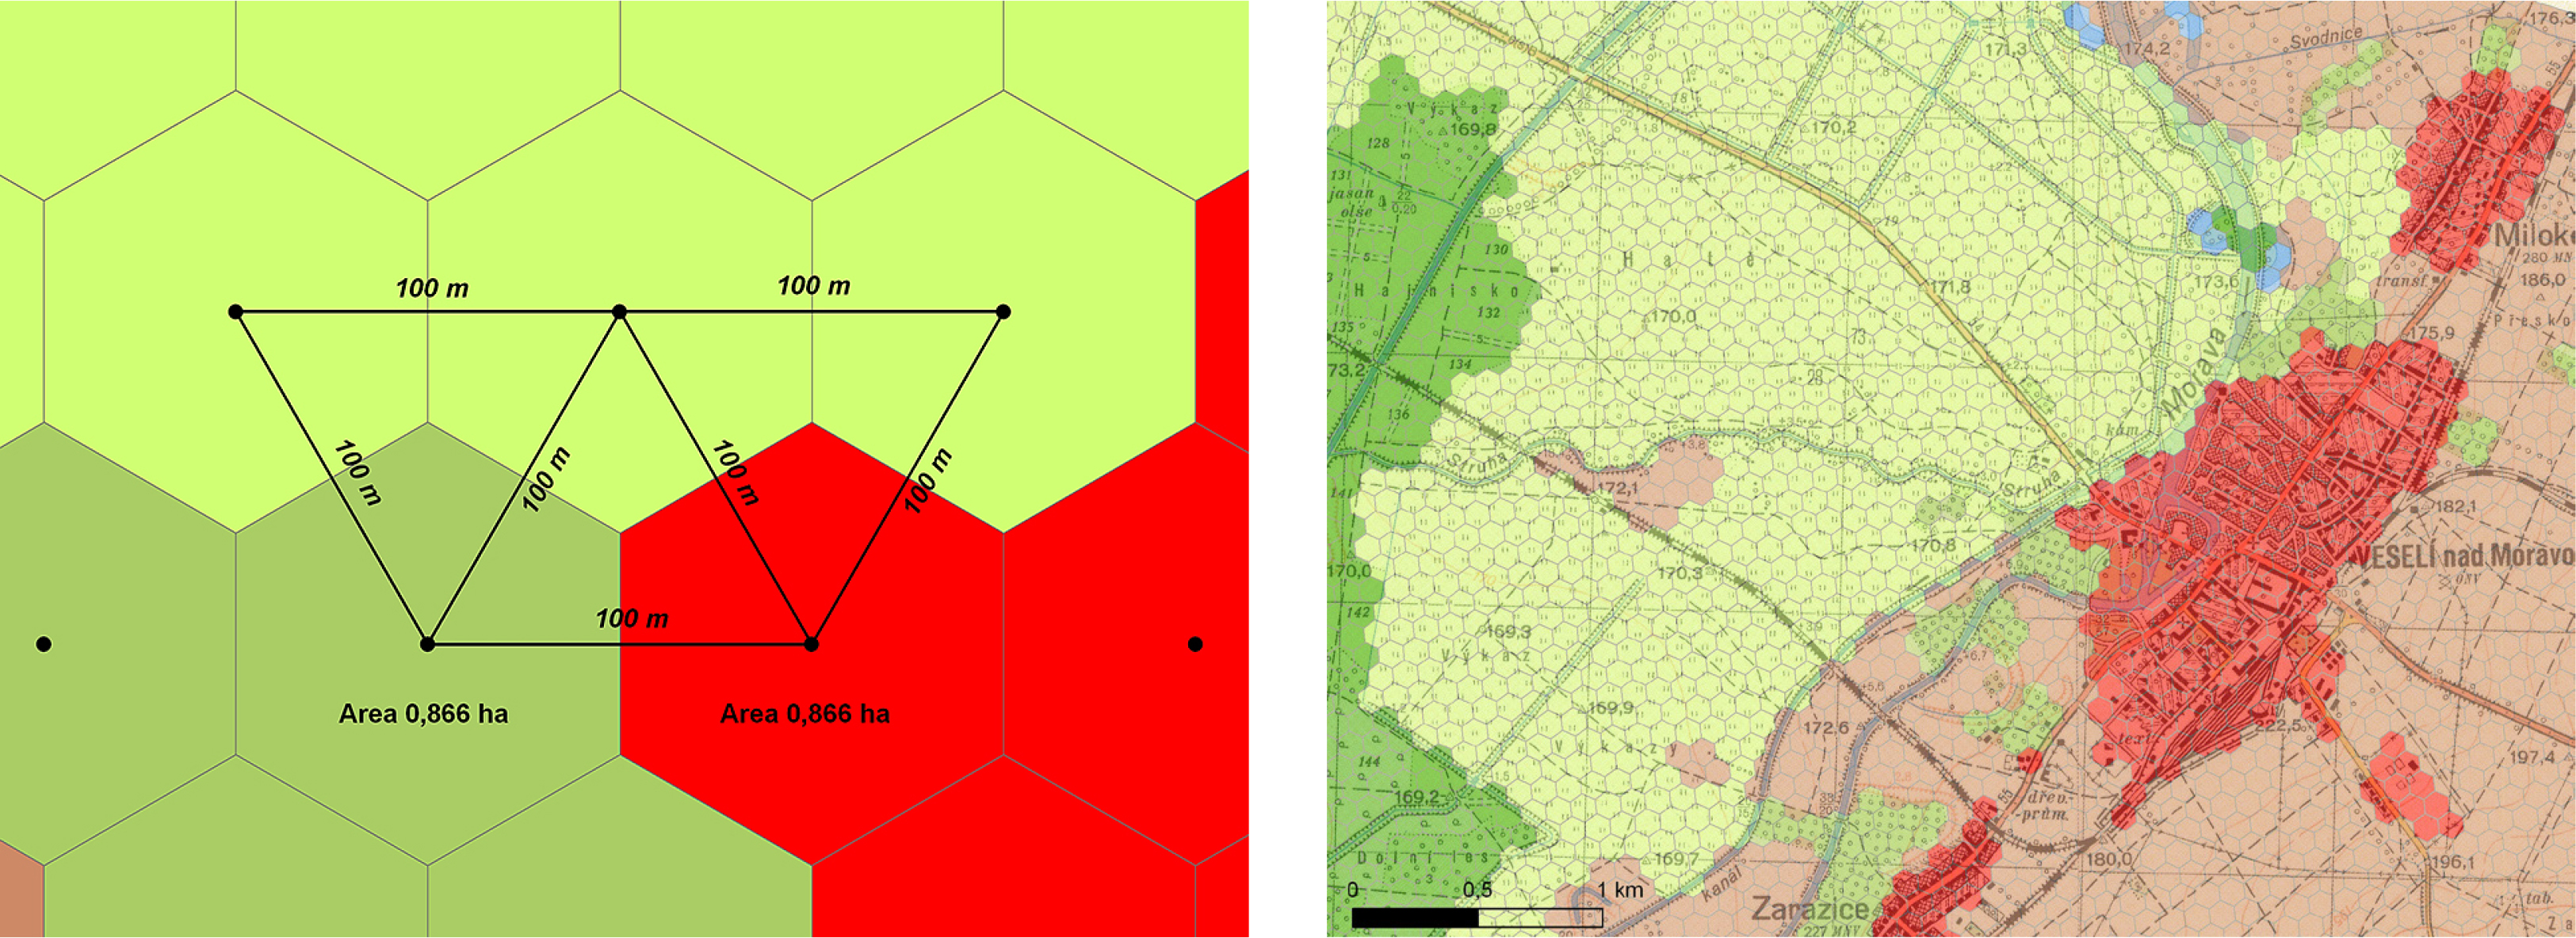
Fig. 3
Example of a hexagonal grid and the interpreted land use map from 1955.
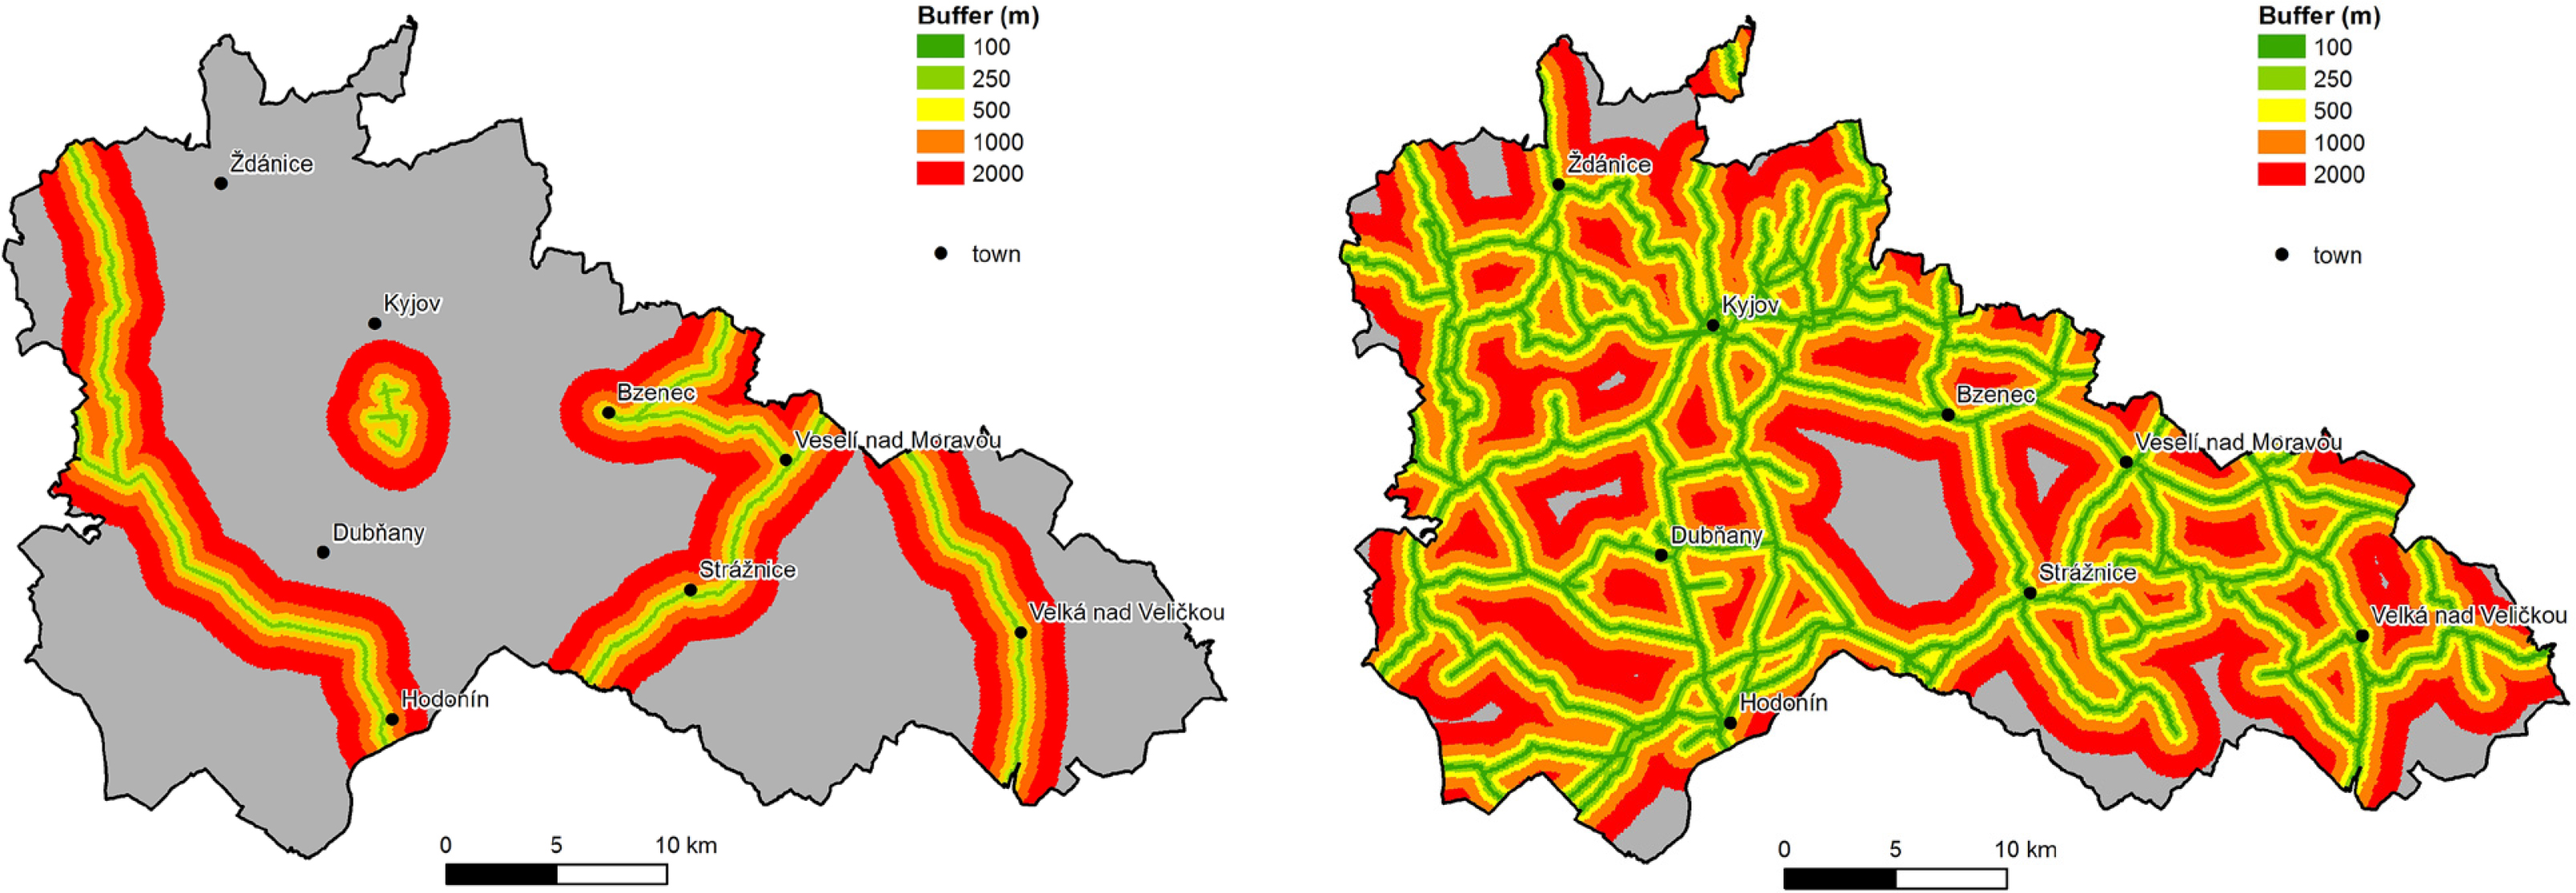
Fig. 4
The road network in the Hodonín region in the 1840s (left) and 2010s (right) with distance zones from a road axis.
Table 2
Lengths of road classes in the Hodonín region (in km) in the 1840s, 1880s, 1950s, 1990s, and 2010s.
| Road class | Primary | Secondary | Tertiary | Total |
|---|---|---|---|---|
| 1840s | 59.5 | 16.8 | 24.6 | 100.9 |
| 1880s | 88.3 | 6.4 | 155.0 | 249.7 |
| 1950s | 85.2 | 99.3 | 327.8 | 512.3 |
| 1990s | 122.1 | 163.3 | 247.8 | 533.2 |
| 2010s | 114.4 | 171.8 | 247.8 | 534.0 |
Table 3
Land use in the Hodonín region (proportion in%) in the 1840s, 1880s, 1950s, 1990s, 2010s.
| Land use | 1840s | 1880s | 1950s | 1990s | 2010s |
|---|---|---|---|---|---|
| Arable land | 45.60 | 54.45 | 57.56 | 51.28 | 50.94 |
| Permanent grassland | 26.24 | 16.66 | 8.71 | 6.48 | 6.85 |
| Garden and orchard | 0.85 | 0.42 | 1.52 | 2.15 | 2.36 |
| Vineard and hop-field | 3.50 | 3.00 | 2.18 | 5.22 | 3.93 |
| Forest | 20.93 | 22.96 | 24.93 | 26.30 | 27.10 |
| Water area | 0.67 | 0.05 | 0.46 | 0.57 | 0.66 |
| Built-up area | 2.21 | 2.44 | 4.49 | 7.53 | 7.68 |
| Recreational area | 0.00 | 0.00 | 0.02 | 0.29 | 0.34 |
| Other area | 0.00 | 0.02 | 0.13 | 0.18 | 0.14 |
| Total | 100.00 | 100.00 | 100.00 | 100.00 | 100.00 |
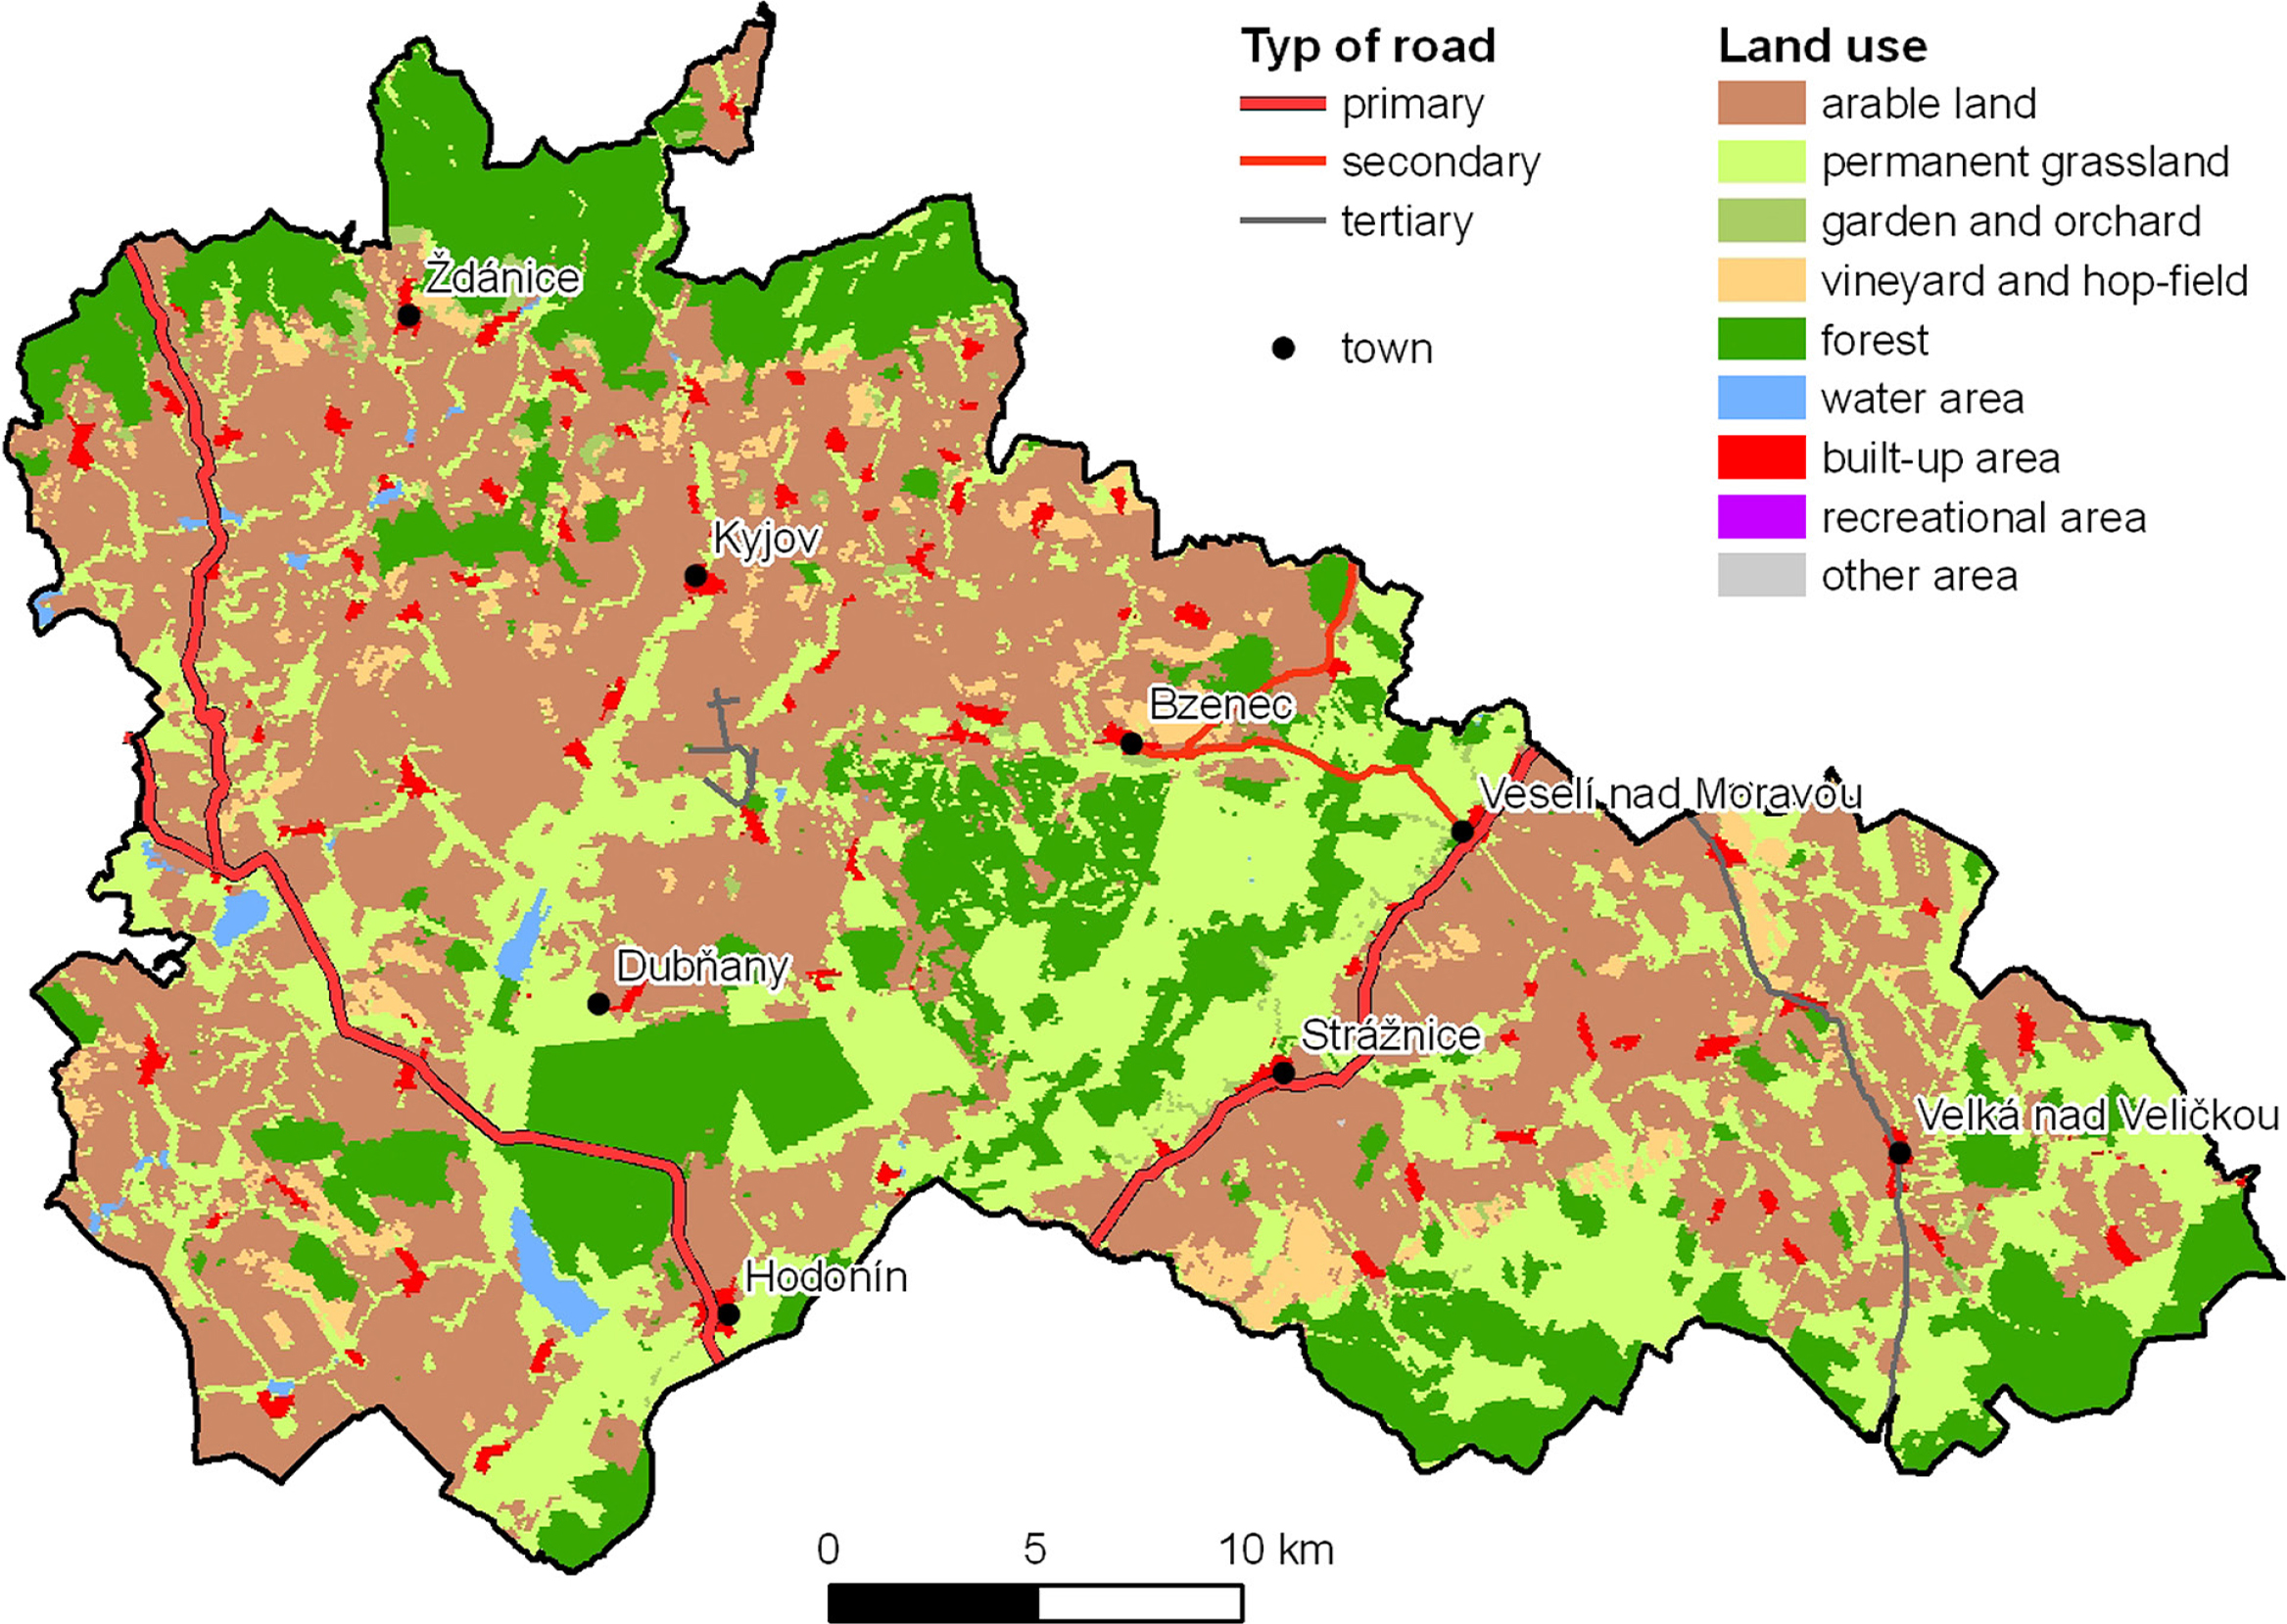
Fig. 5
The road network and land use in the Hodonín region in the 1840s.
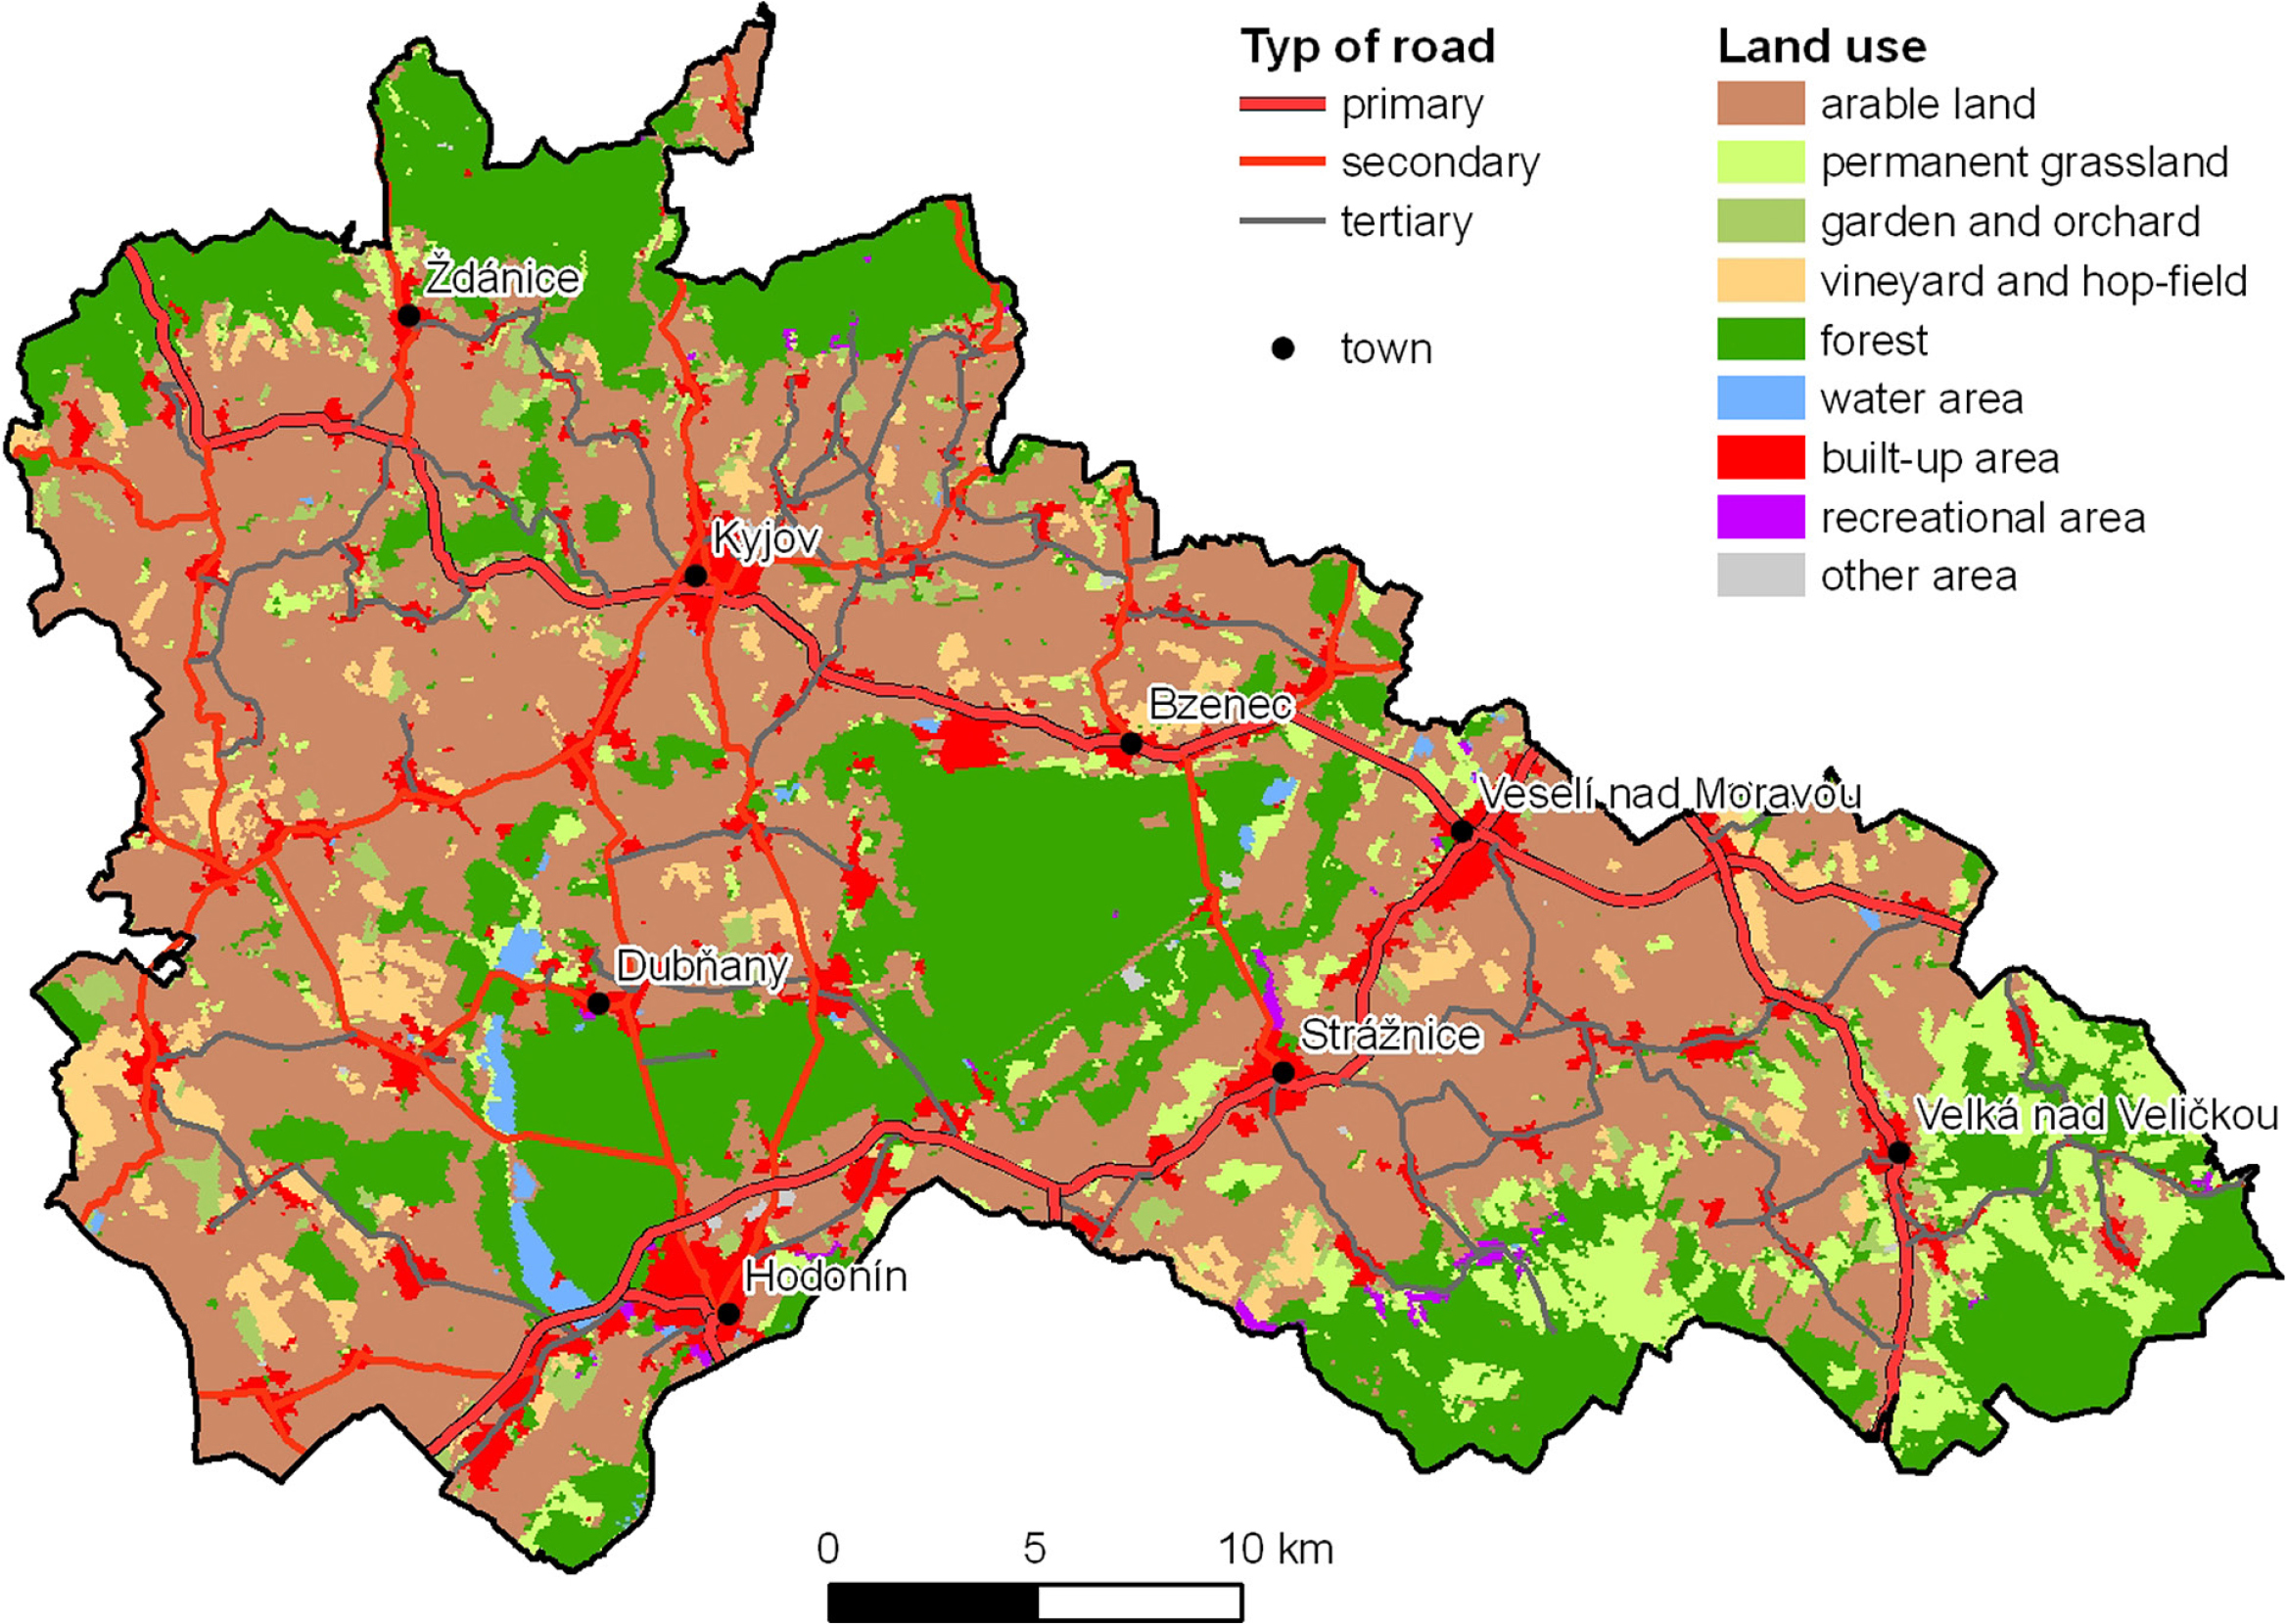
Fig. 6
The road network and land use in the Hodonín region in the 2010s.
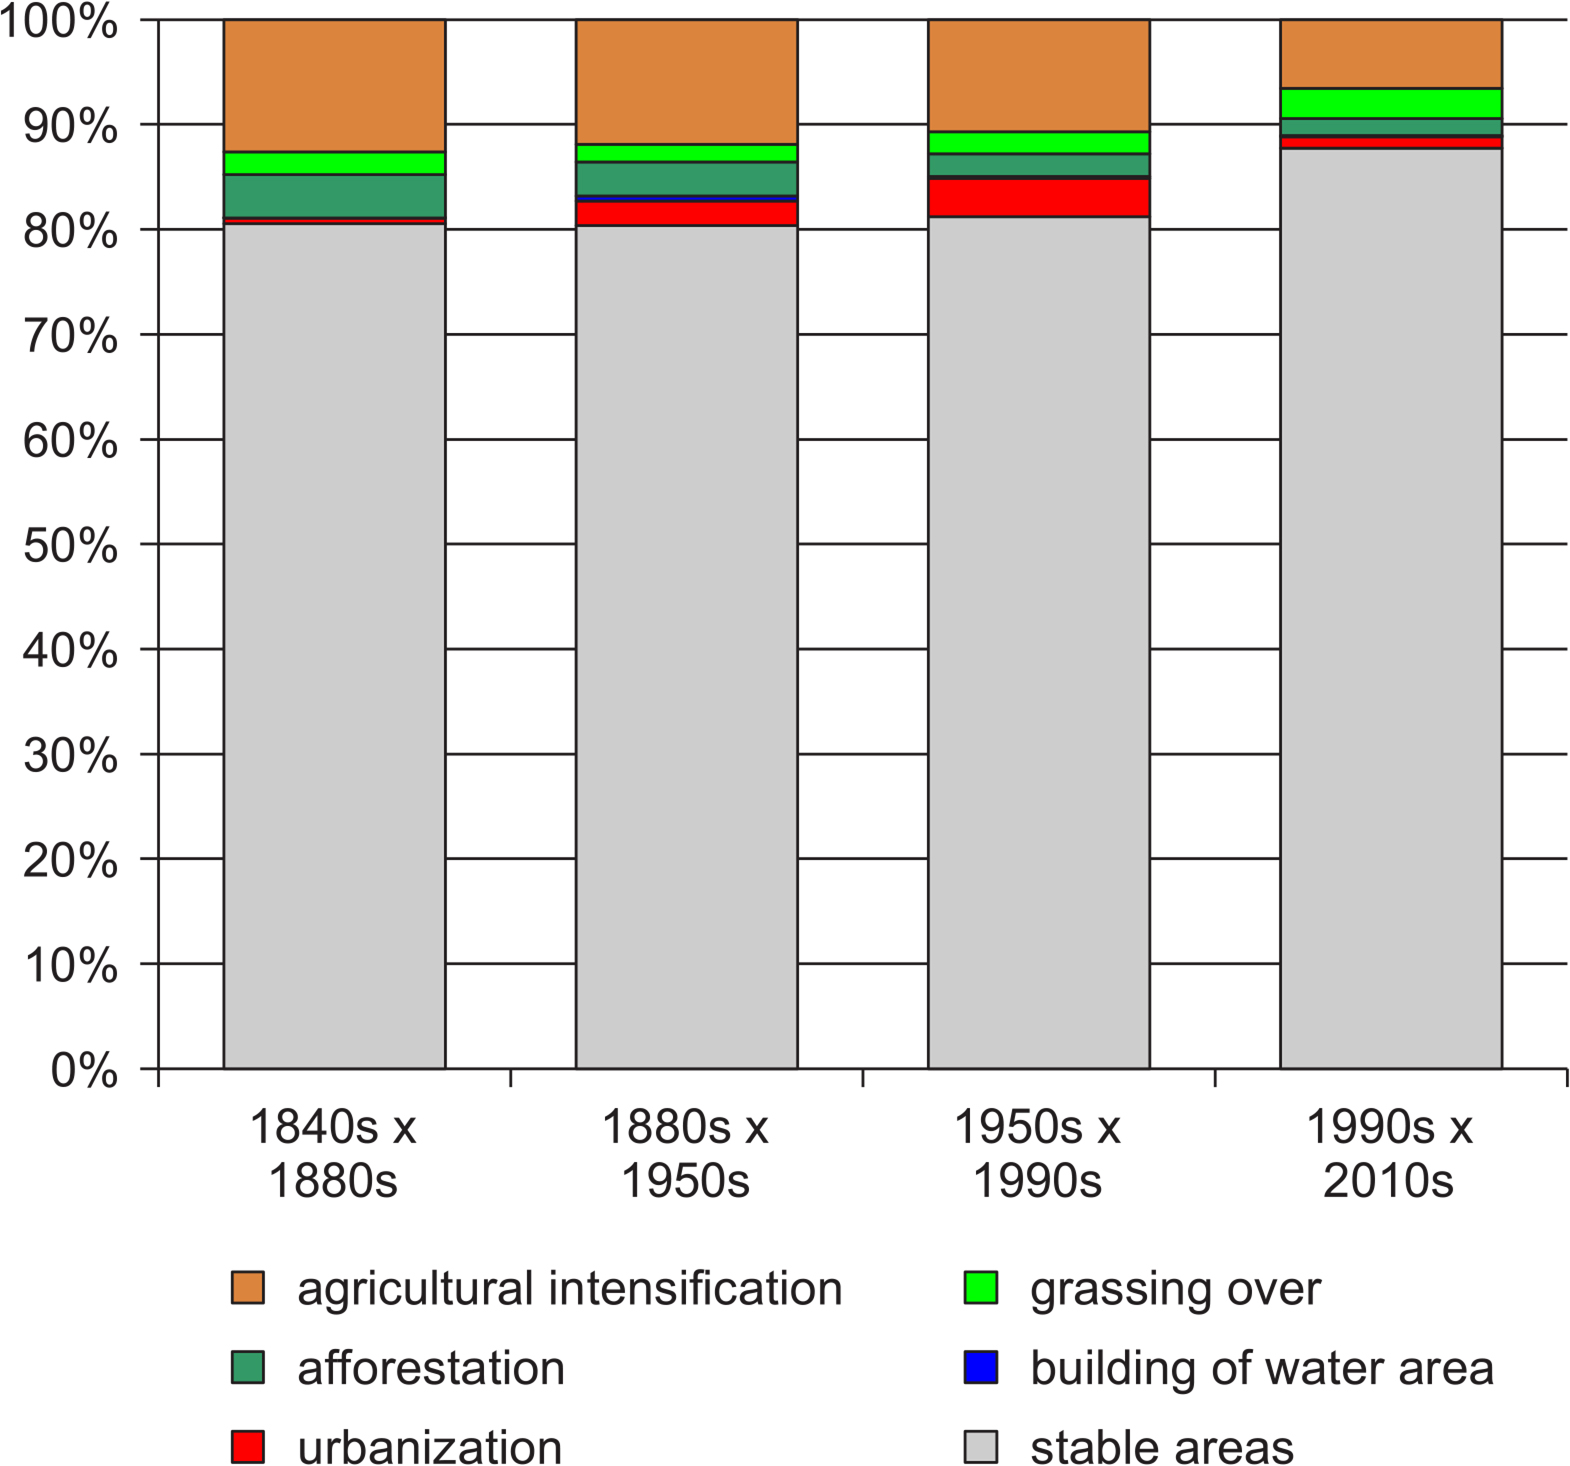
Fig. 7
Land use change processes in the Hodonín region in four comparative periods.
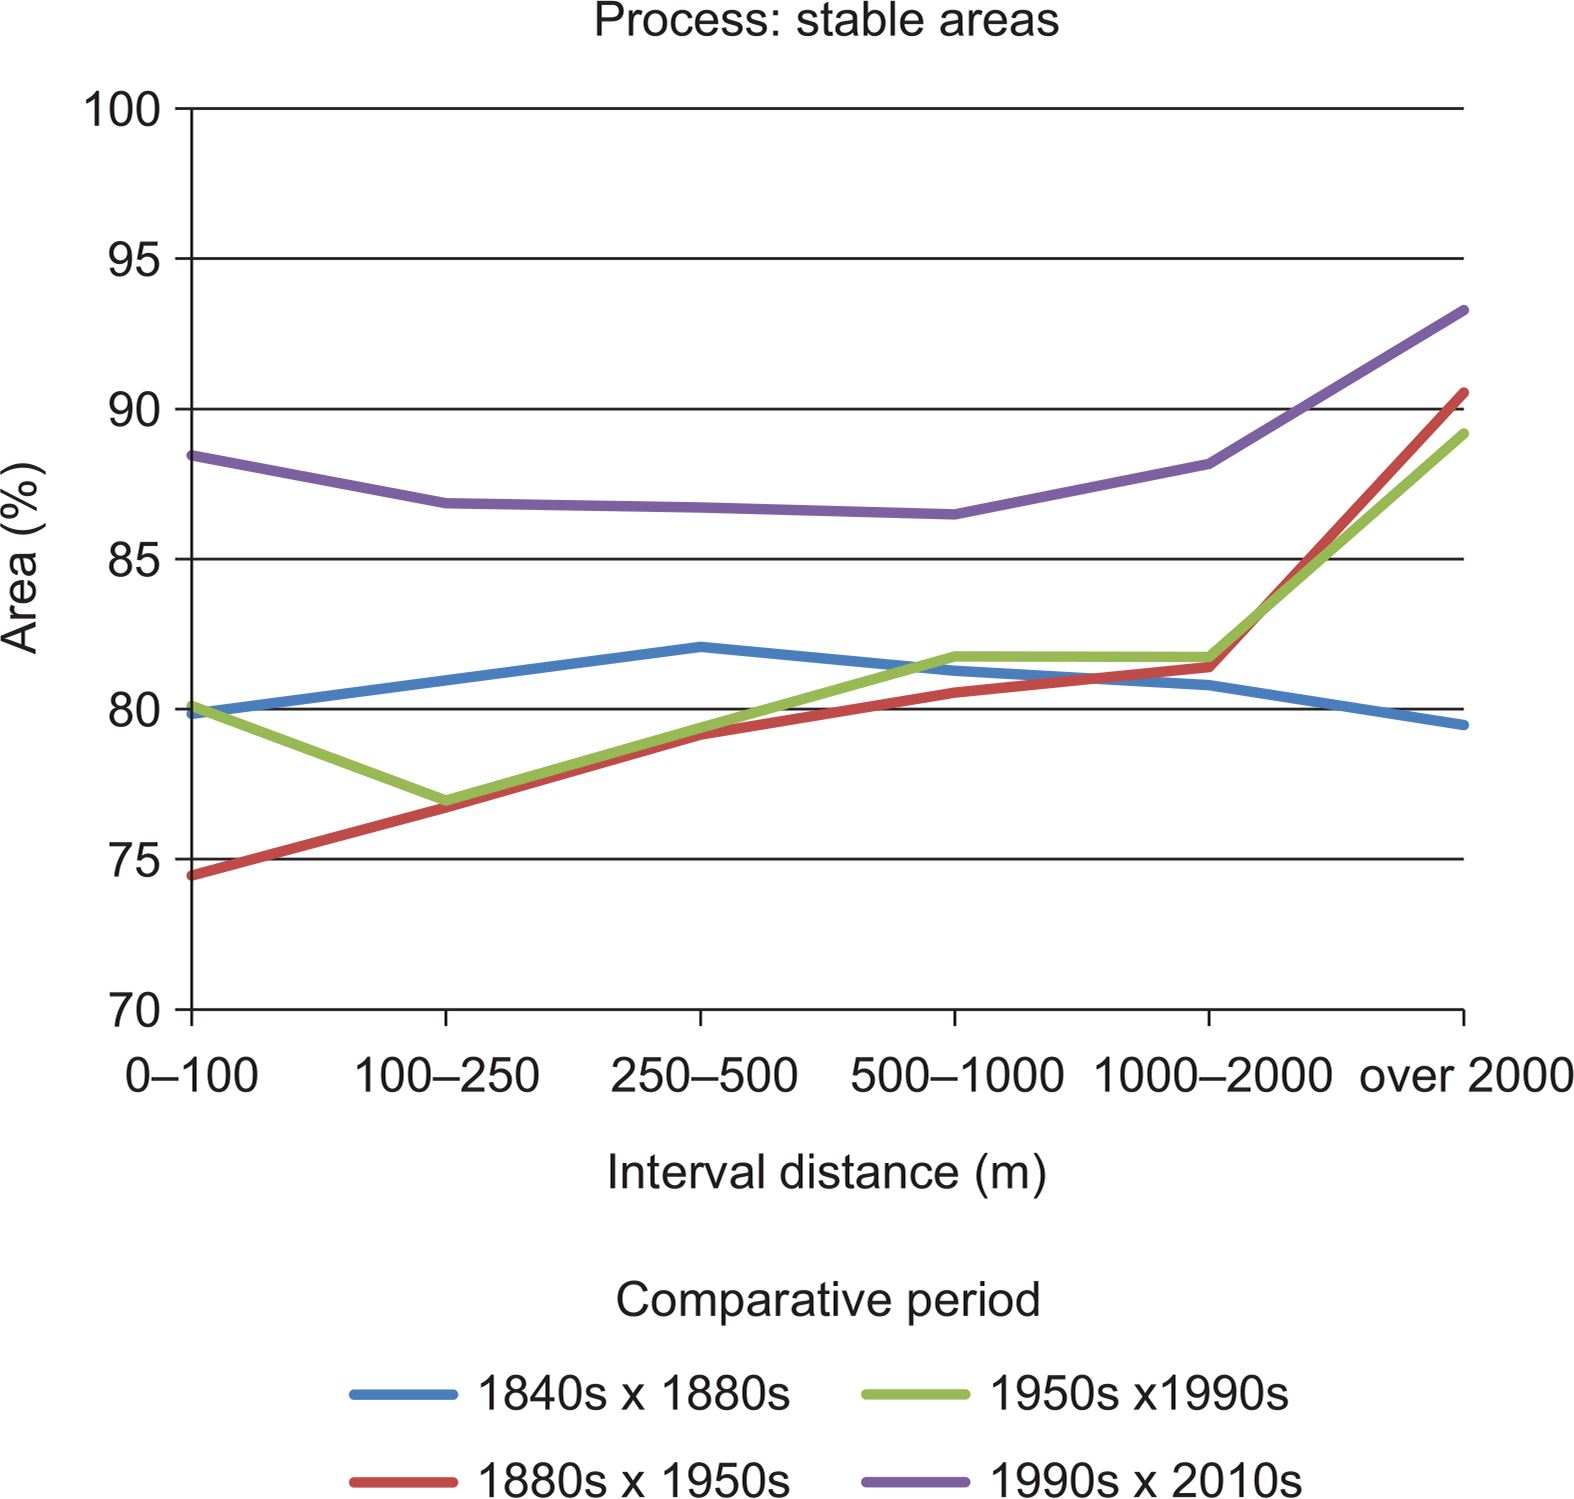
Fig. 8
The proportion (%) of stably used areas in the Hodonín region at various distances from existing roads.
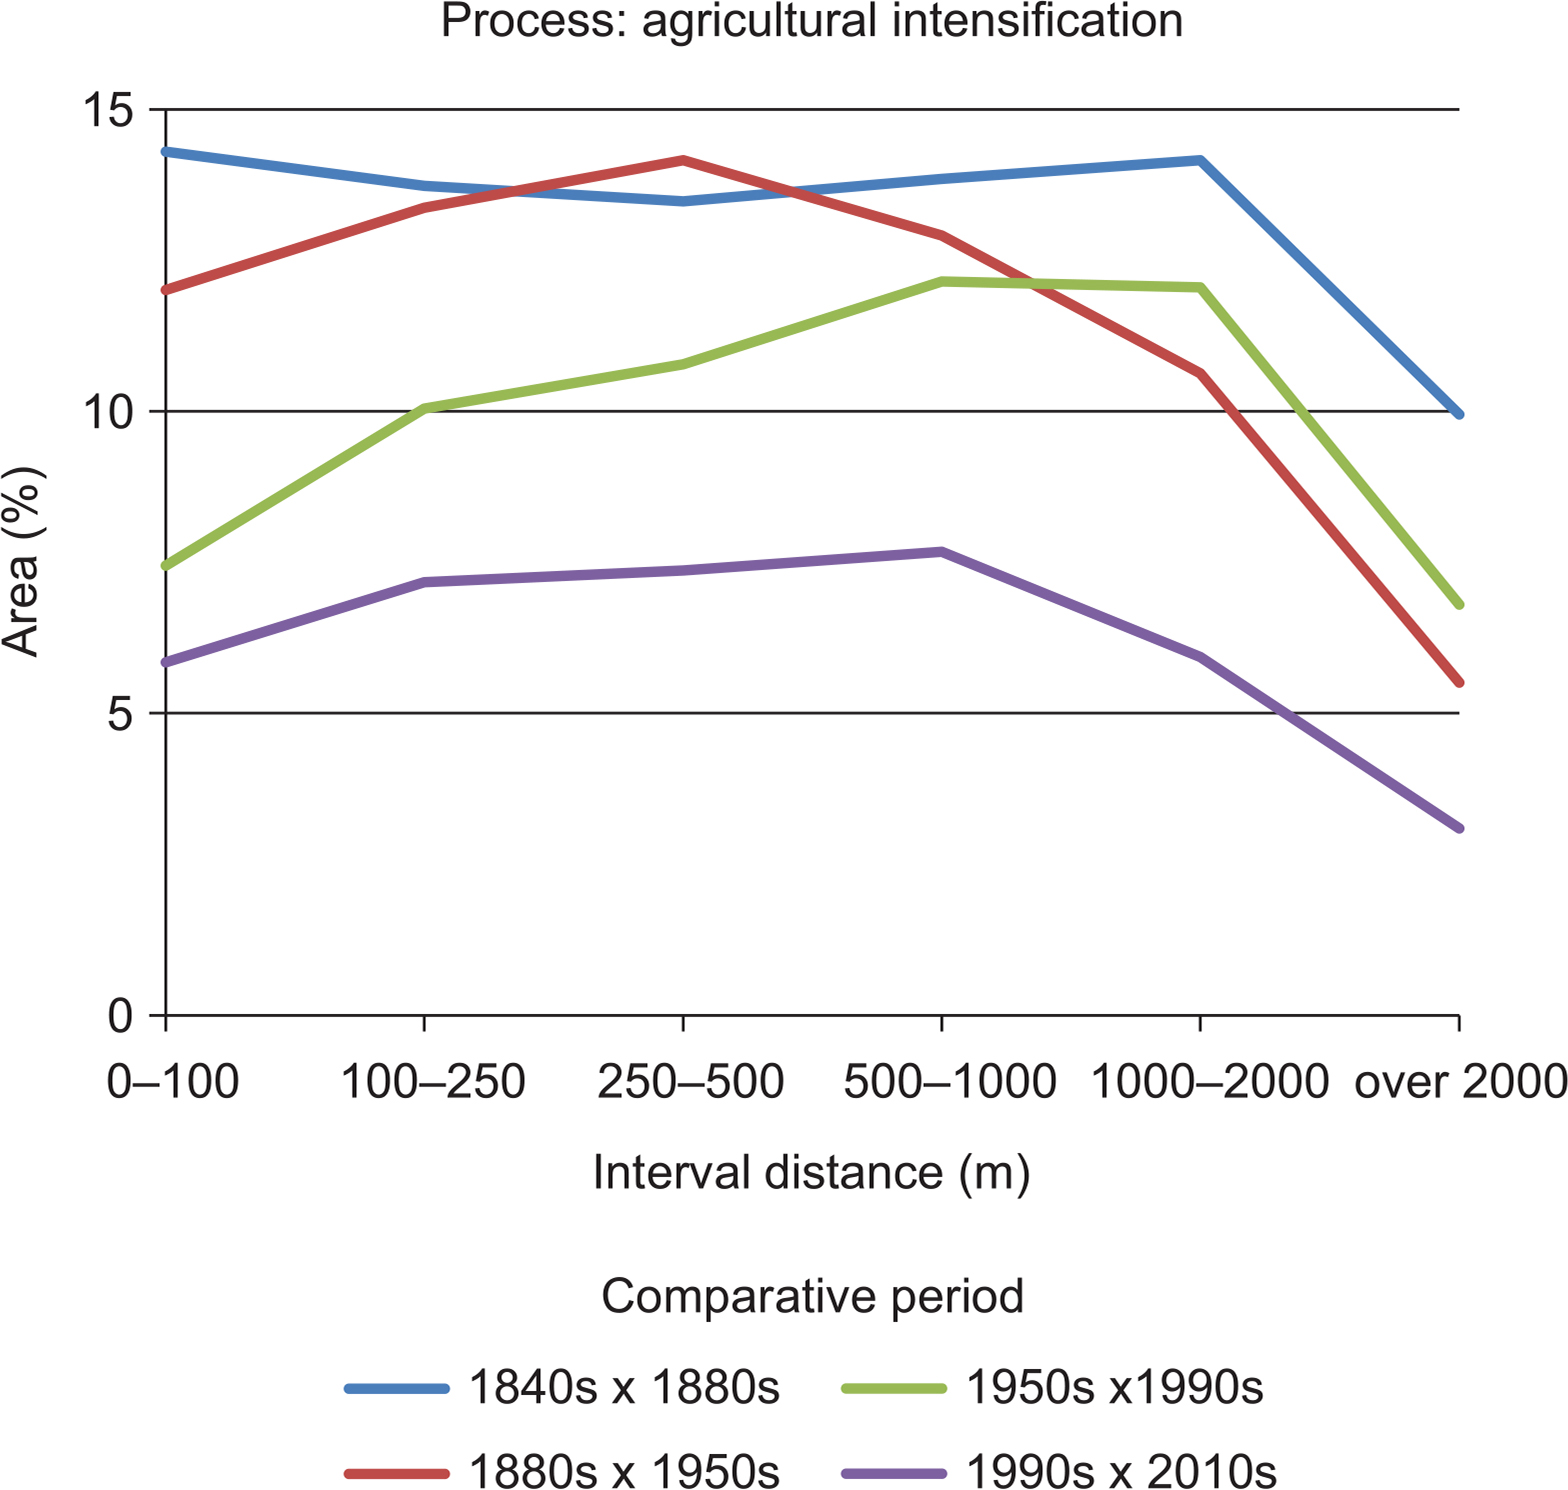
Fig. 9
Agricultural intensification (in%) in the Hodonín region at various distances from existing roads.
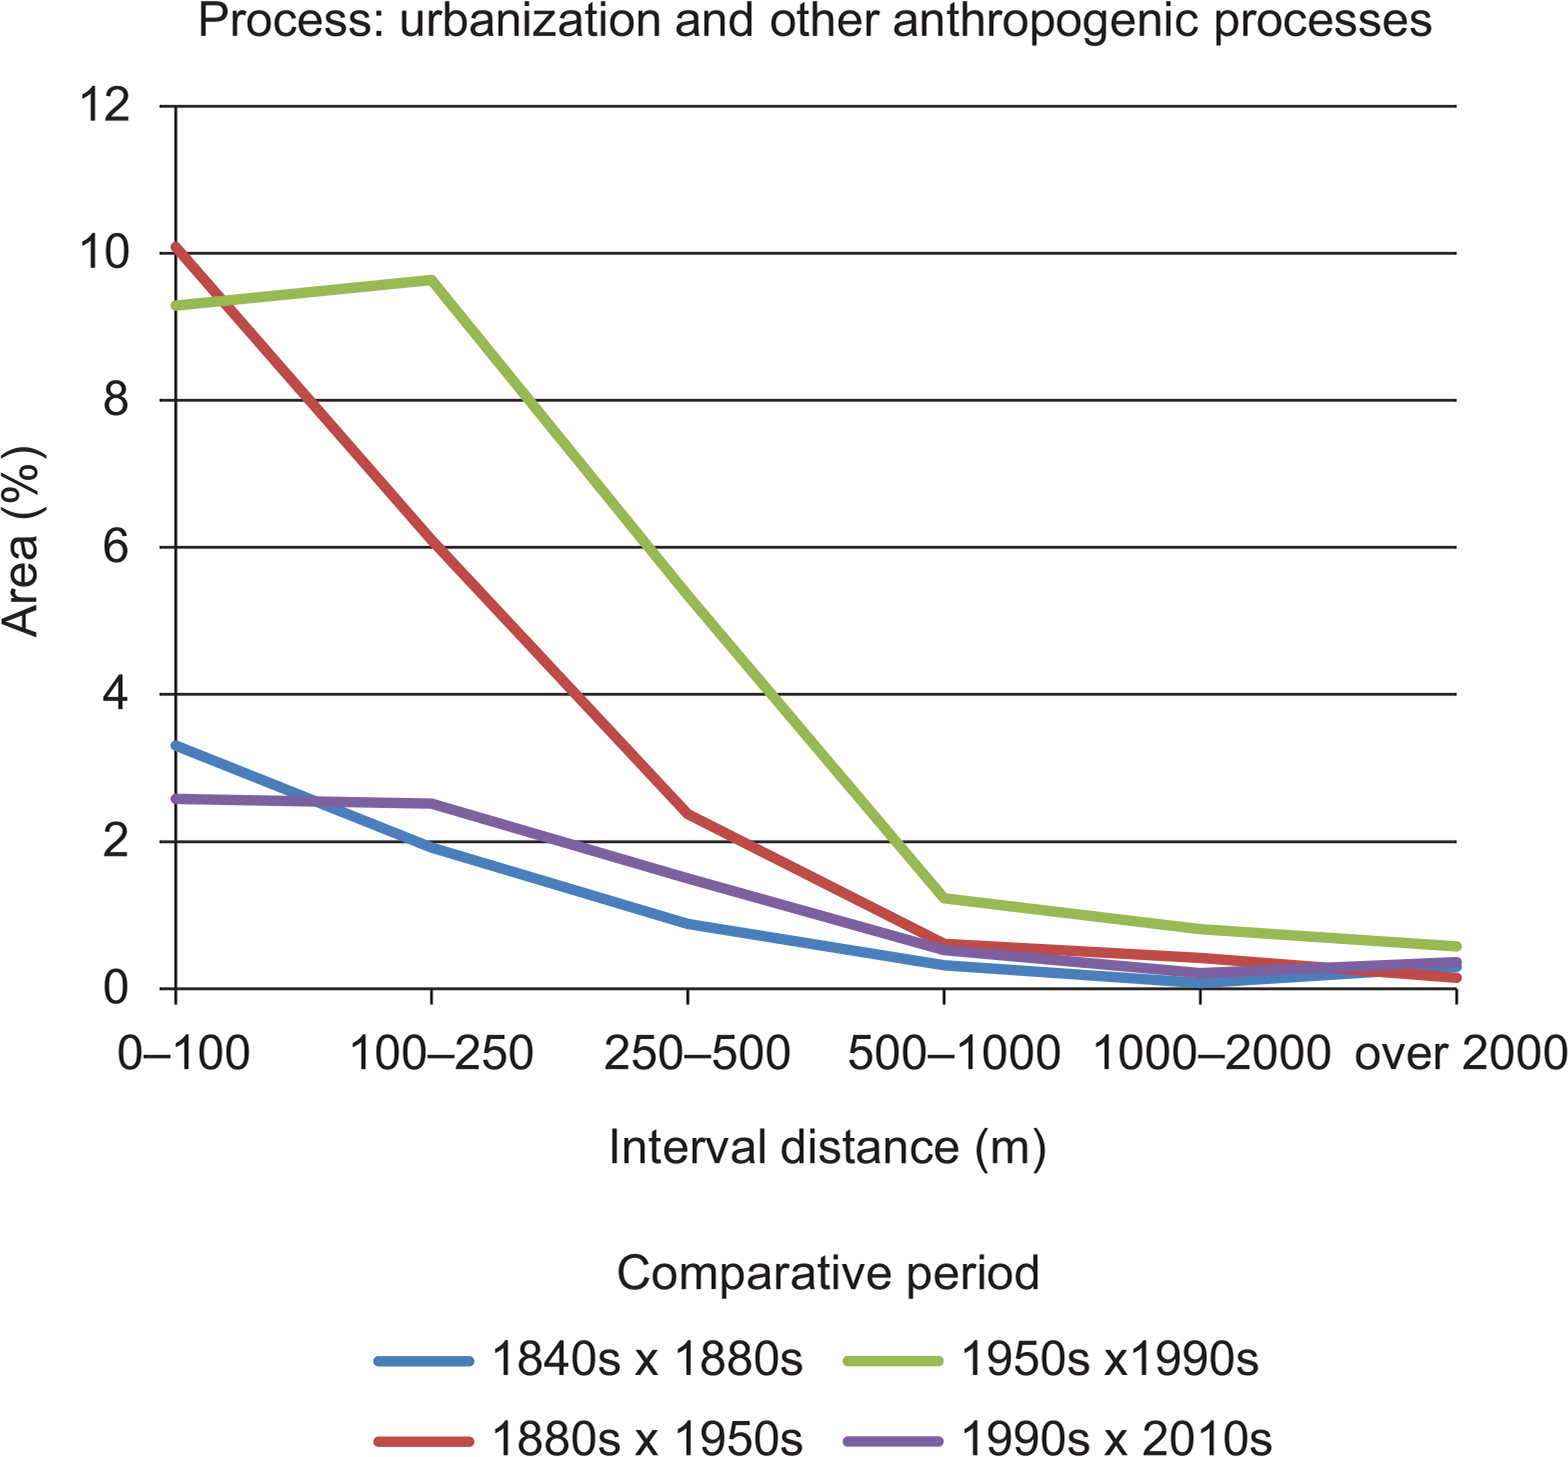
Fig. 10
Urbanisation and other anthropogenic processes in the Hodonín region at various distances from existing roads.
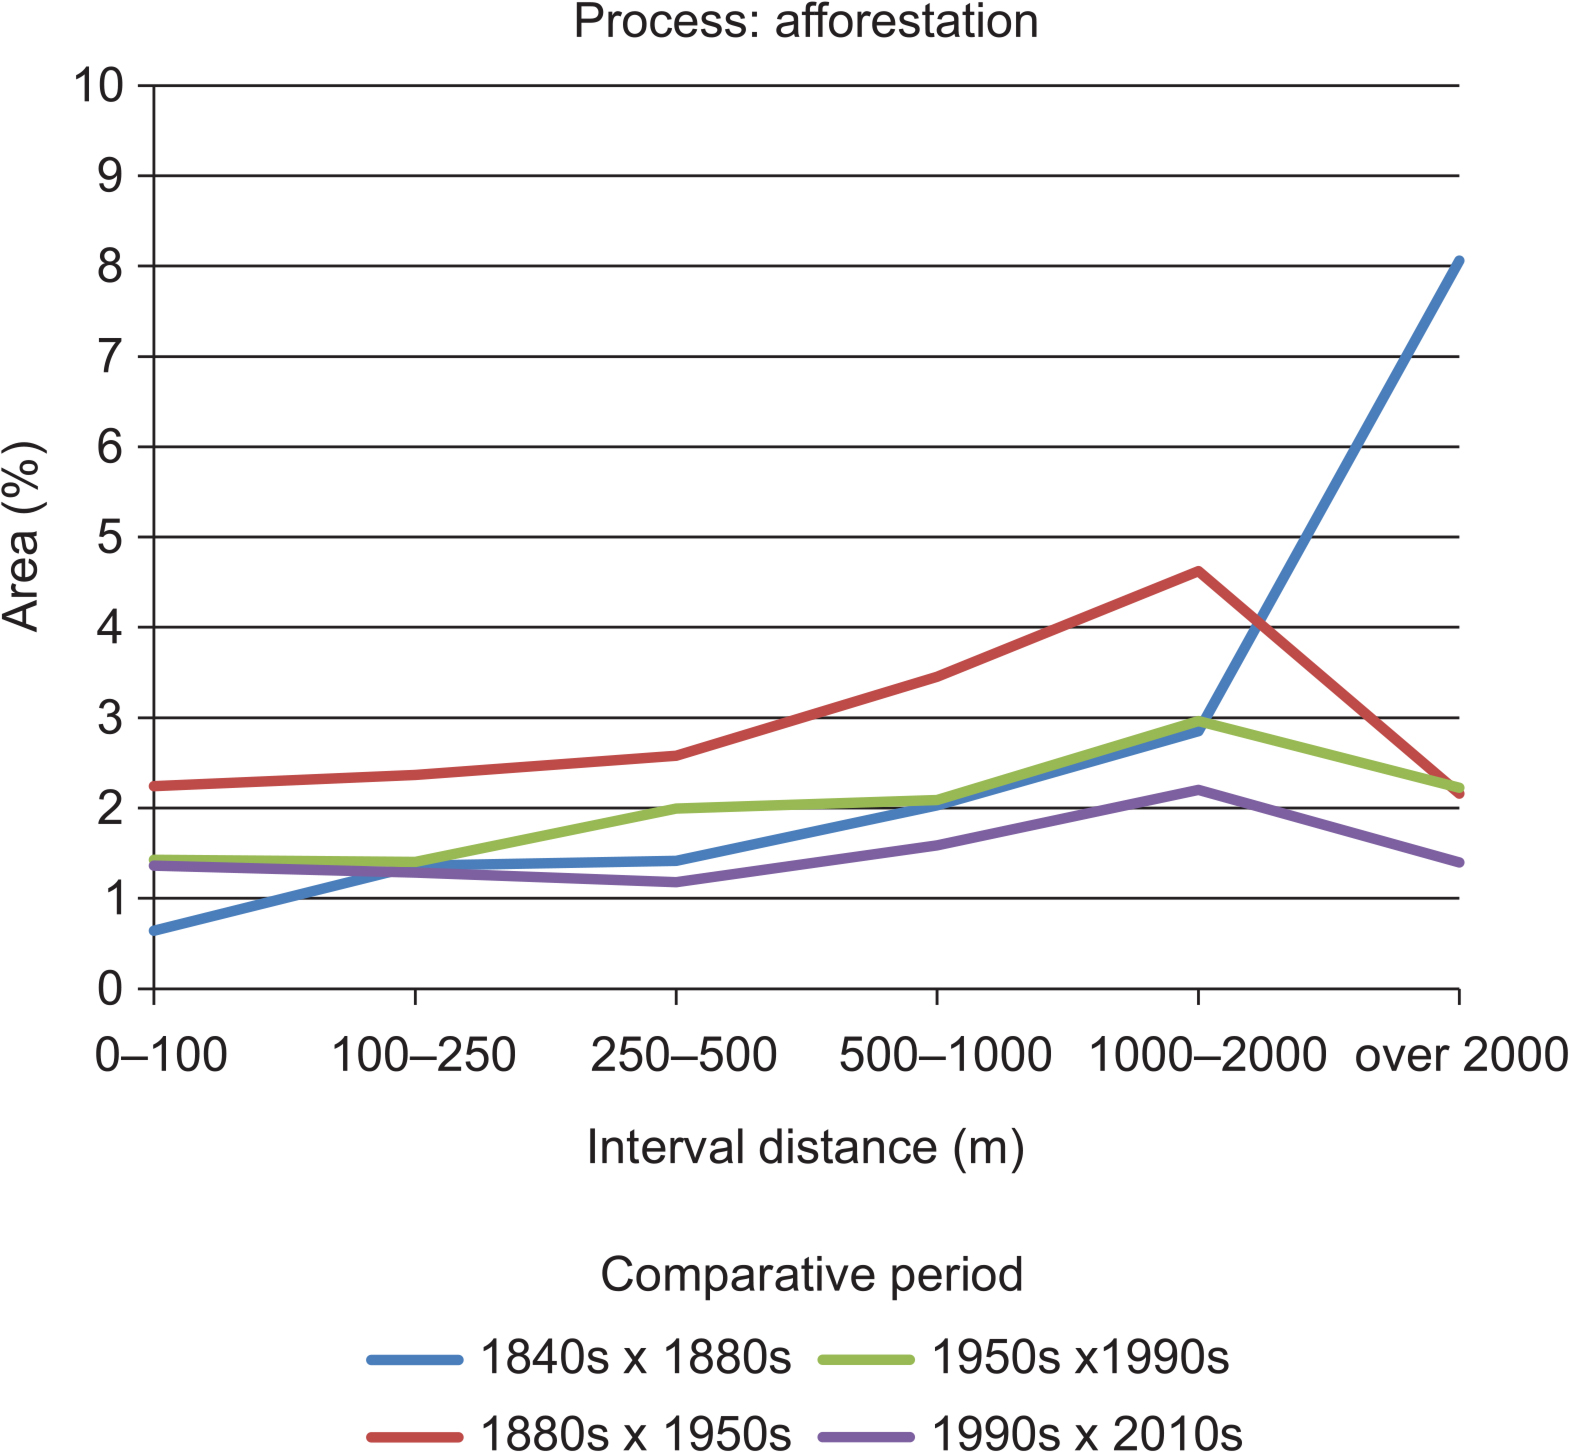
Fig. 11
Afforestation in the Hodonín region at various distances from existing roads.
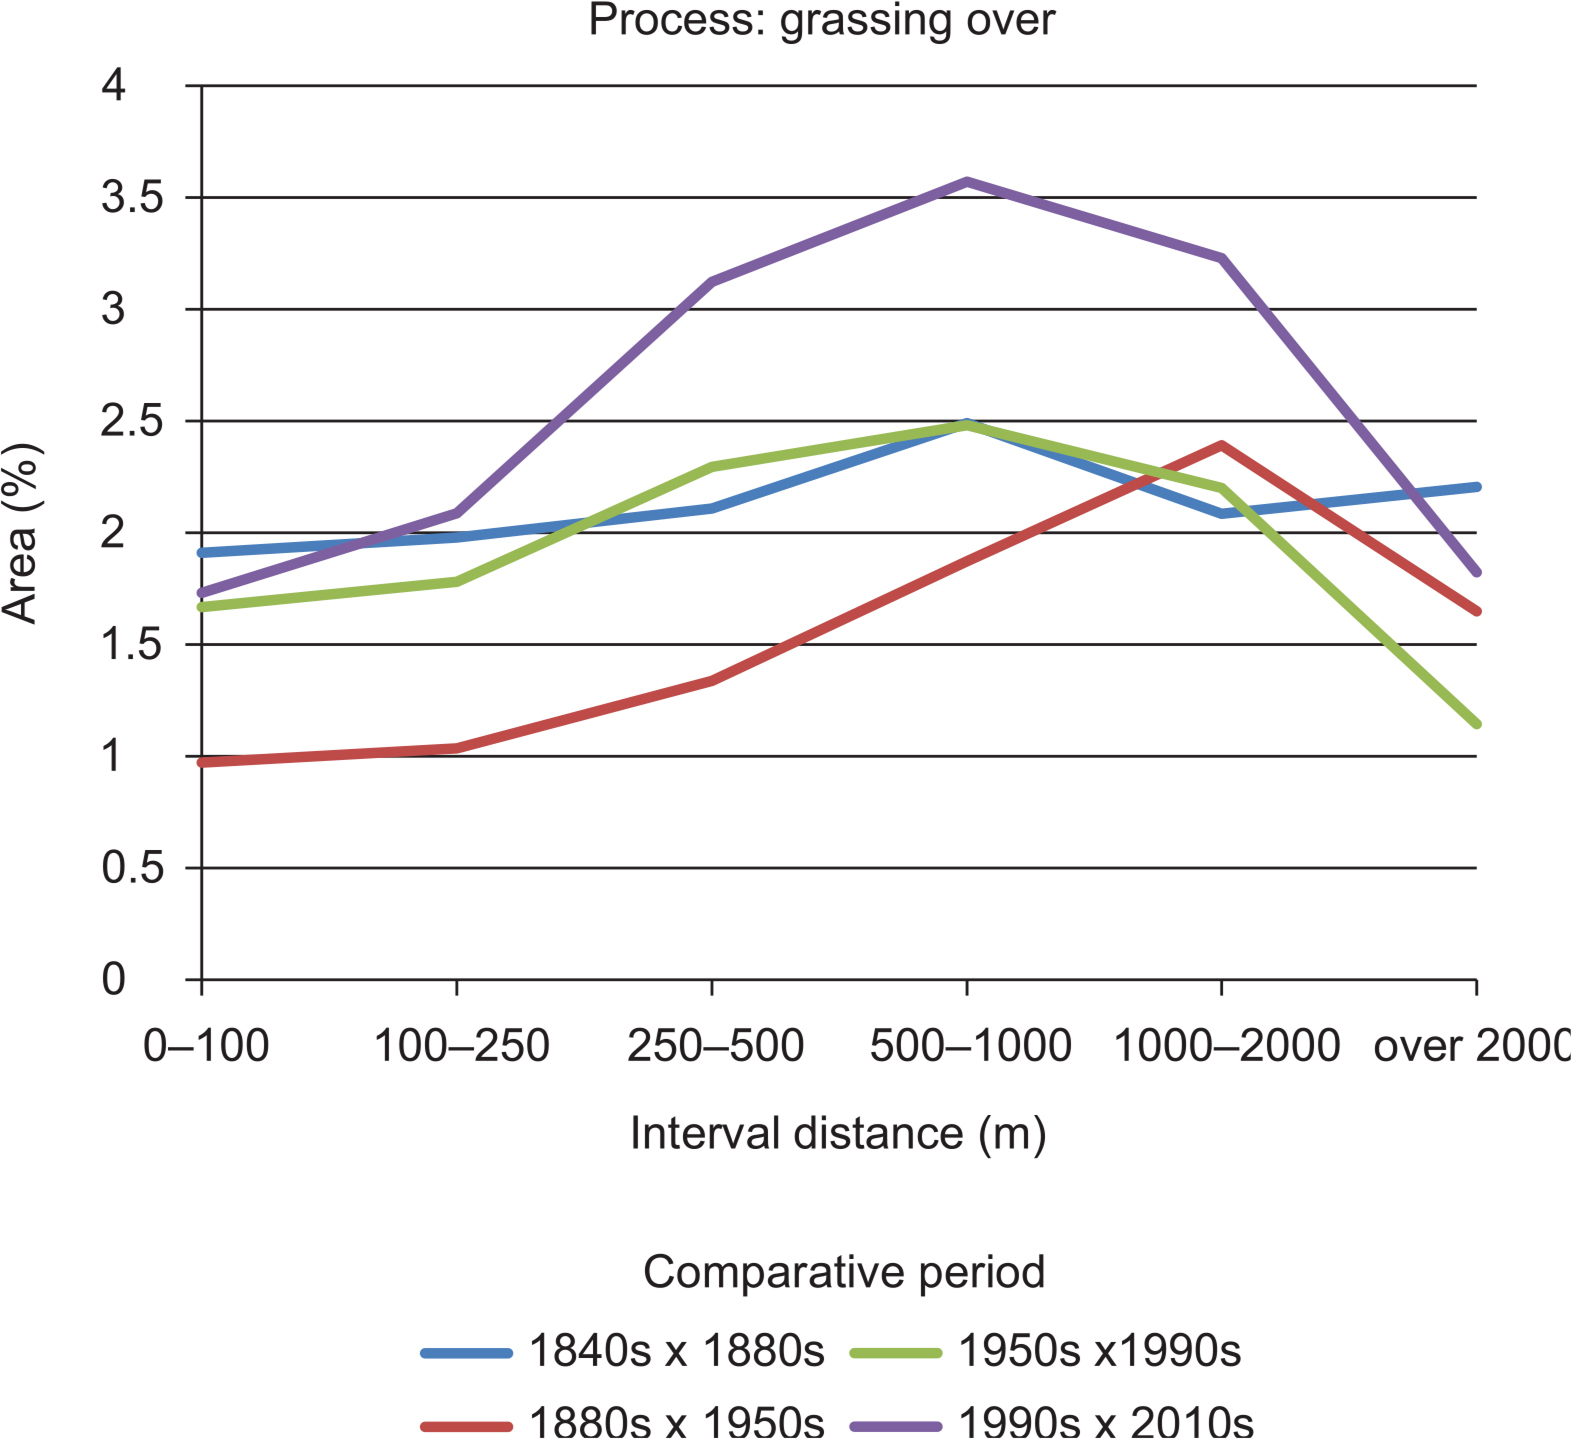
Fig. 12
Grassing in the Hodonín region at various distances from existing roads.