
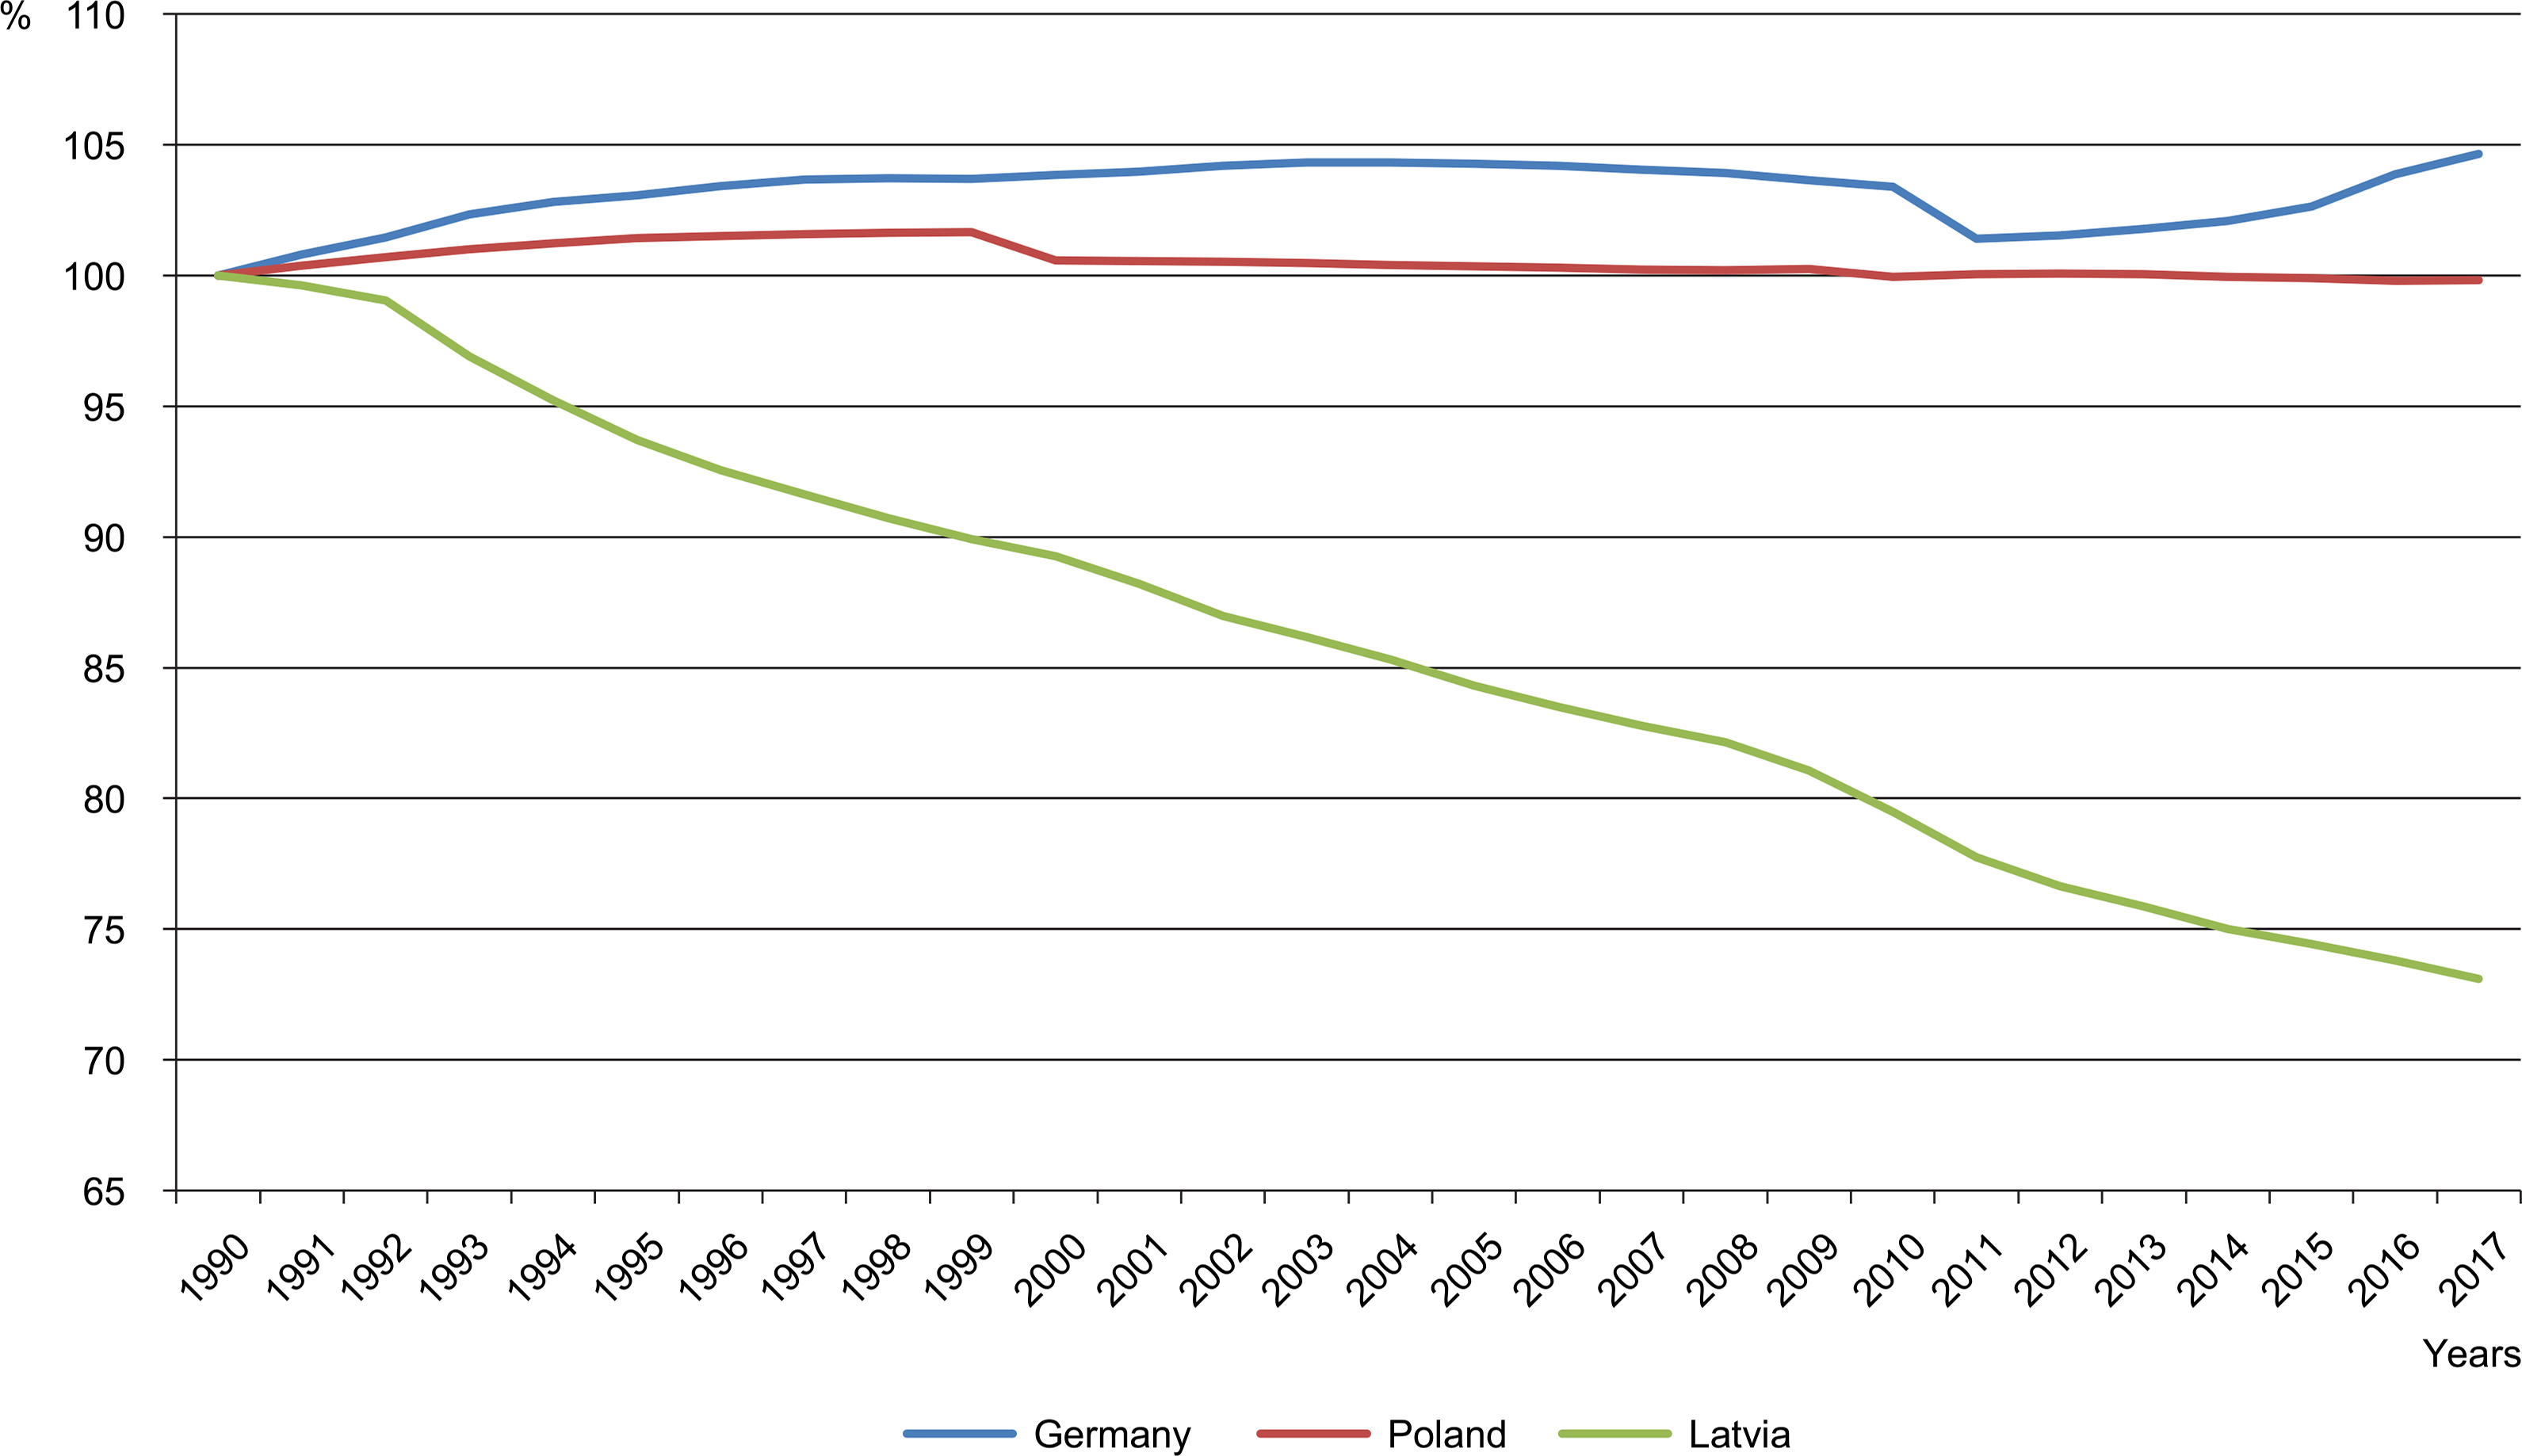
Fig. 1
Population changes in Germany, Latvia and Poland: 1990–2017 (1990 = 100%).
Source: author’s own based on data derived from Eurostat.
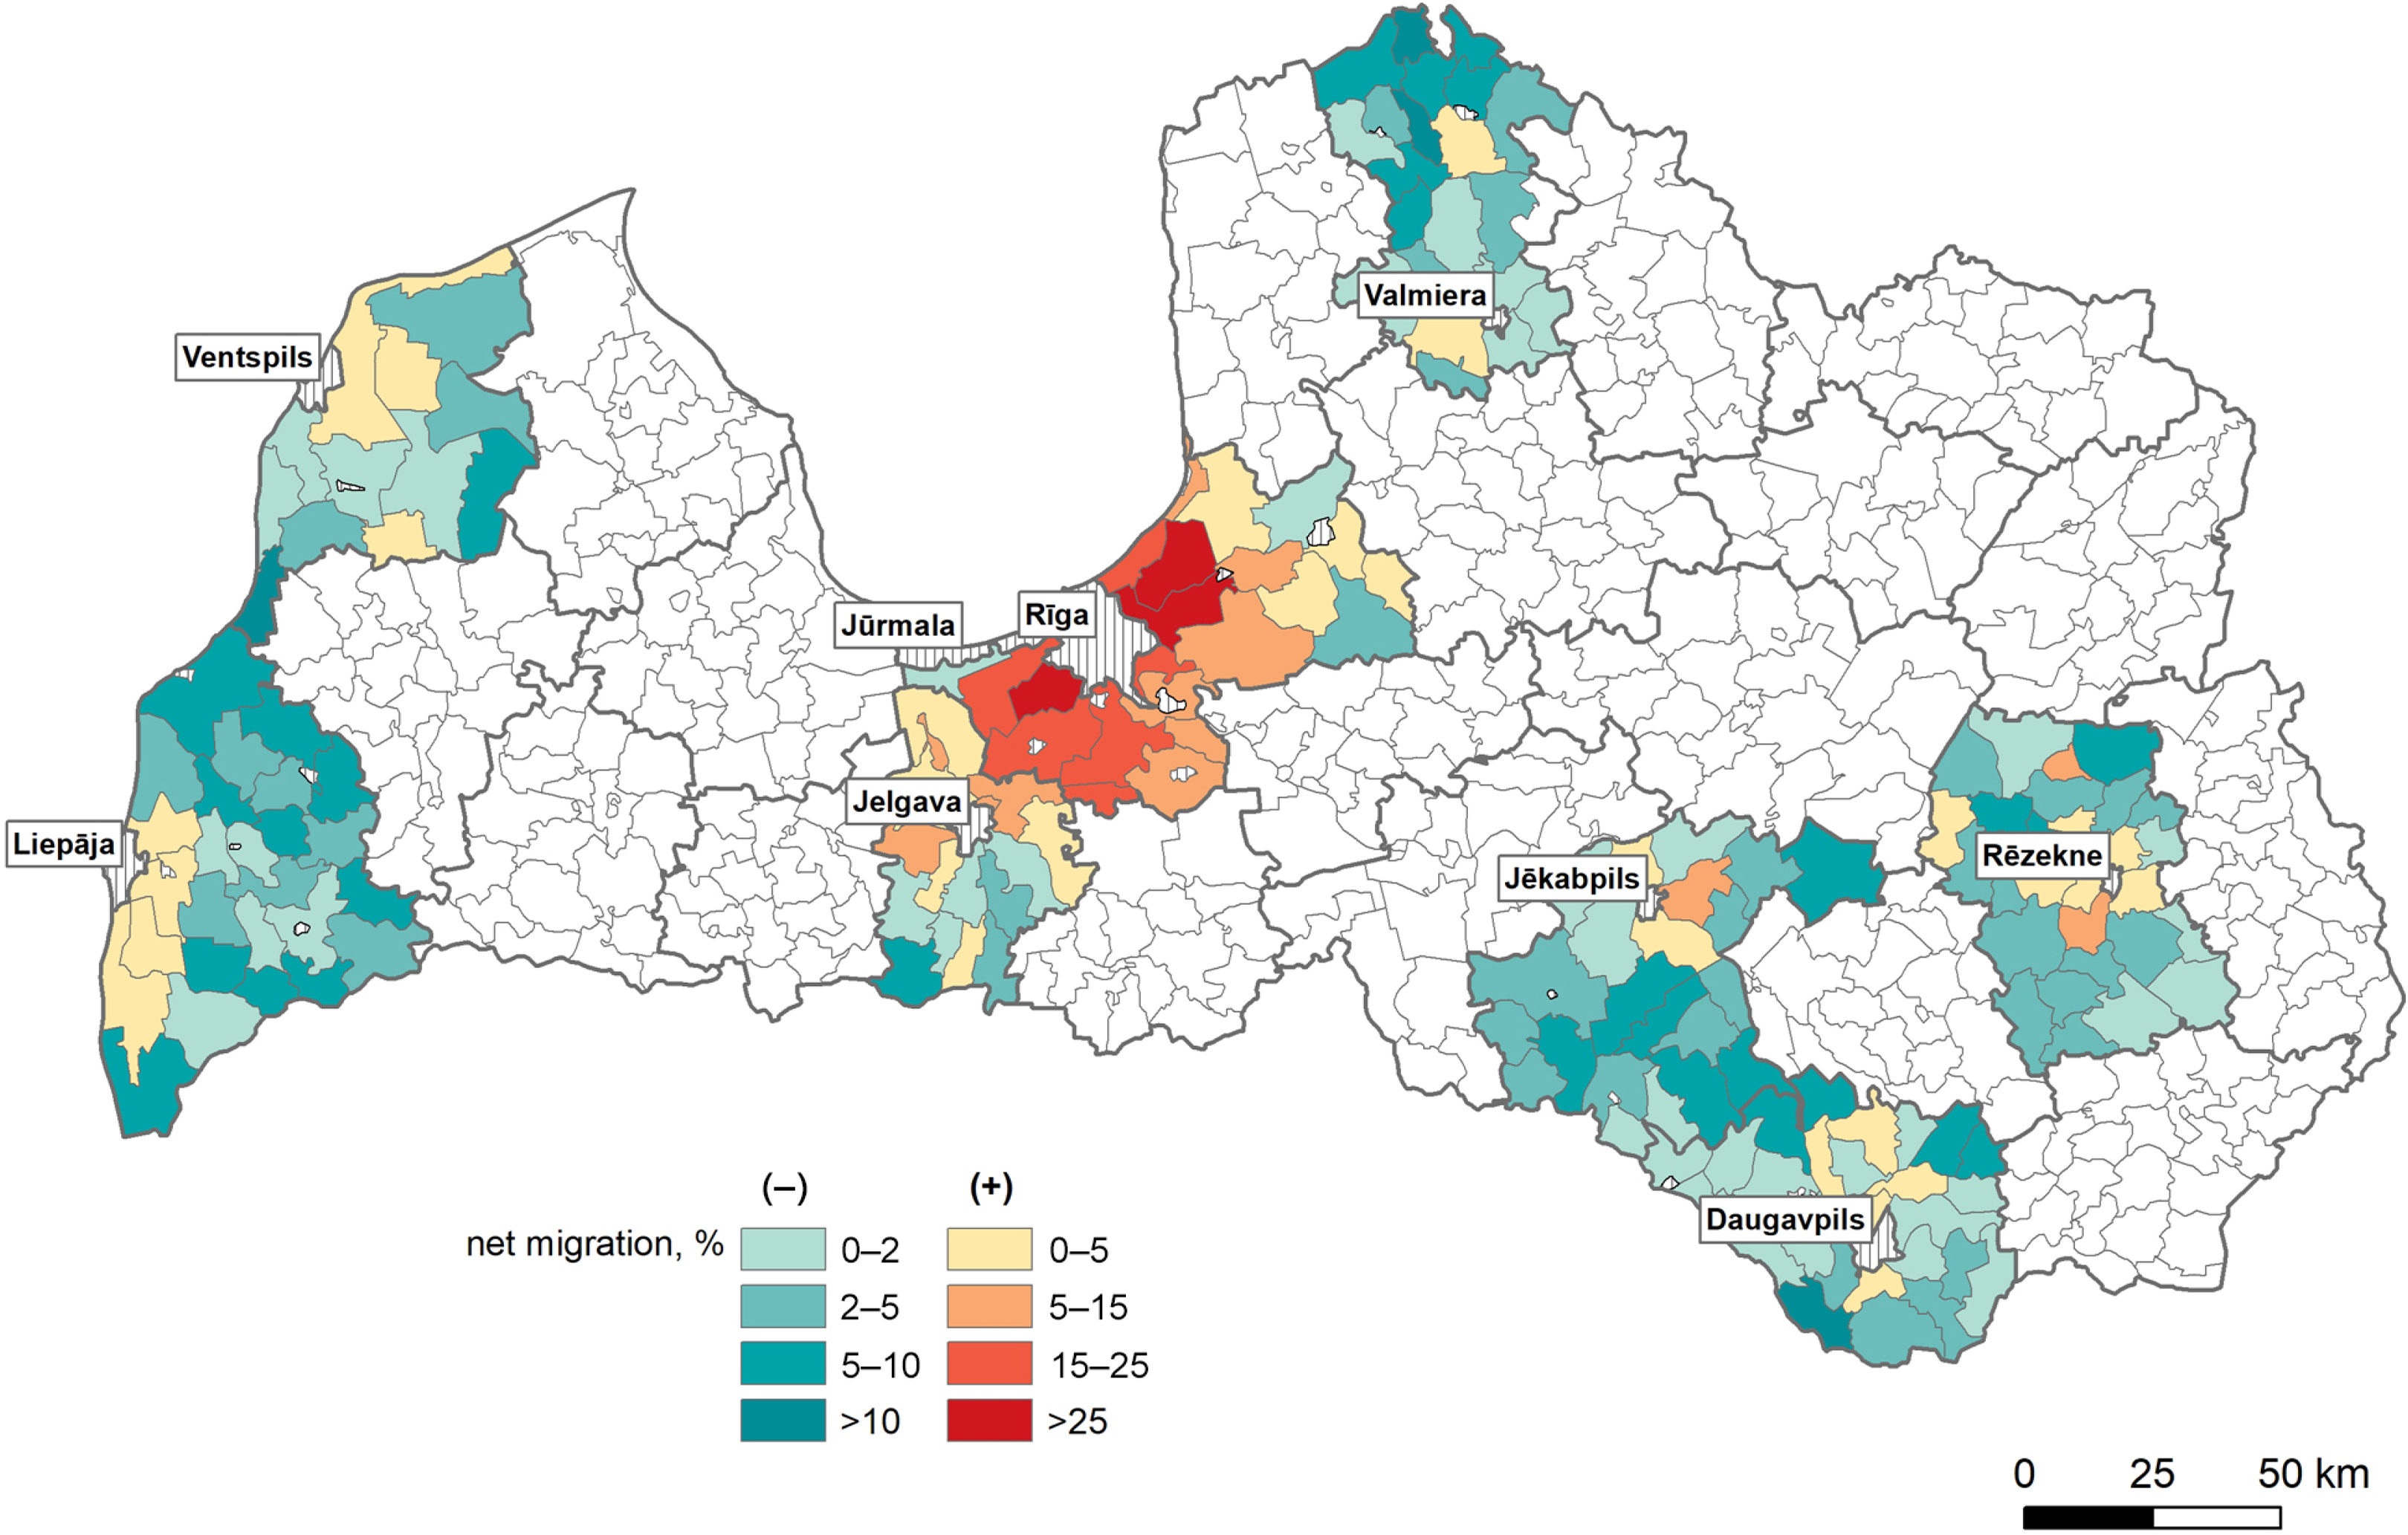
Fig. 2
Long-term internal and international migration around urban centres in Latvia: 2005–2011.
Source: Kruzmetra 2011; Rasnaca, Kruzmetra 2014.
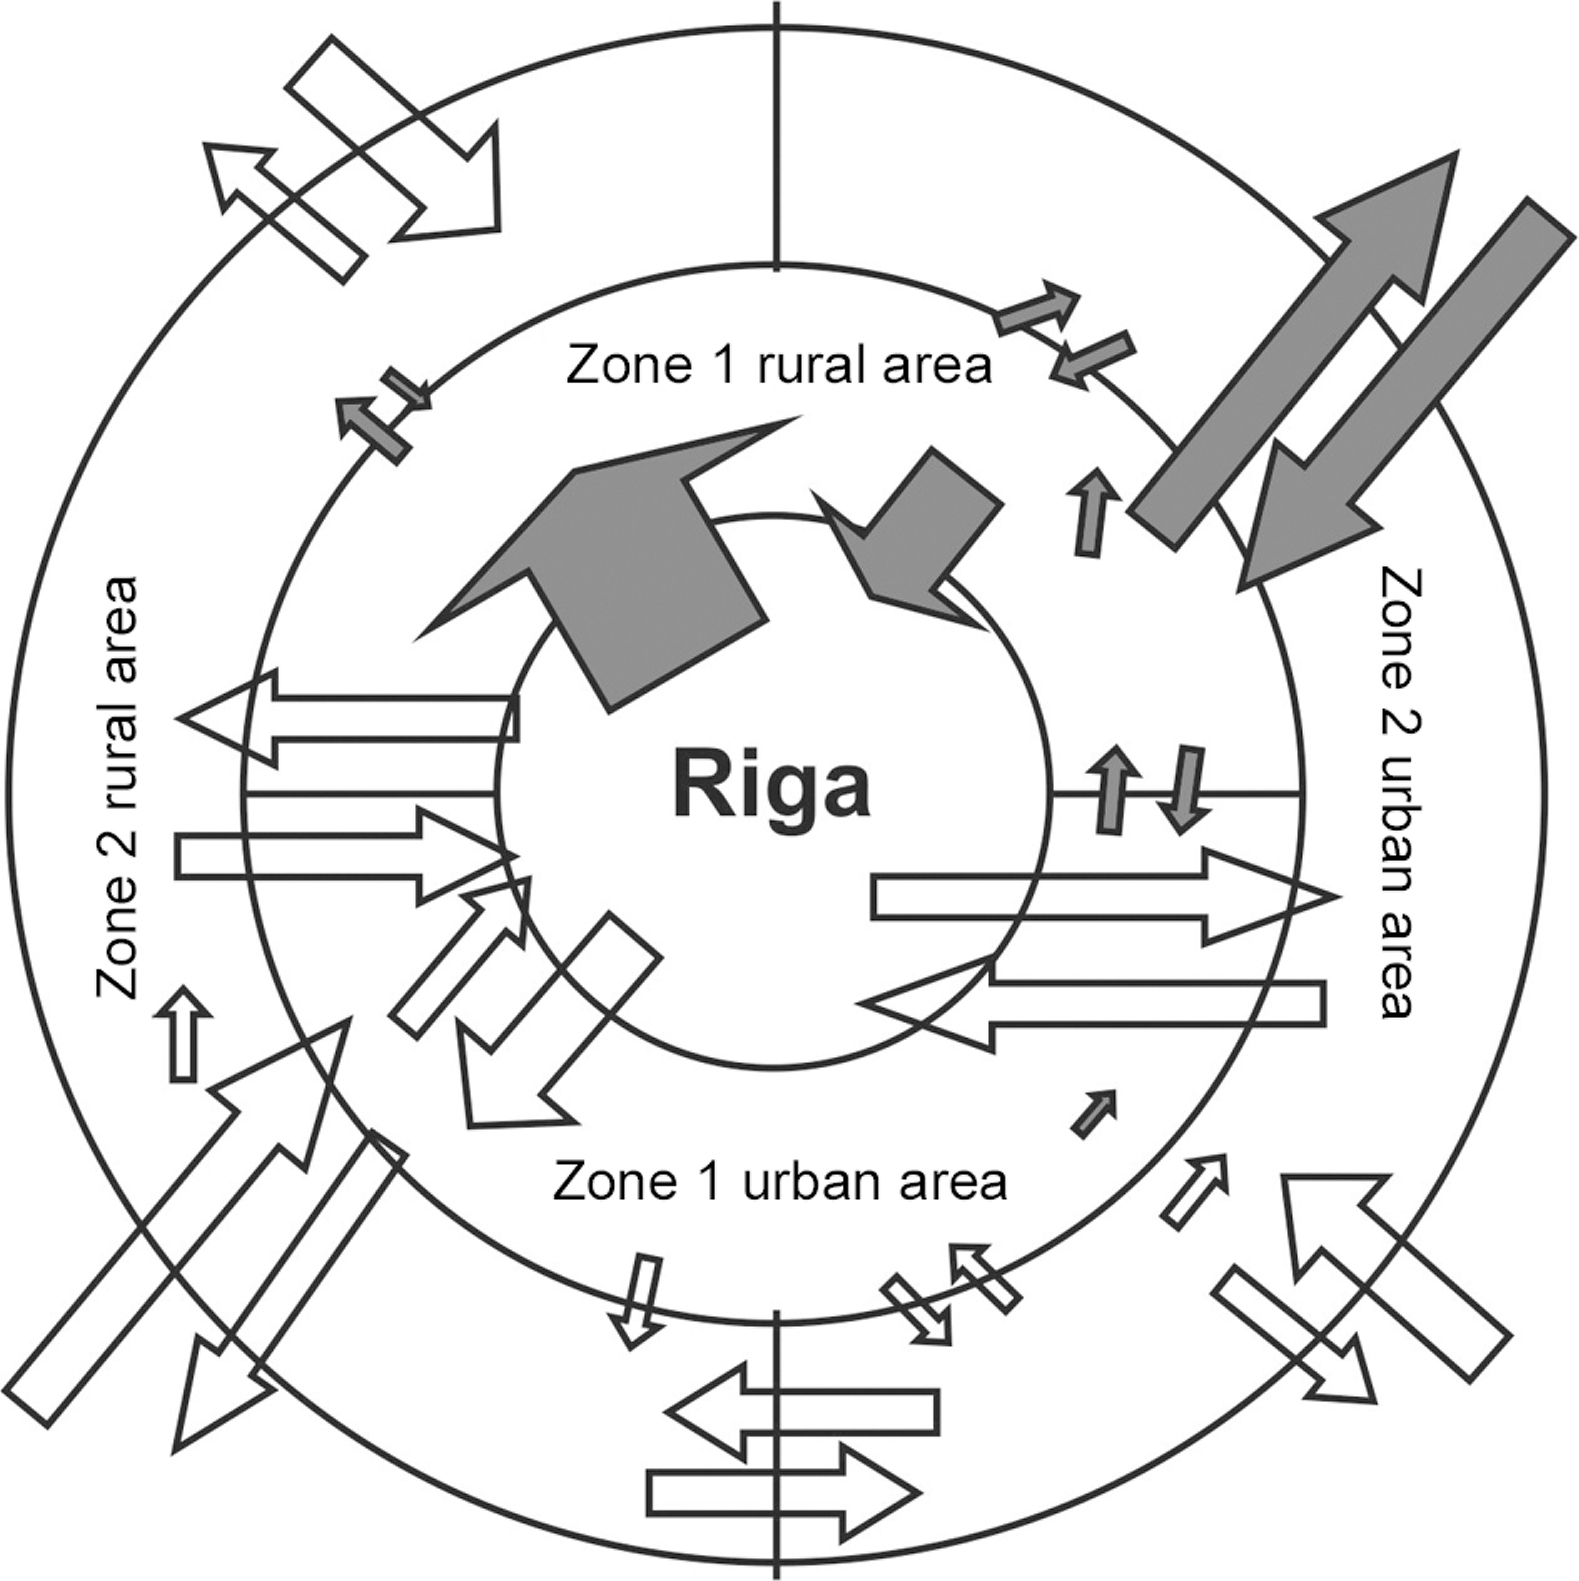
Fig. 3
Complexity of migration flows in the peri-urban zone of Riga.
Source: Kruzmetra 2011 according to data from Latvia CSB.
Table 1
Motivation to move to peri-urban areas: the case of Latvia.
| Till 1991 | 1991–2000 | After 2000 |
|---|---|---|
| 1. Family circumstances | 1. Family circumstances | 1. Family circumstances |
| 2. Work | 2. Housing | 2. Housing |
| 3. Housing | 3. Work | 3. Environment |
[i] Source: author’s own.
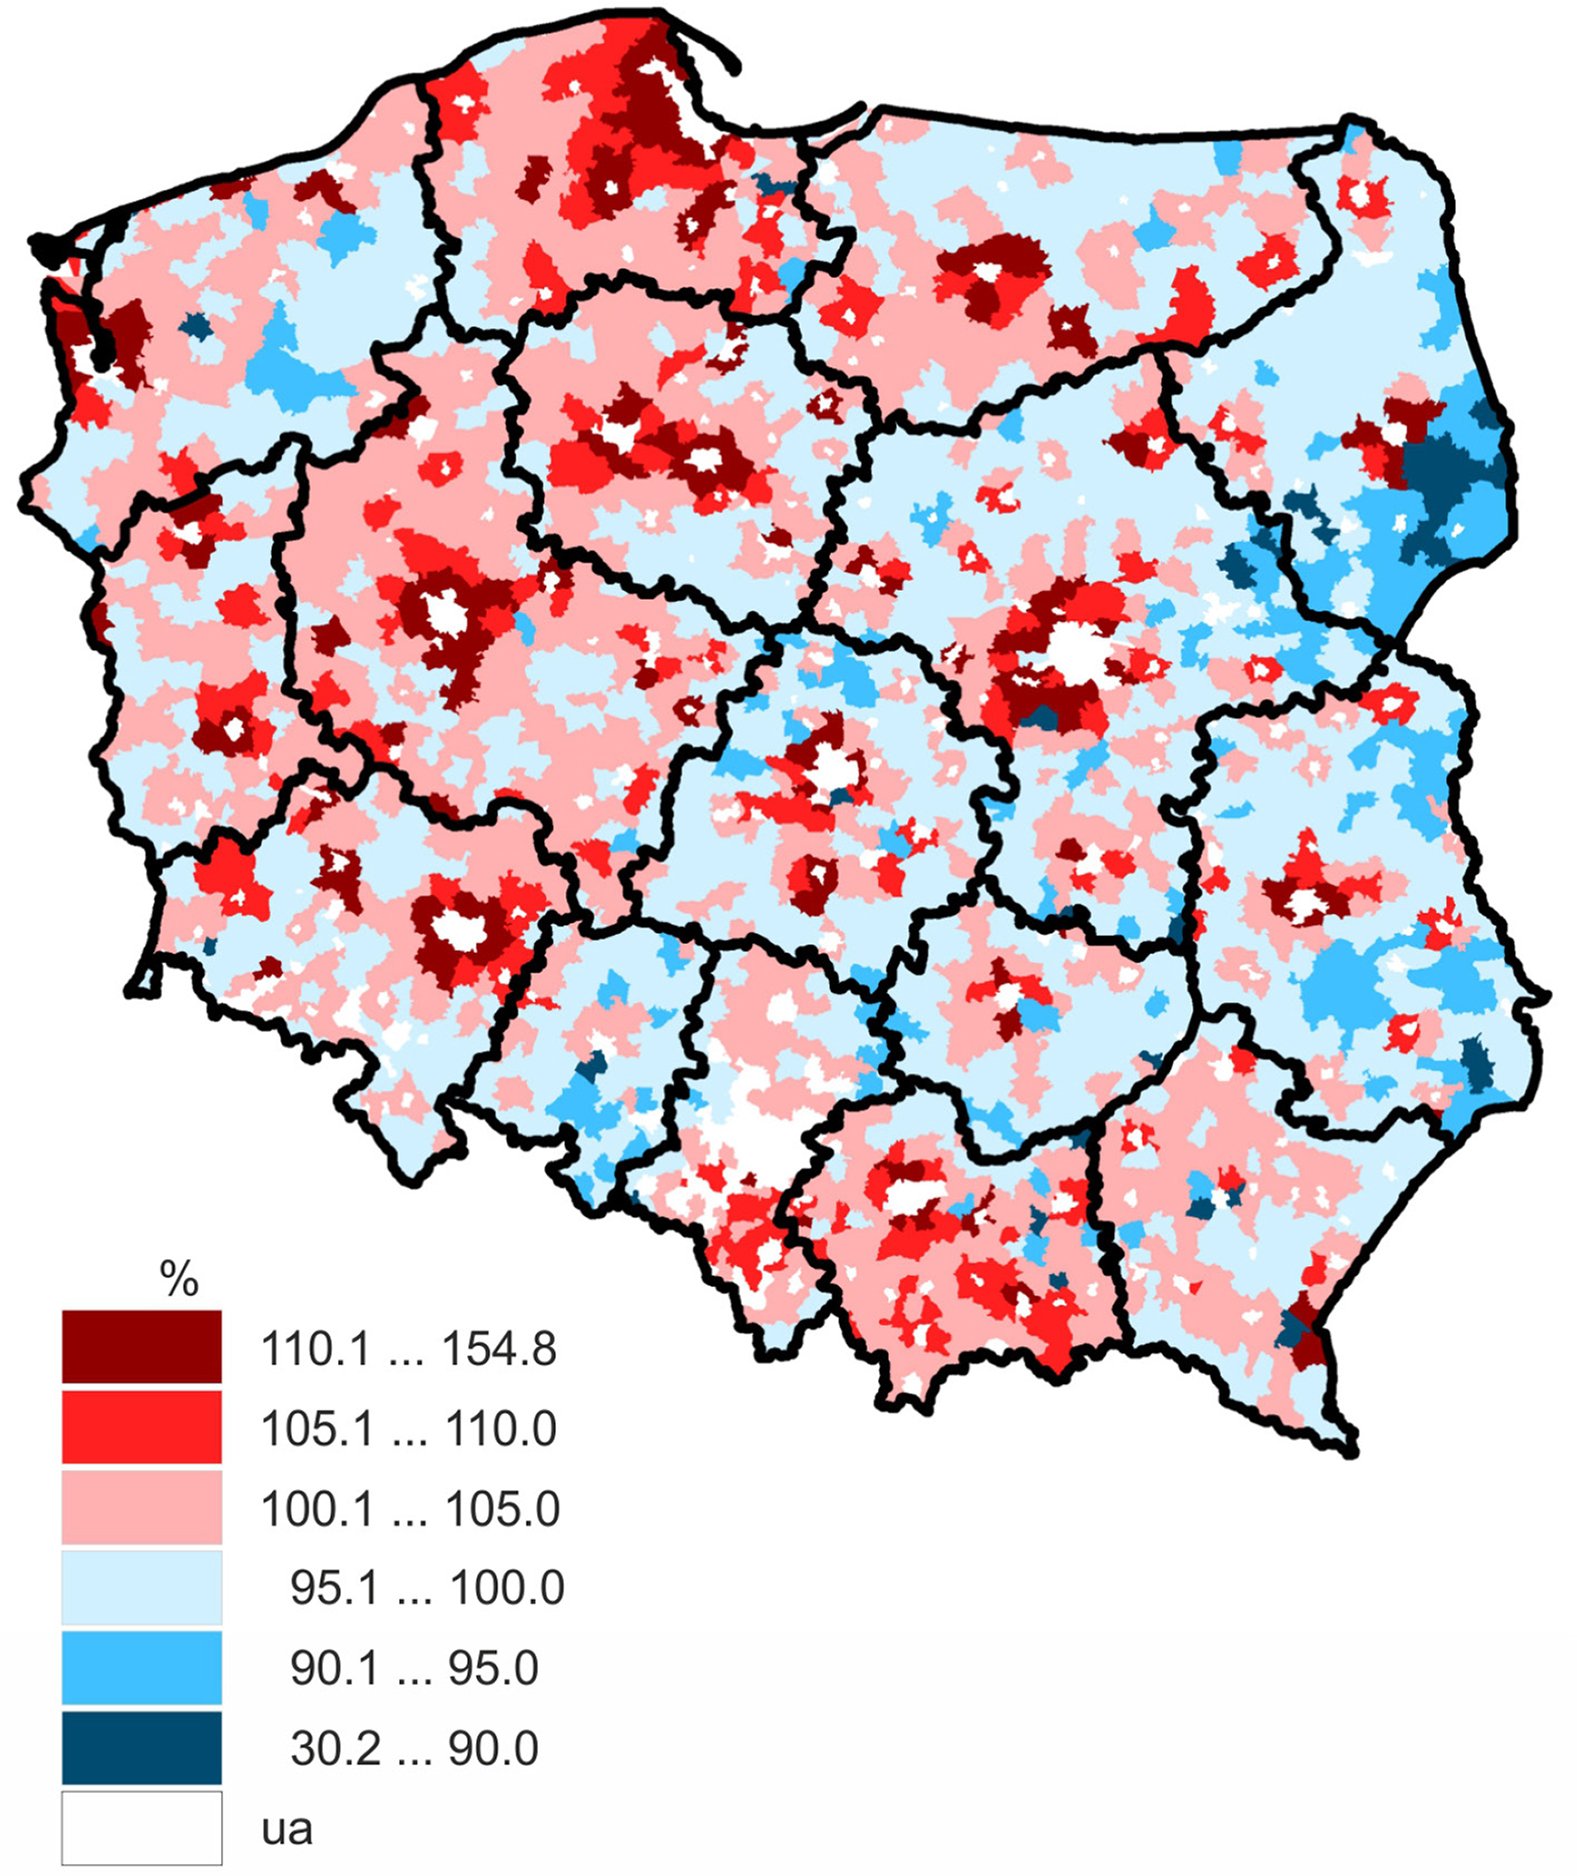
Fig. 4
Population changes in rural areas in Poland (2005–2011 in relation to 1999–2004; 1999–2004 considered as 100%).
Source: Biegańska 2013; ua – urban areas.
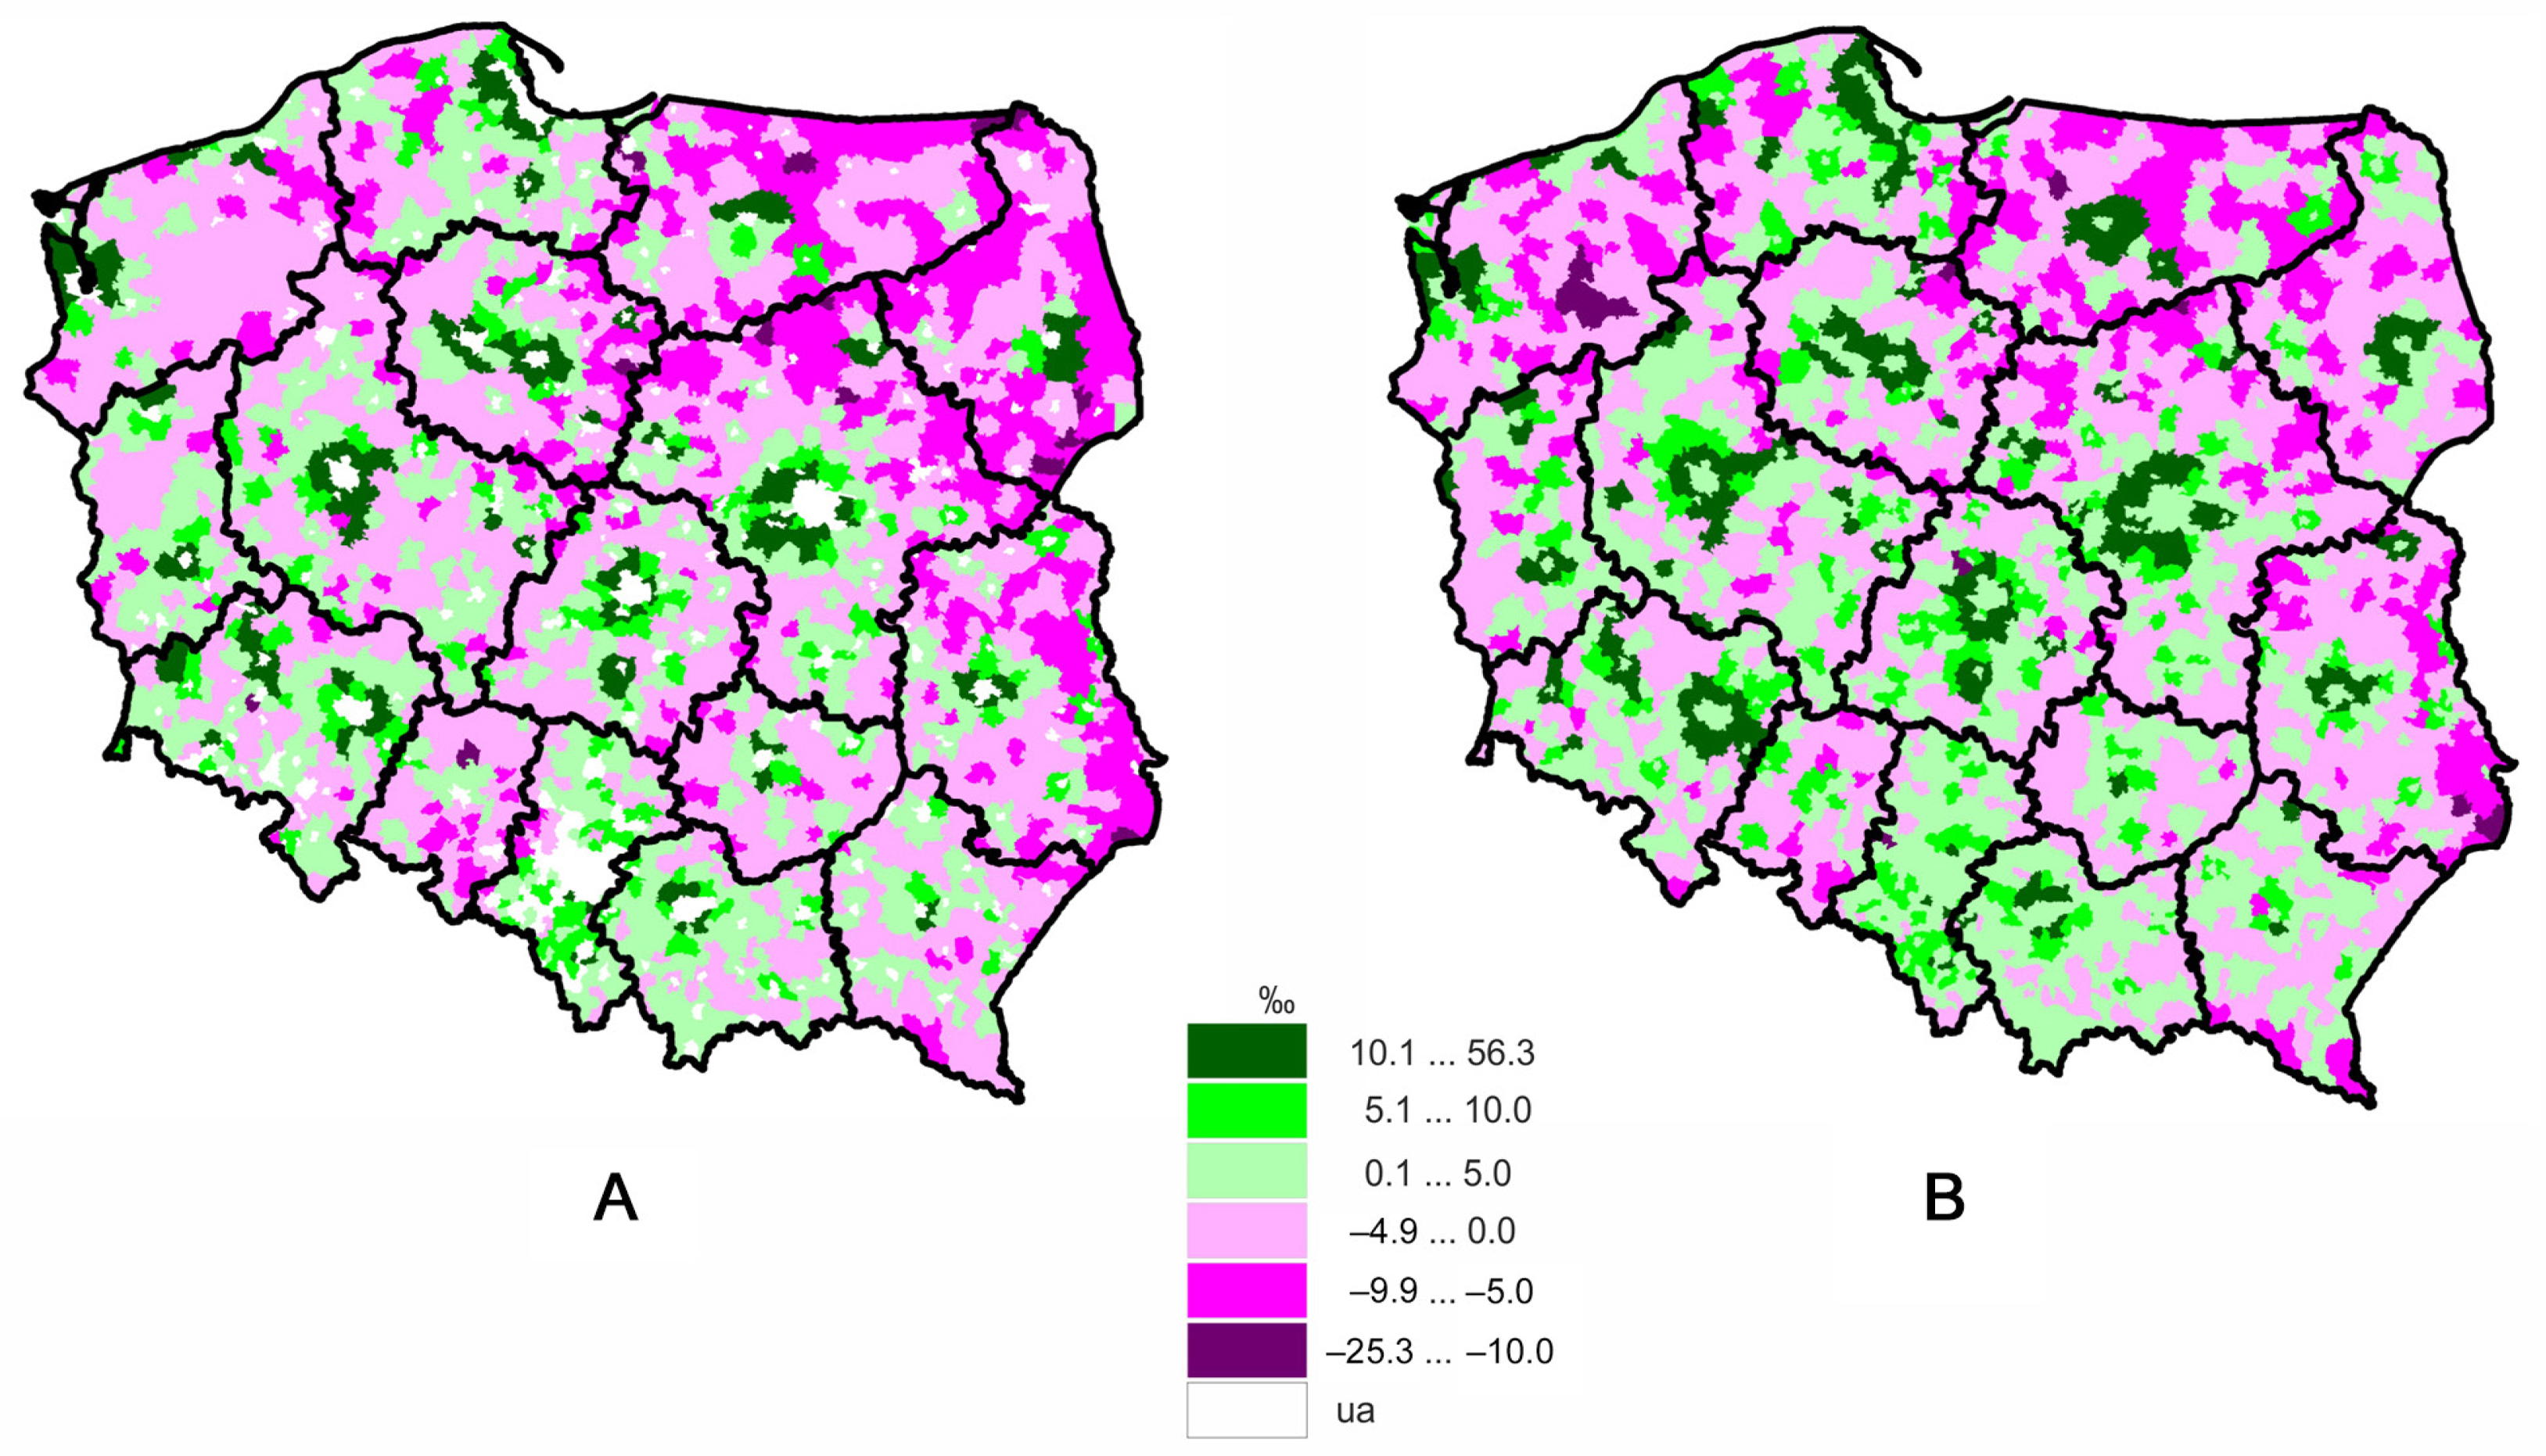
Fig. 5
Migration balance per 1,000 population in rural areas of Poland.
Source: author on the basis of data collected from the Local Data Bank, the Central Statistical Office; A – 1999–2004; B – 2005–2011; ua – urban areas.
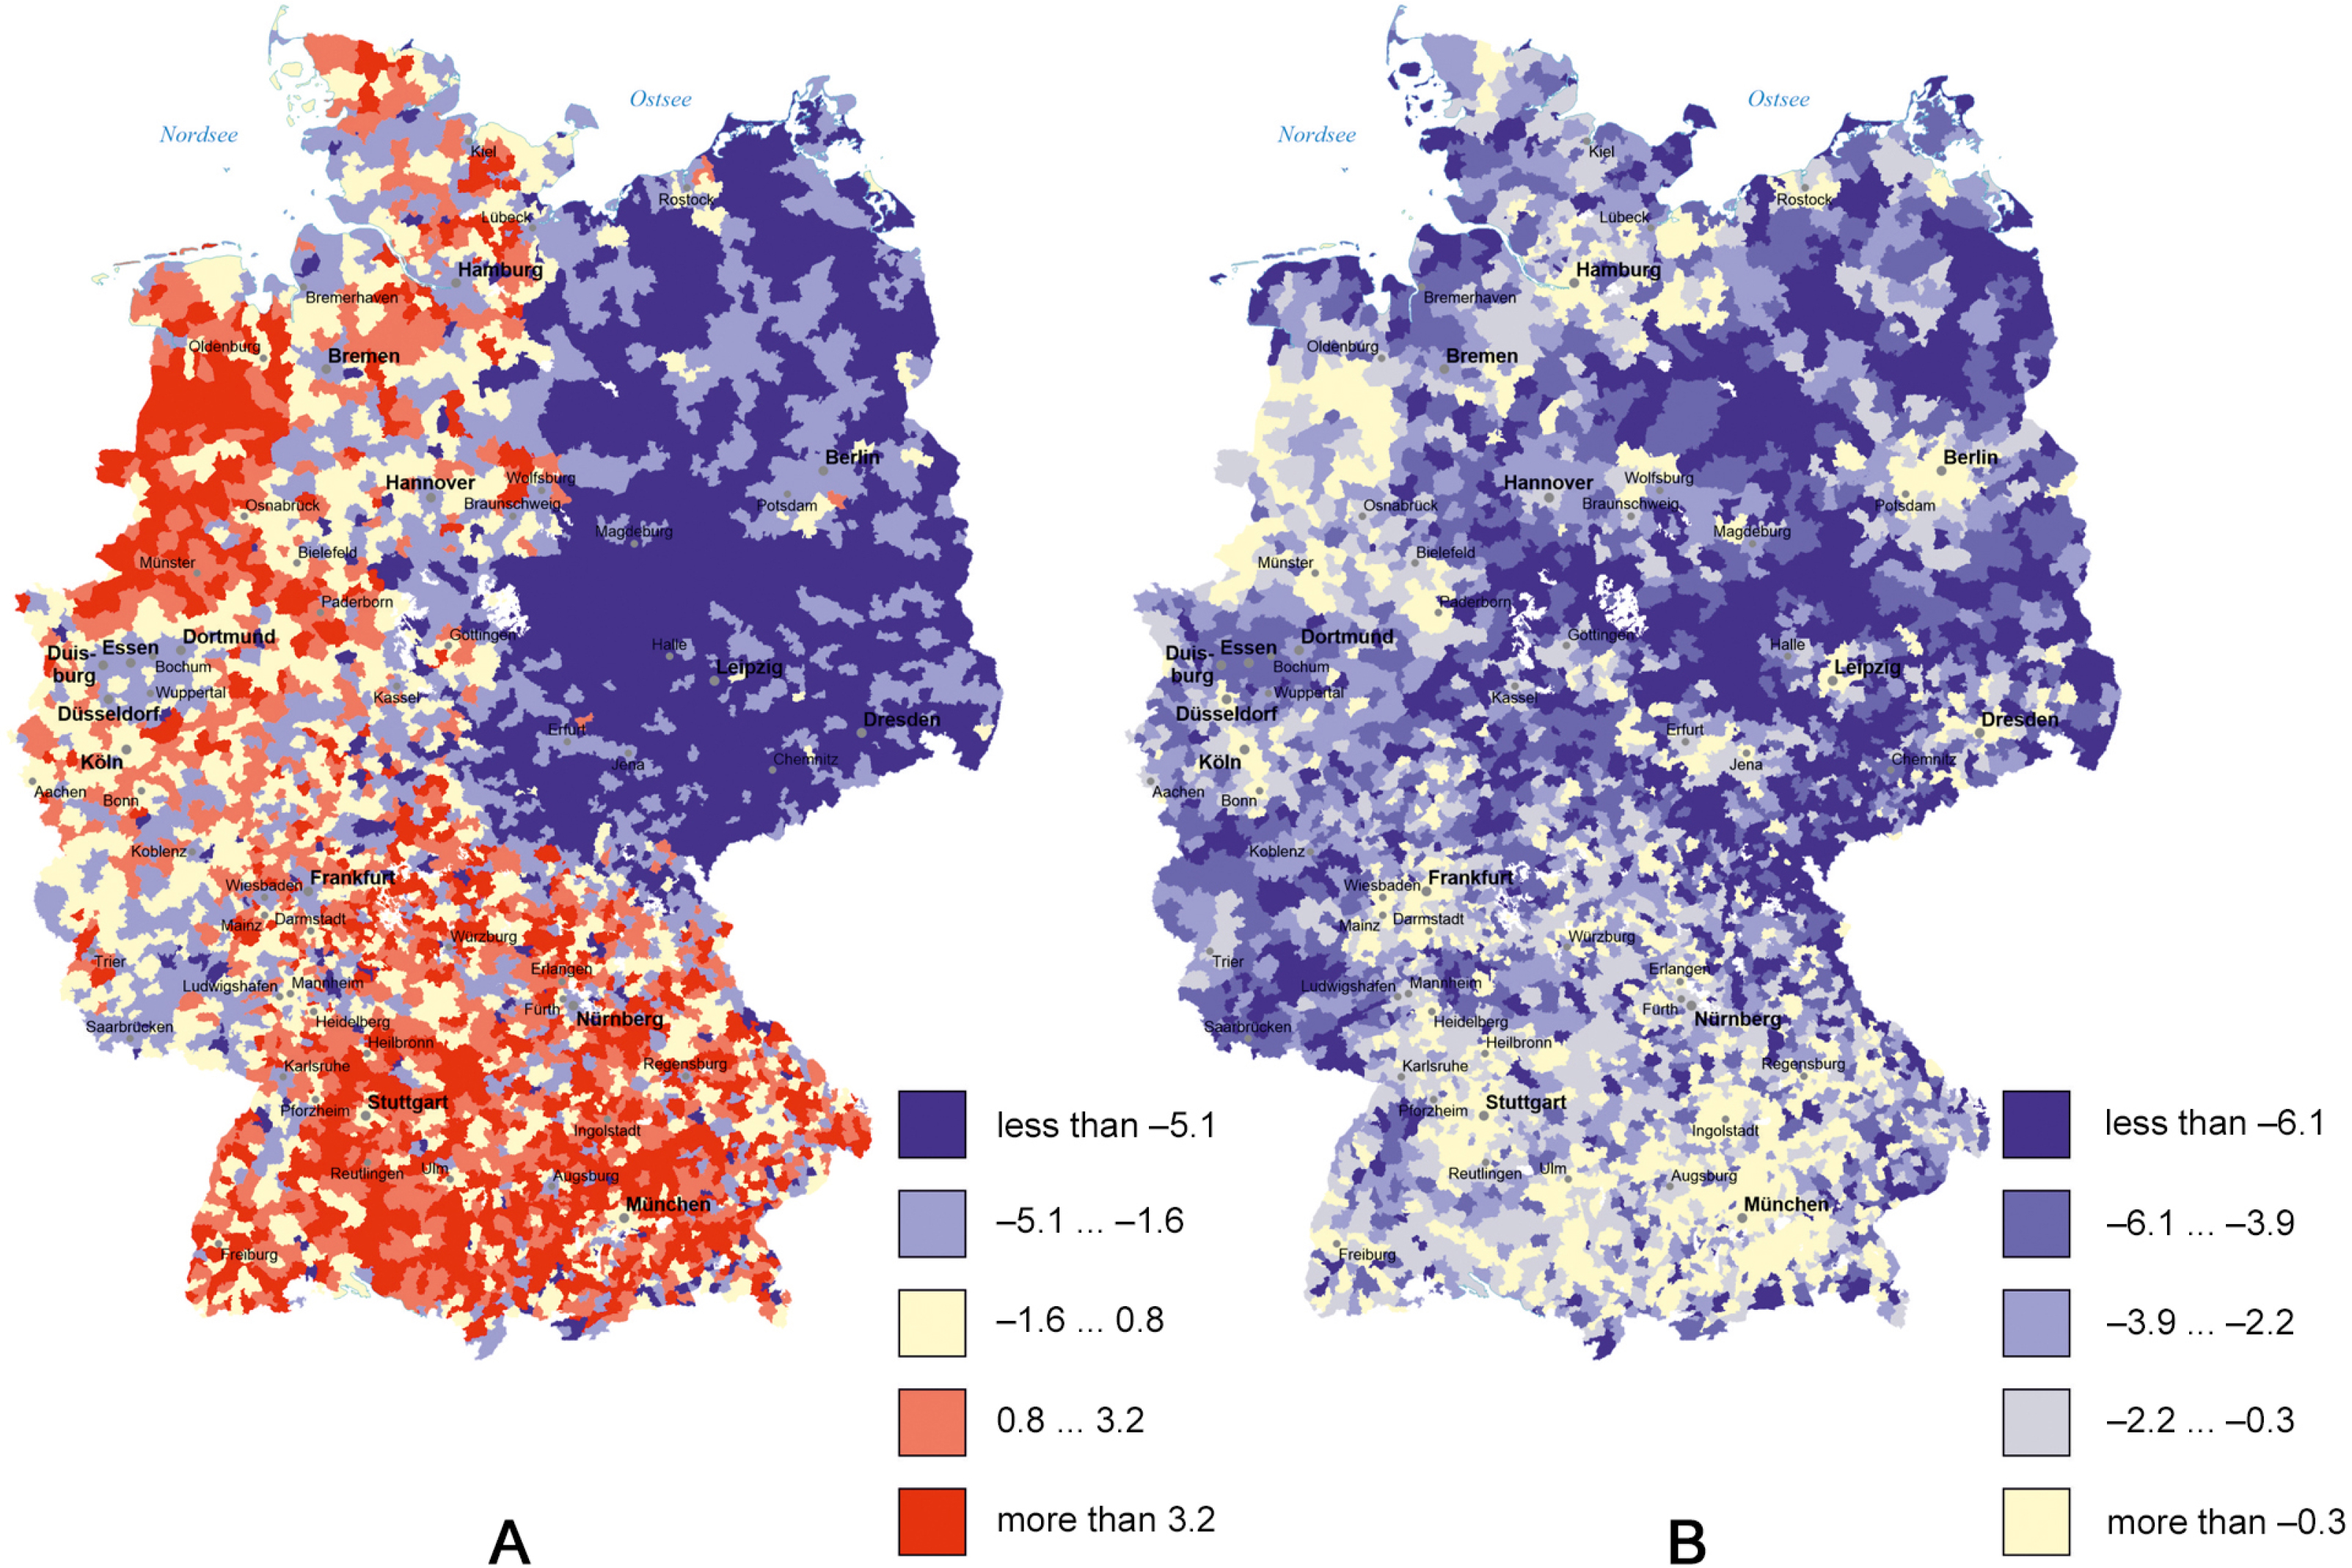
Fig. 6
Natural increase per 1,000 population in Gemeinde: 1995 and 2012.
Source: Bundesinstitut für Bau-, Stadt- und Raumforschung, Bonn, 2017, A – 1995; B – 2012.
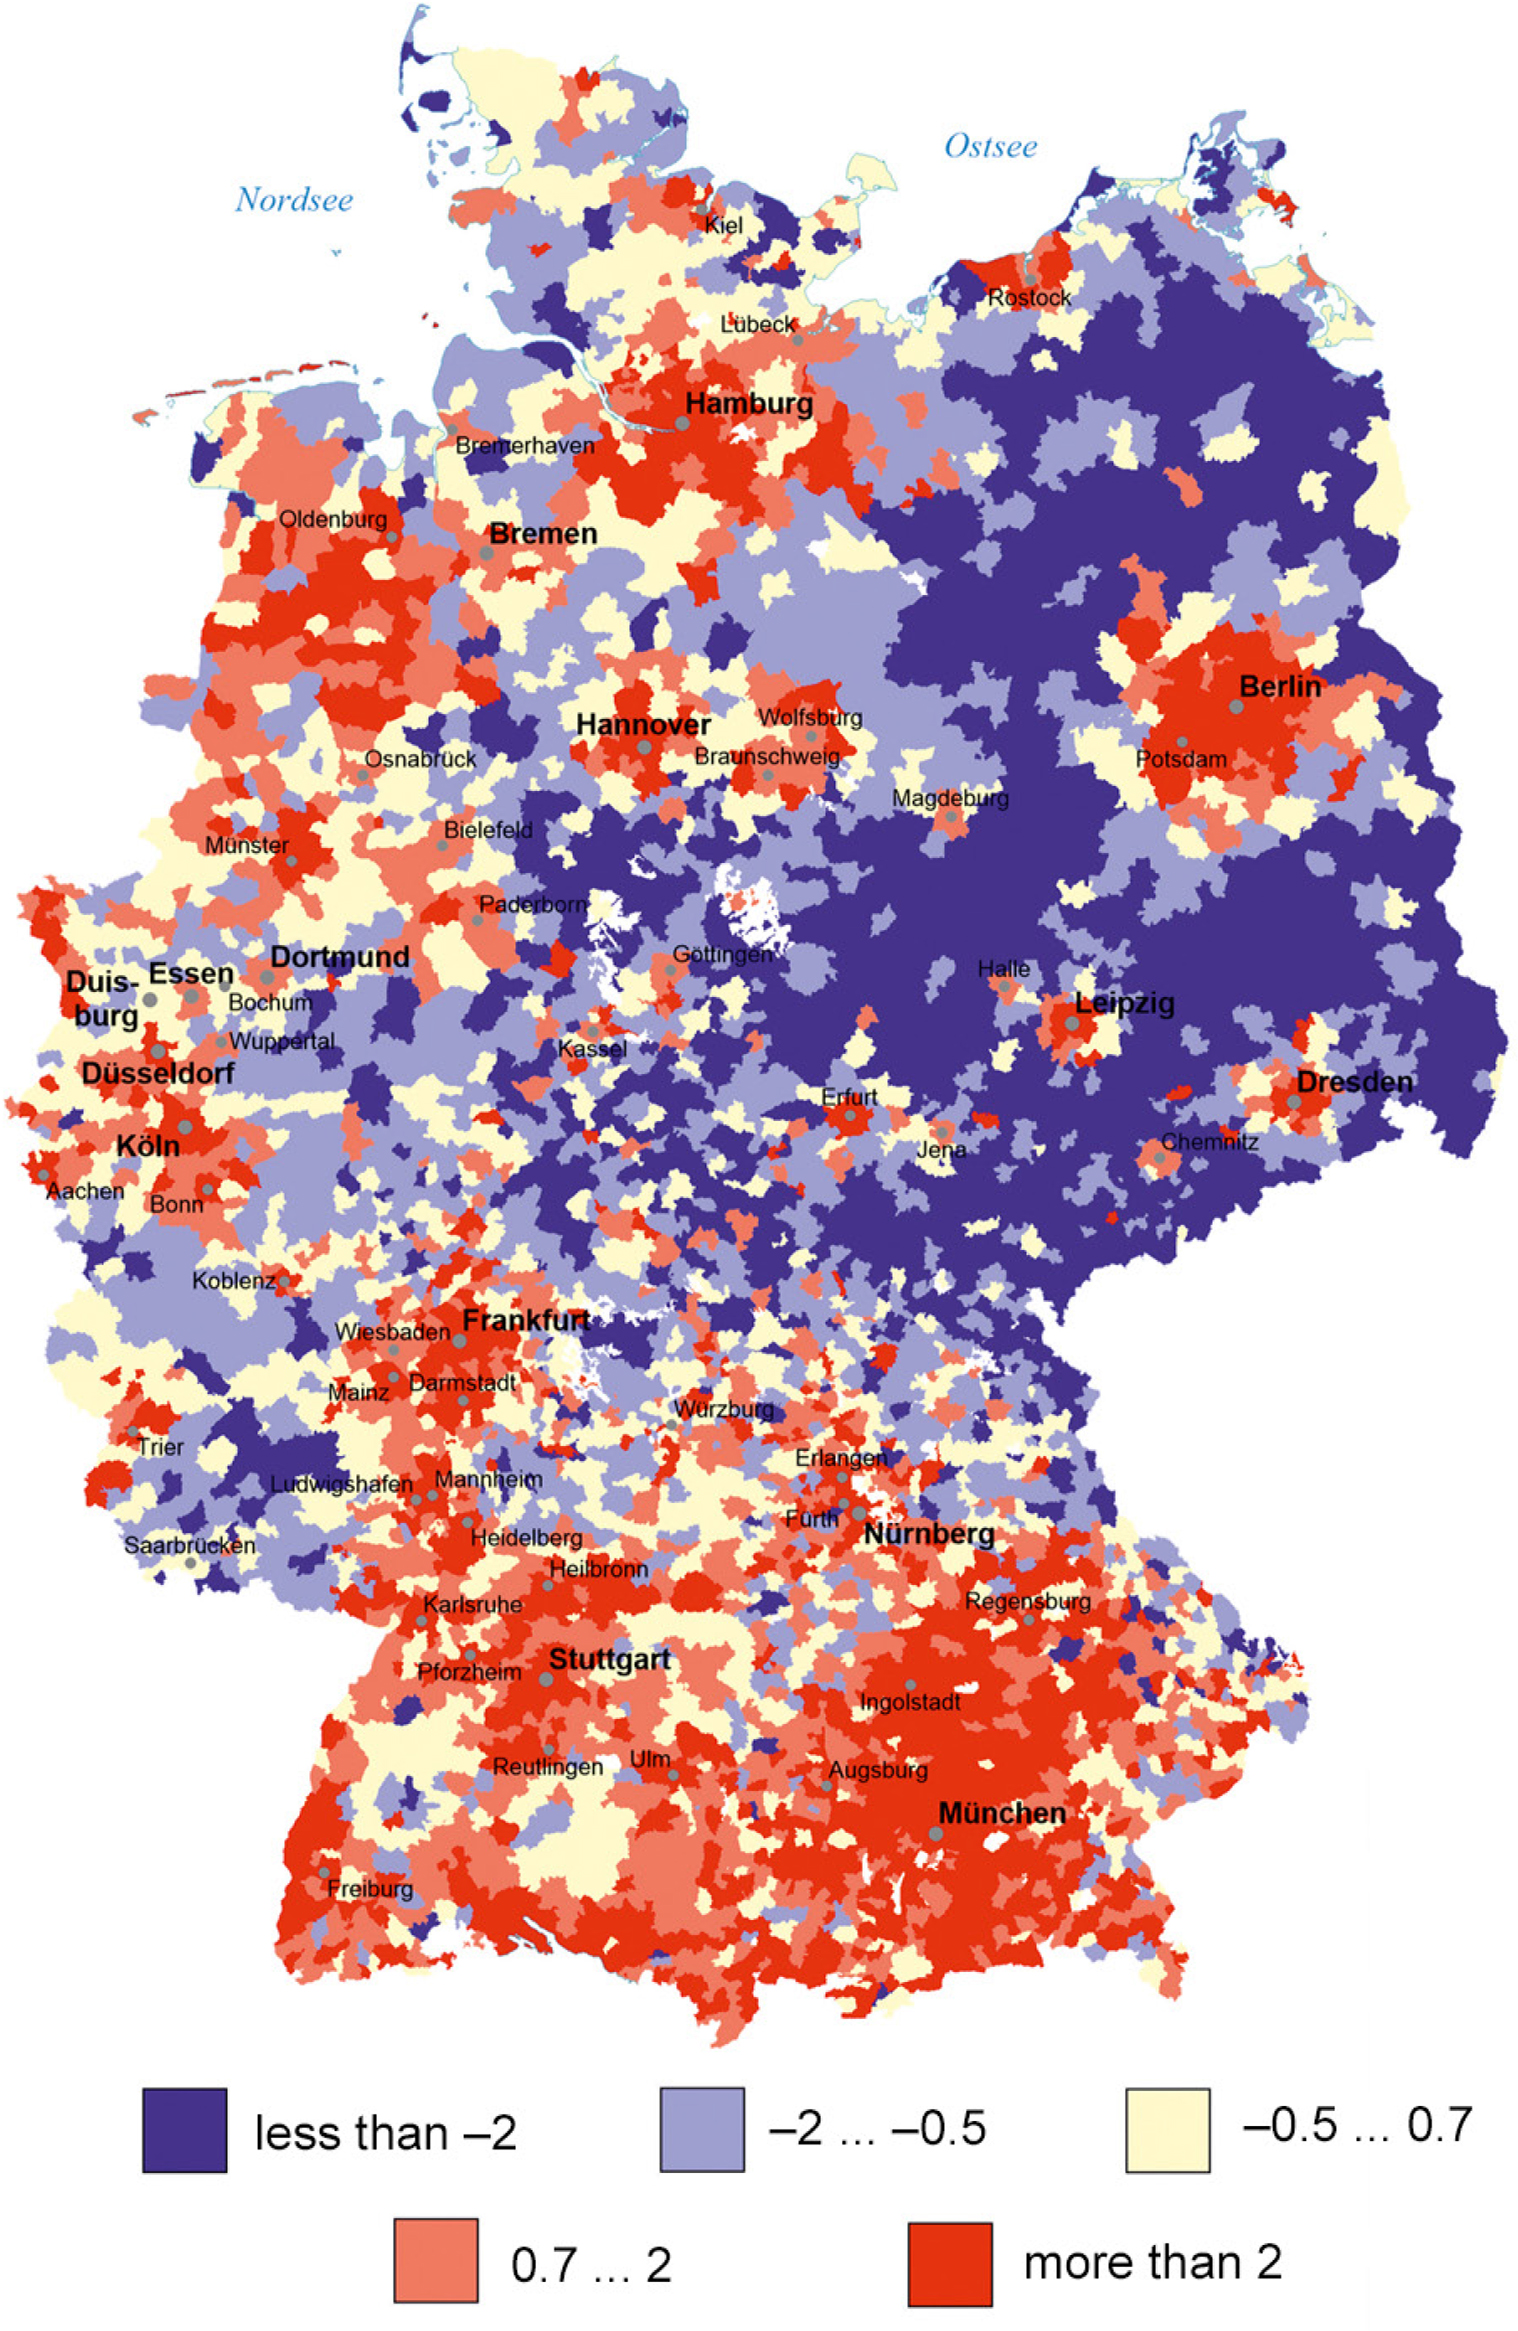
Fig. 7
Population changes in Gemeinde: 2011–2014 (2011 = 100%).
Source: Bundesinstitut für Bau-, Stadt- und Raumforschung, Bonn, 2017.
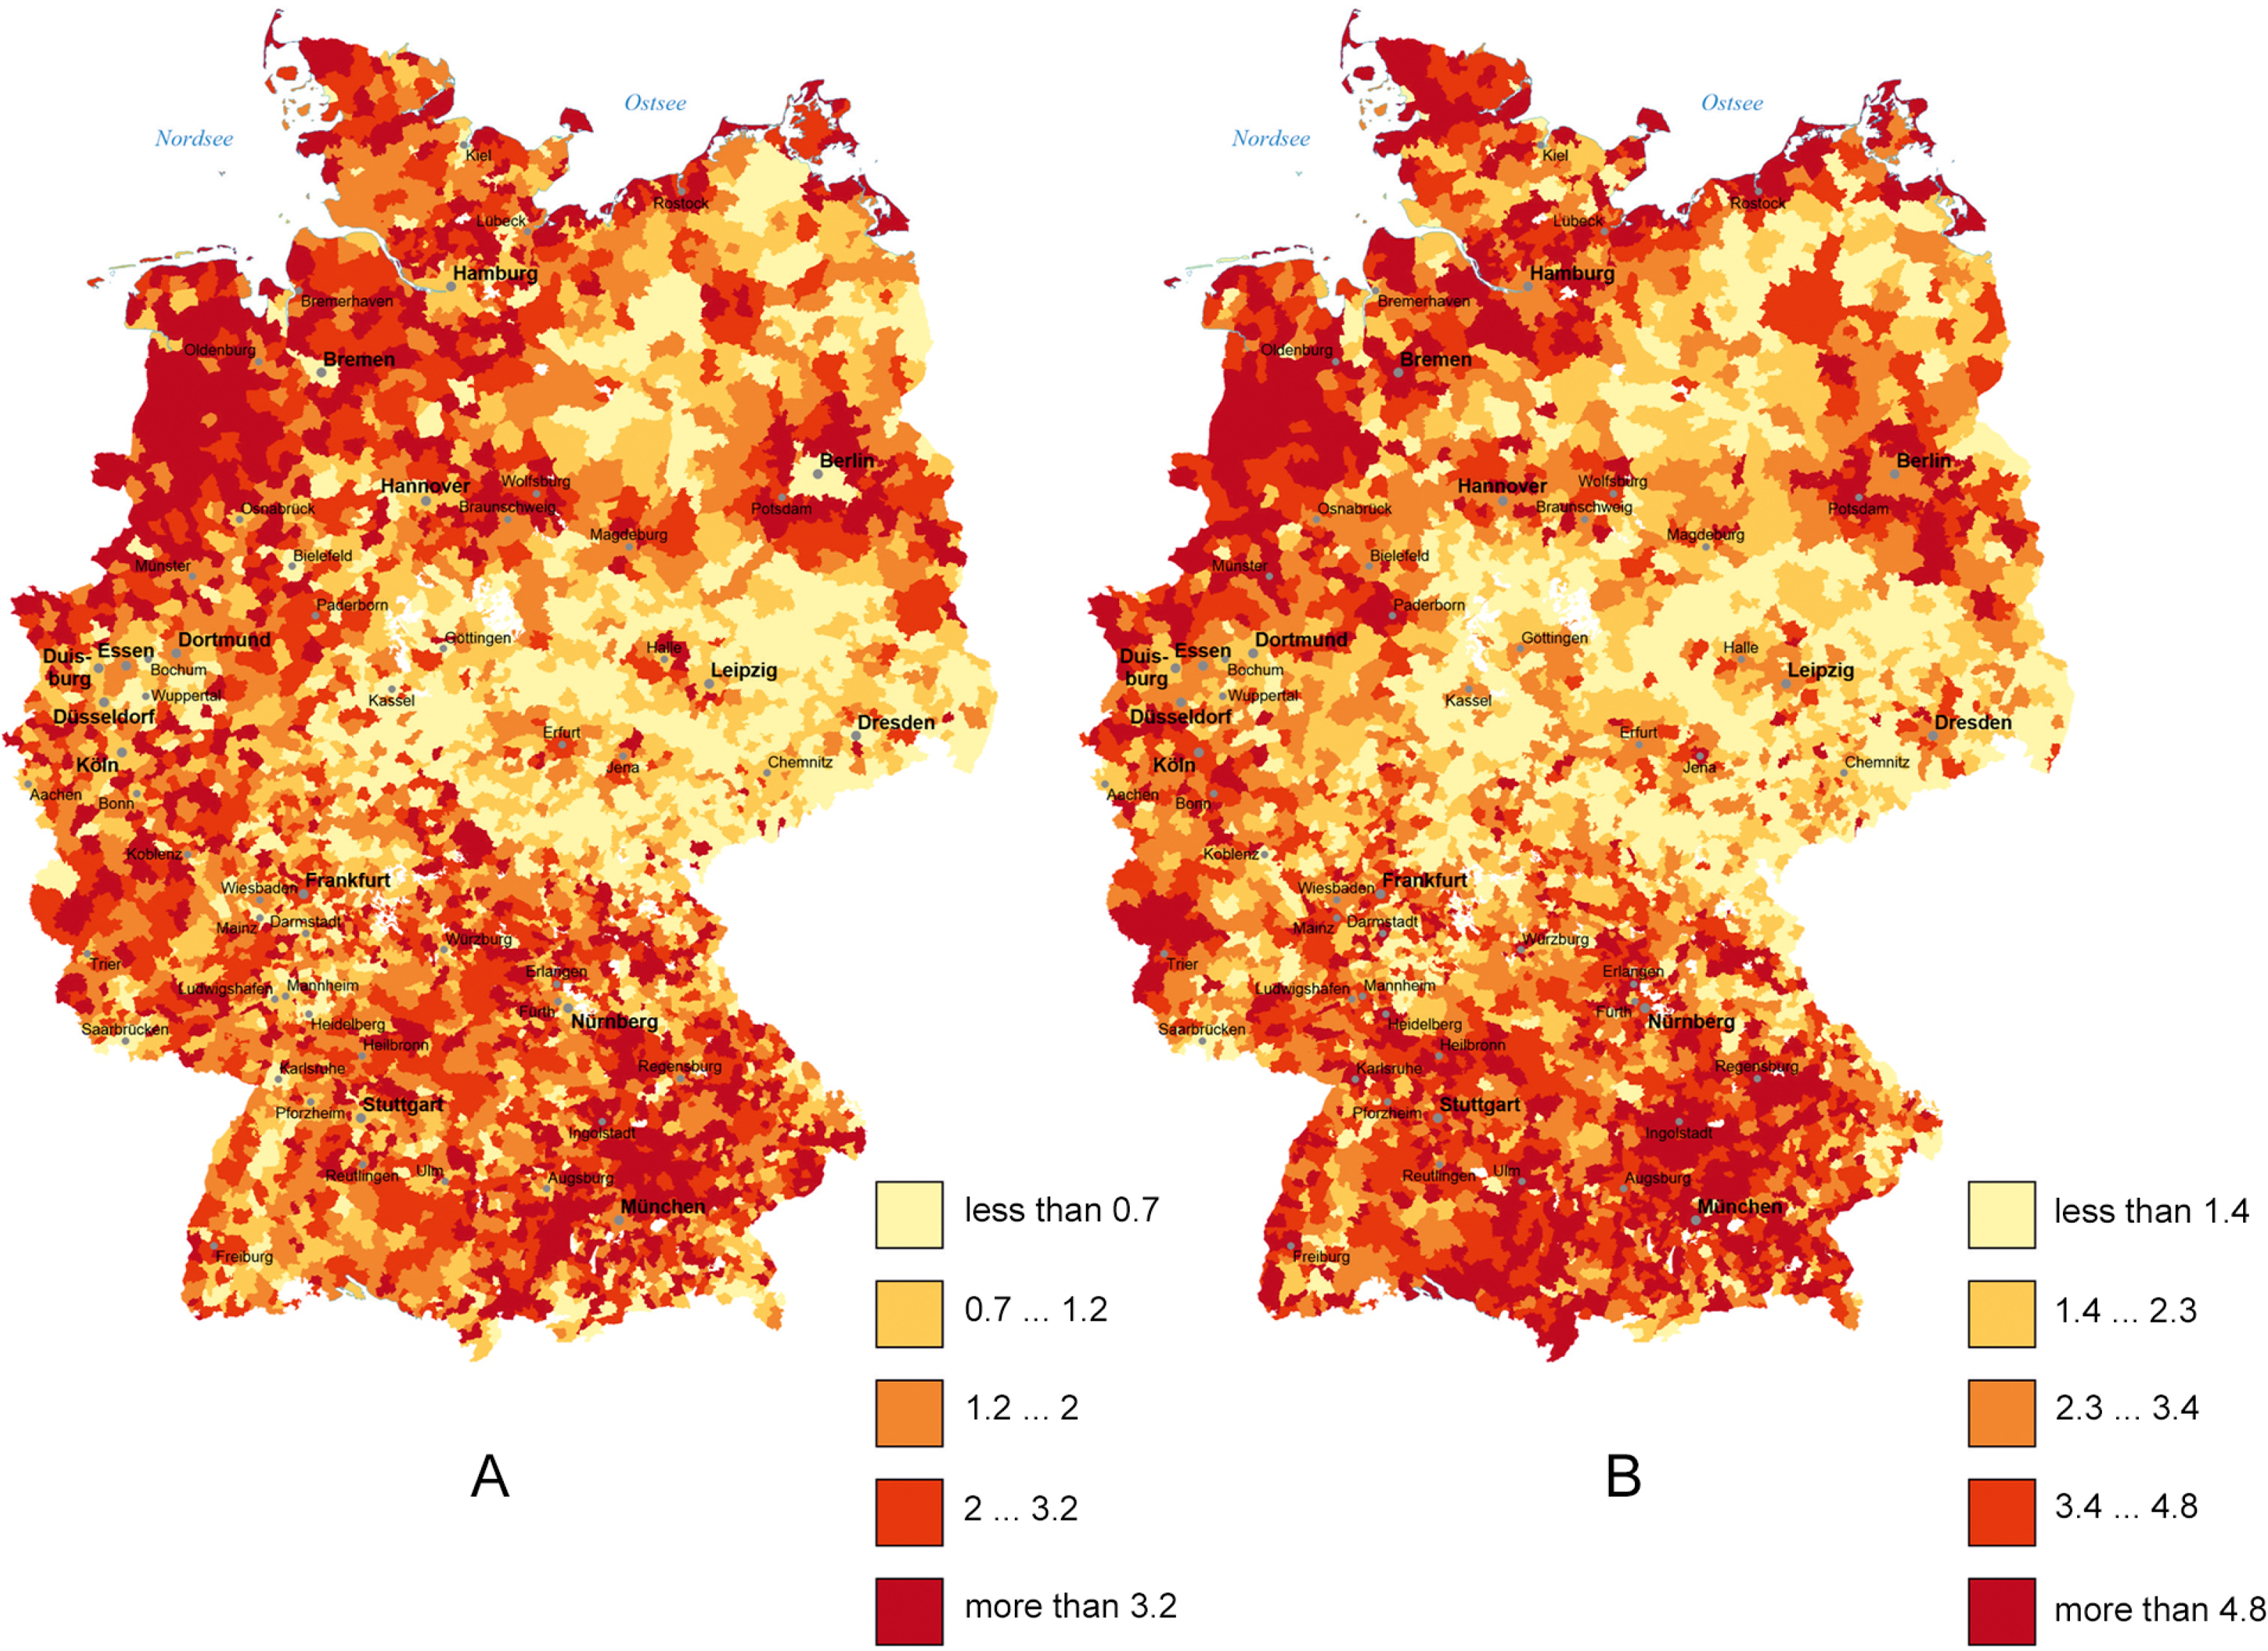
Fig. 8
Number of new residential buildings completed per 1,000 population in Gemeinden in Germany.
Source: Bundesinstitut für Bau-, Stadt- und Raumforschung, Bonn, 2017.