
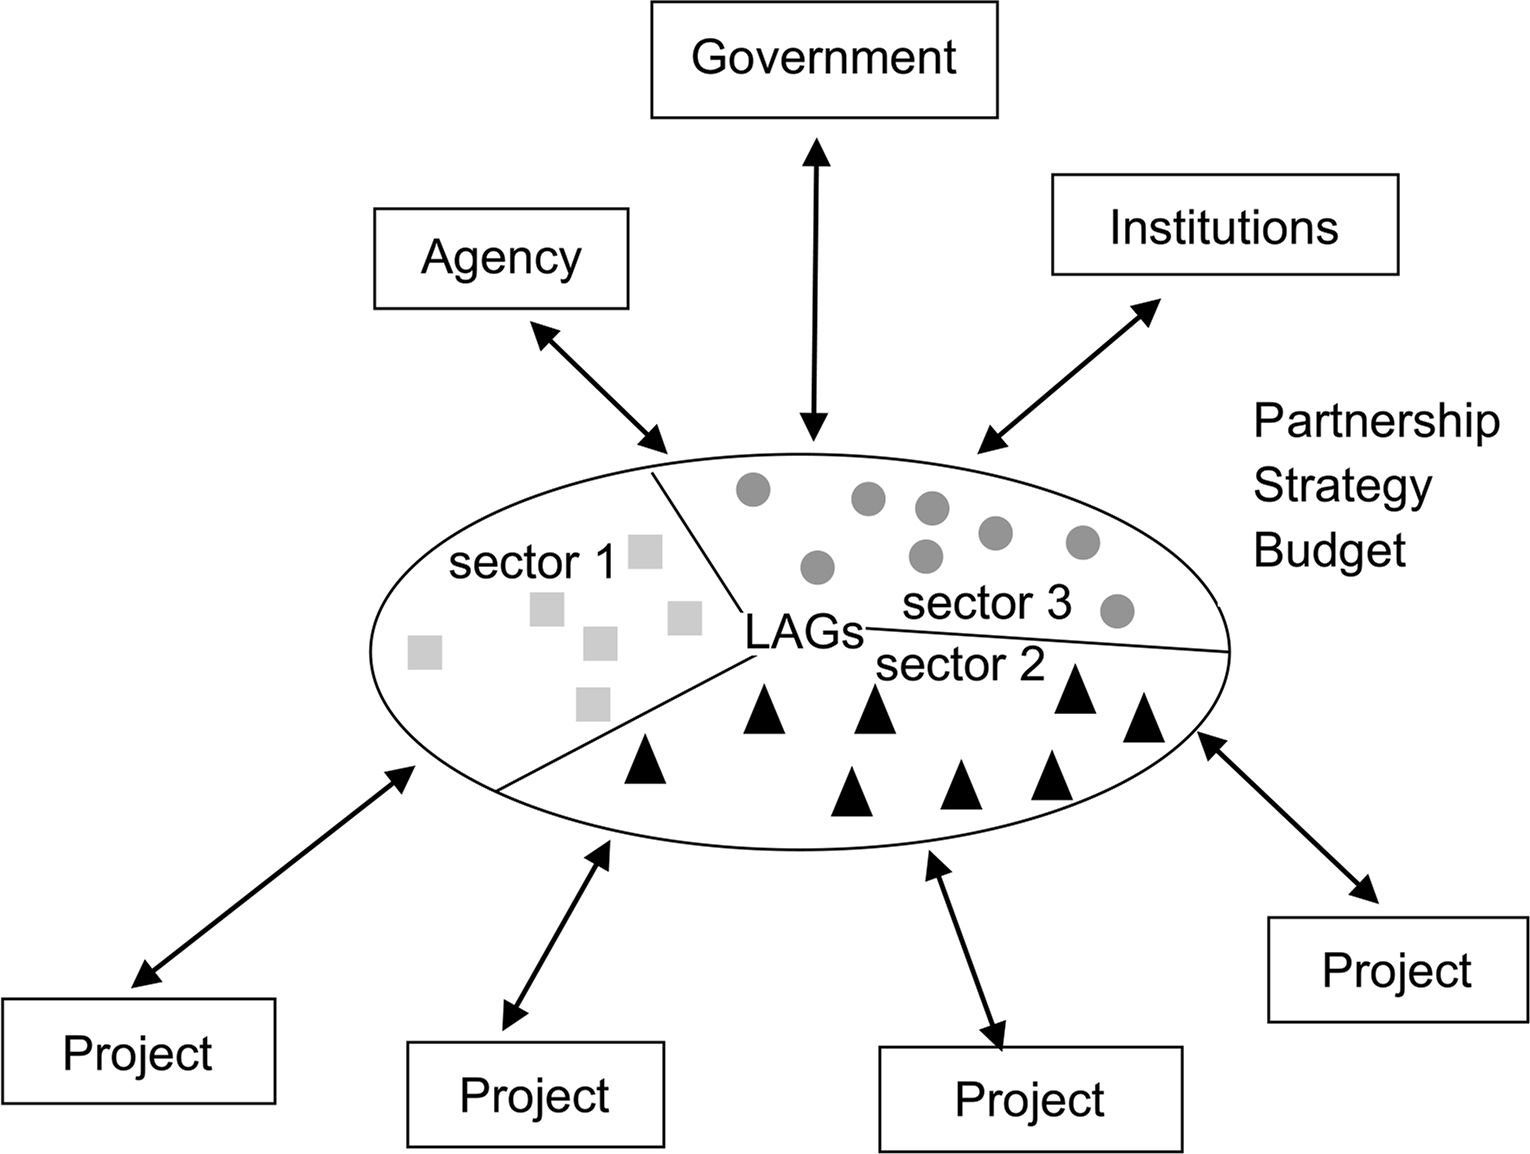
Fig. 1
Model of the LEADER type of approach.
Source: based on Kamiński, Kwatera (2005) and Iwańska (2010).
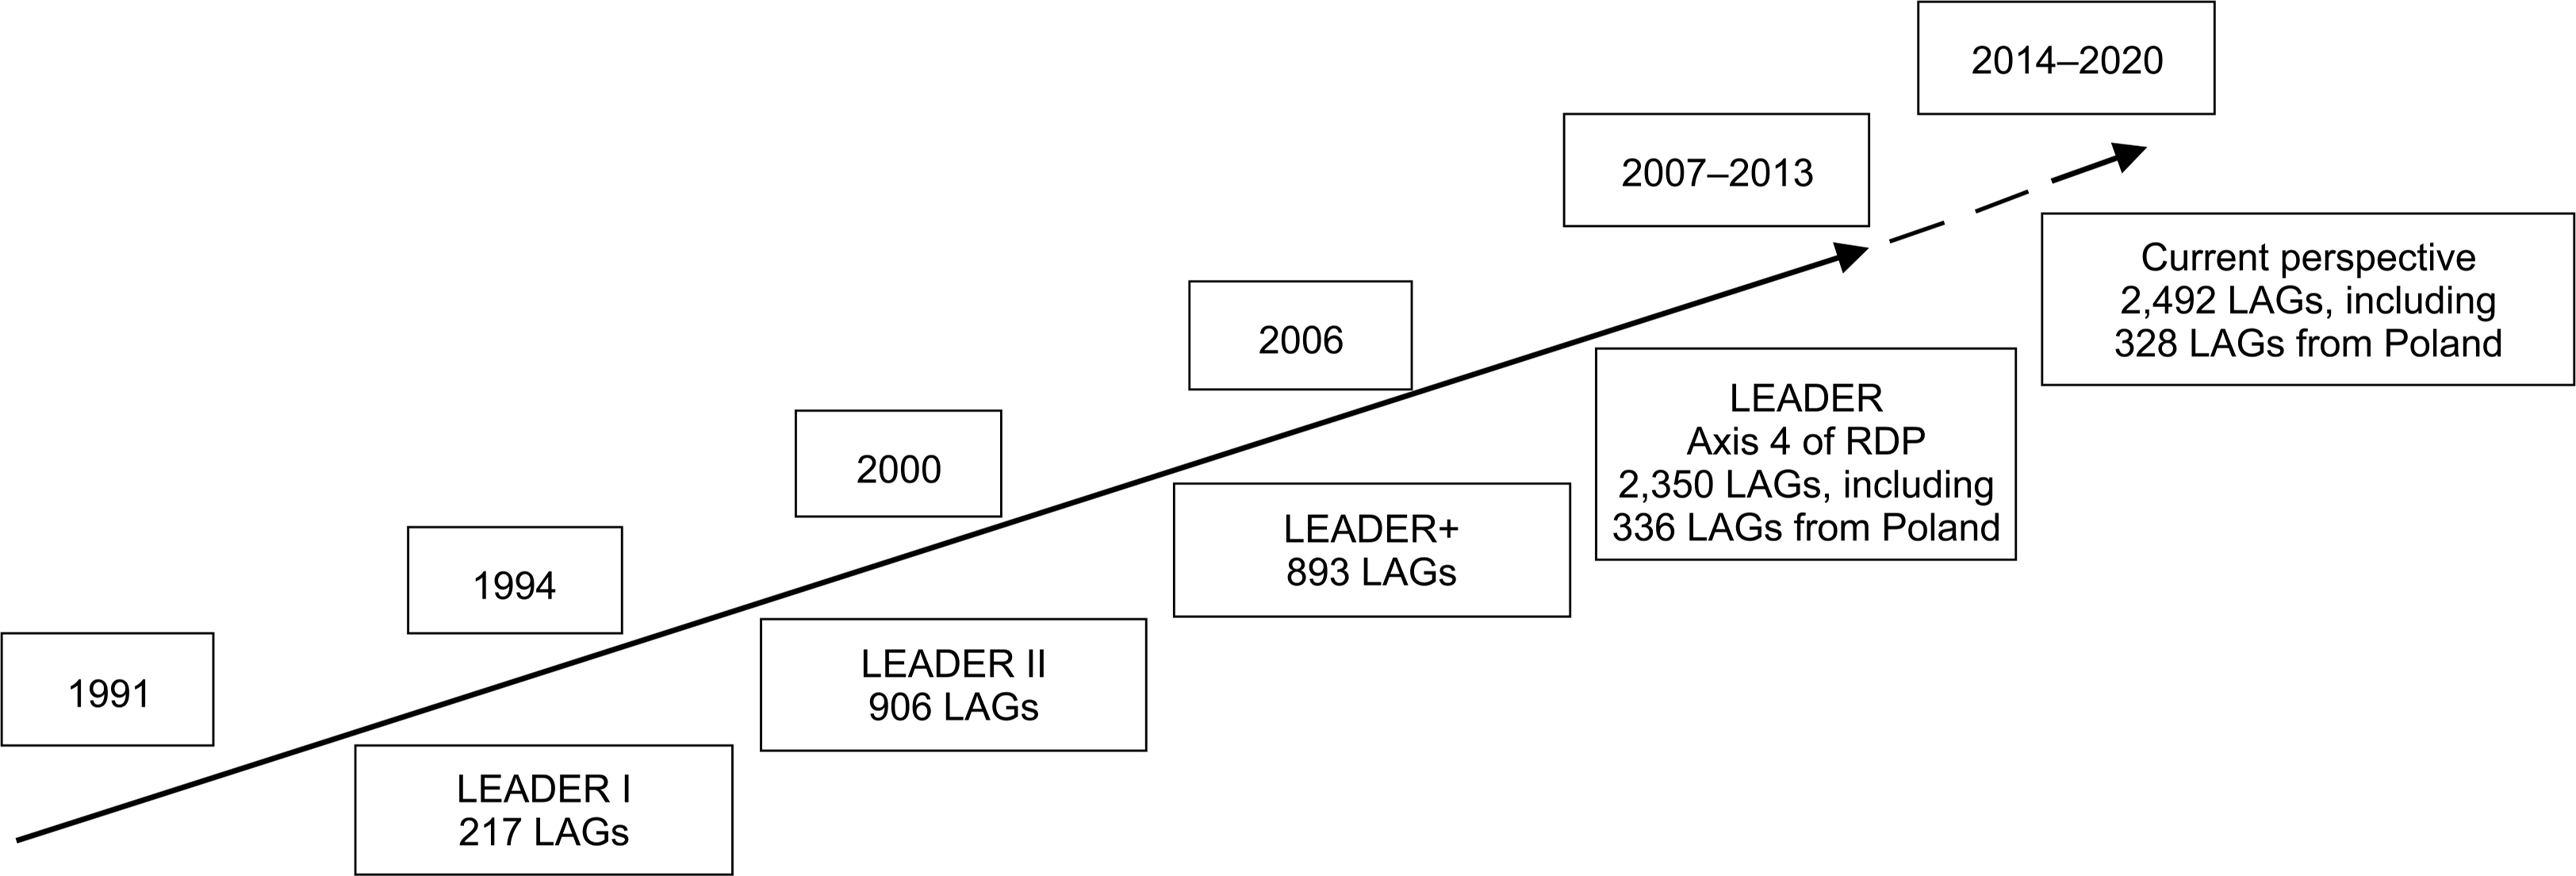
Fig. 2
Five stages of the LEADER programme and the number of LAGs implementing the programme in individual years.
Source: own compilation on the basis of Kieft, Manintveld (2004).
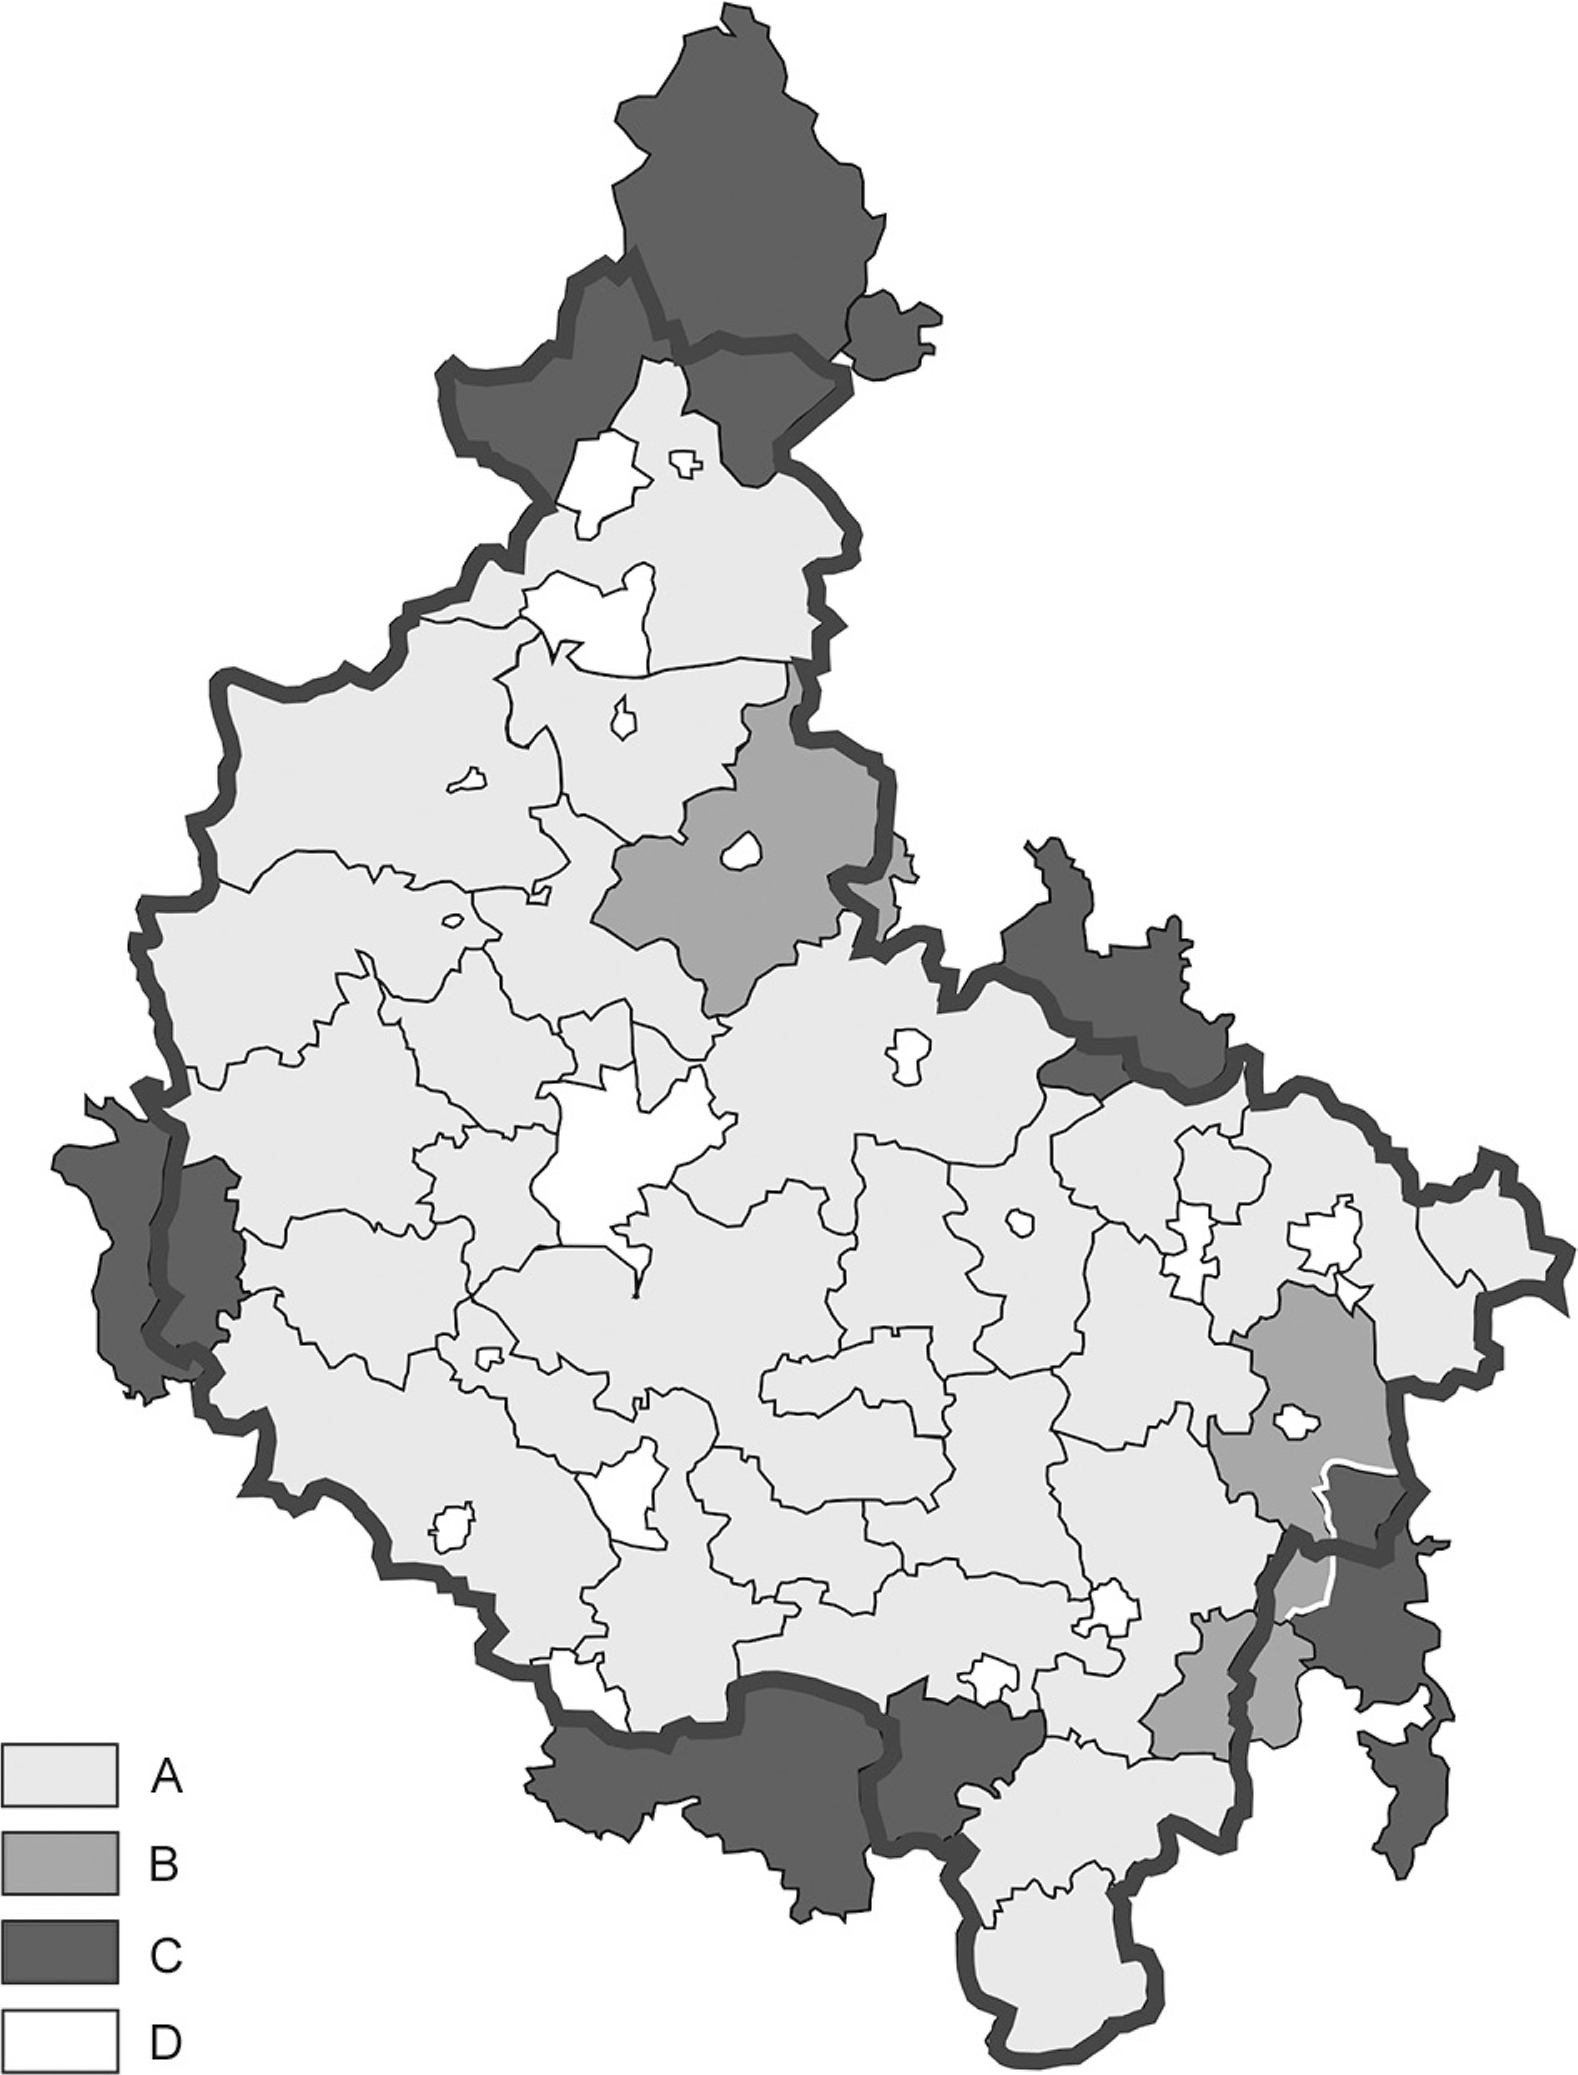
Fig. 3
Distribution of LAGs in Wielkopolskie Voivodeship.
Legend: I – LAGs operating in voivodeship; B – LAGs of inter-voivodeship range headquartered in Wielkopolska; C – LAGs of inter-voivodeship range headquartered outside Wielkopolska; D – areas with no LAGs.
Source: own compilation on the basis of the website http://www.minrol.gov.pl/pol/Media/Files/mapa-LAGs-PL; numbering on the basis of data from the Marshal’s Office of Wielkopolskie Voivodeship.
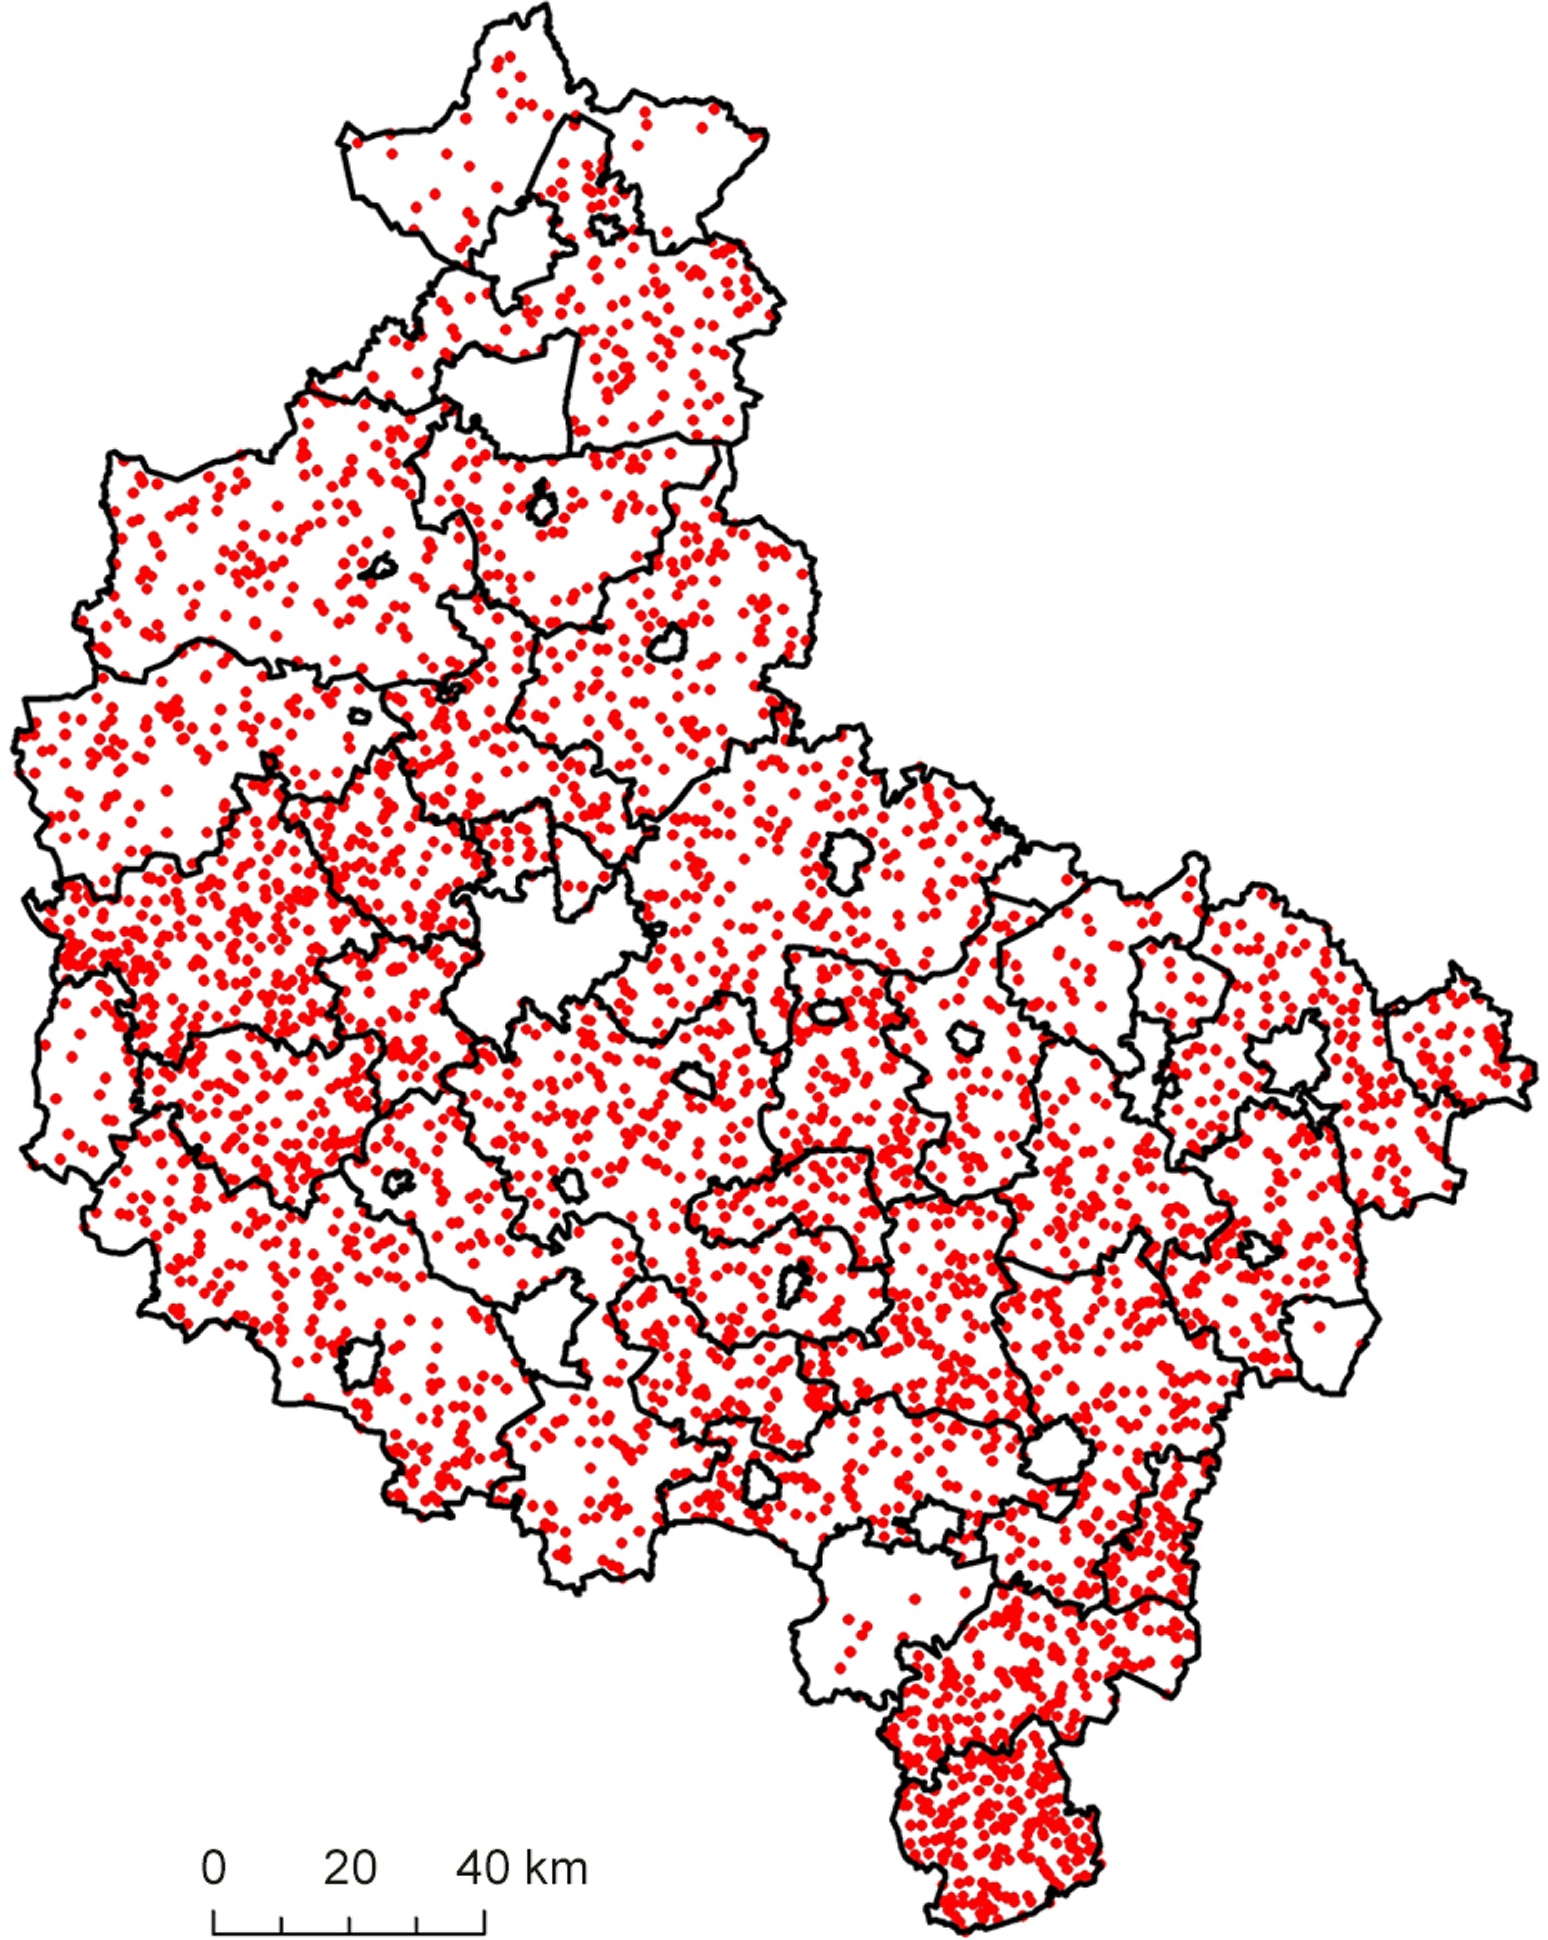
Fig. 4
Number of projects implemented by Wielkopolska LAGs under the measure “Implementation of Local Development Strategies”.
Source: own compilation on the basis of data from the Wielkopolska Marshal’s Office and the Agency for the Development and Modernisation of Agriculture (as of December 2015).
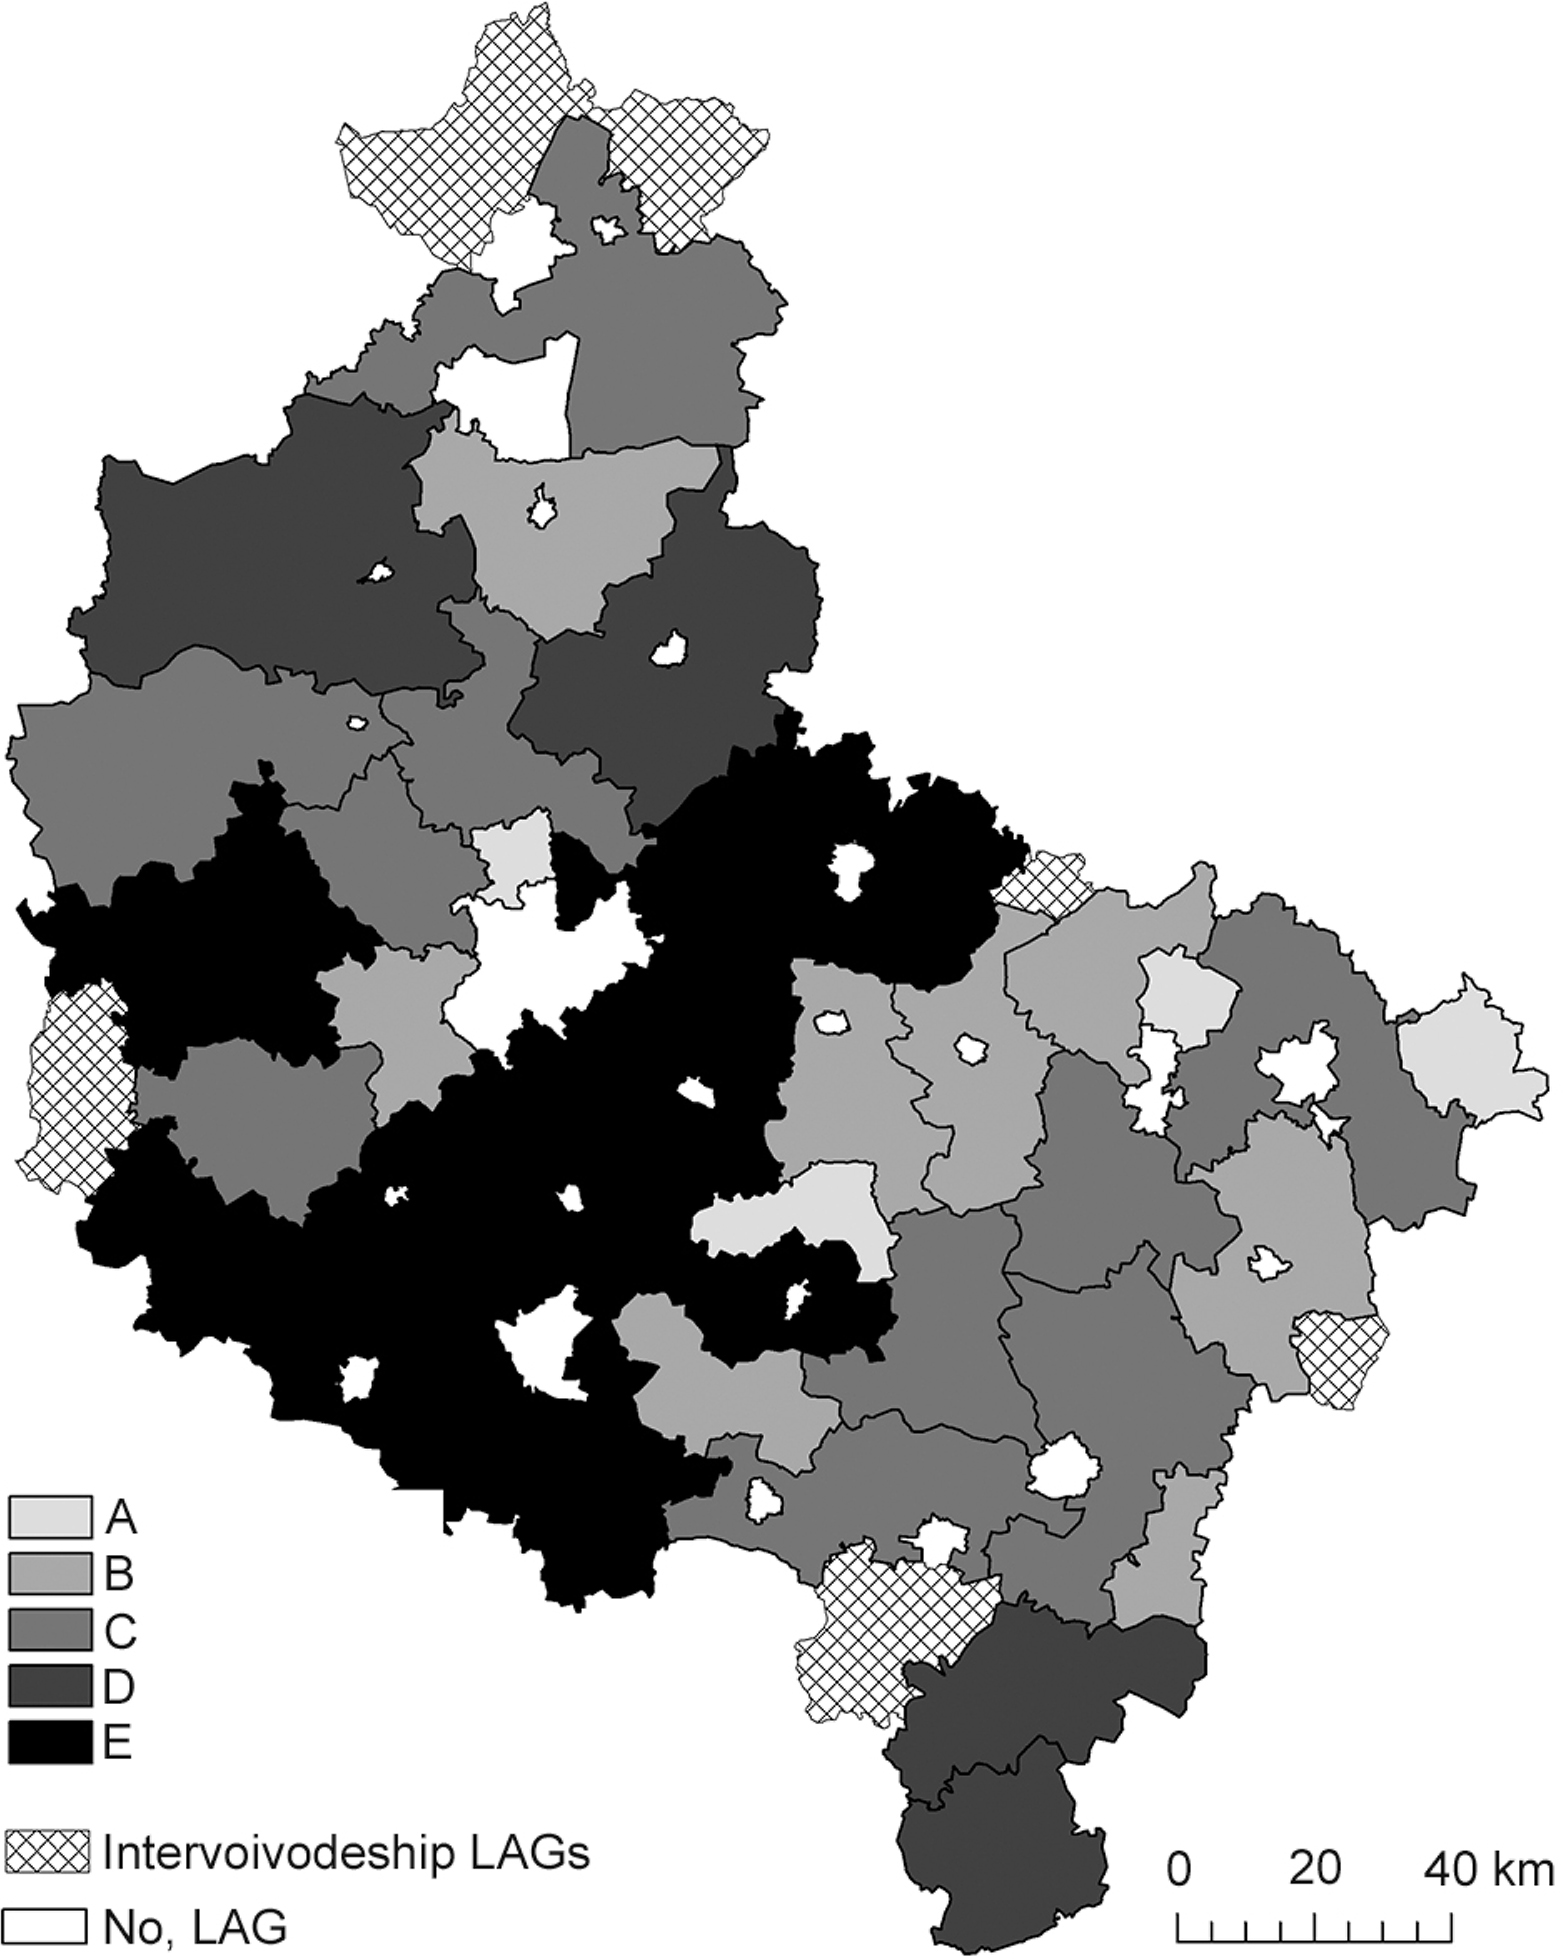
Fig. 5
Division of LAGs in terms of the amount of subsidies received by local entities under the LEADER programme in LAG areas in Wielkopolskie Voivodeship.
Legend: A – very low, B – low, C – medium, D – high, E – very high.
Source: own compilation on the basis of data from the Wielkopolska Marshal’s Office and GUS (Central Statistical Office).