
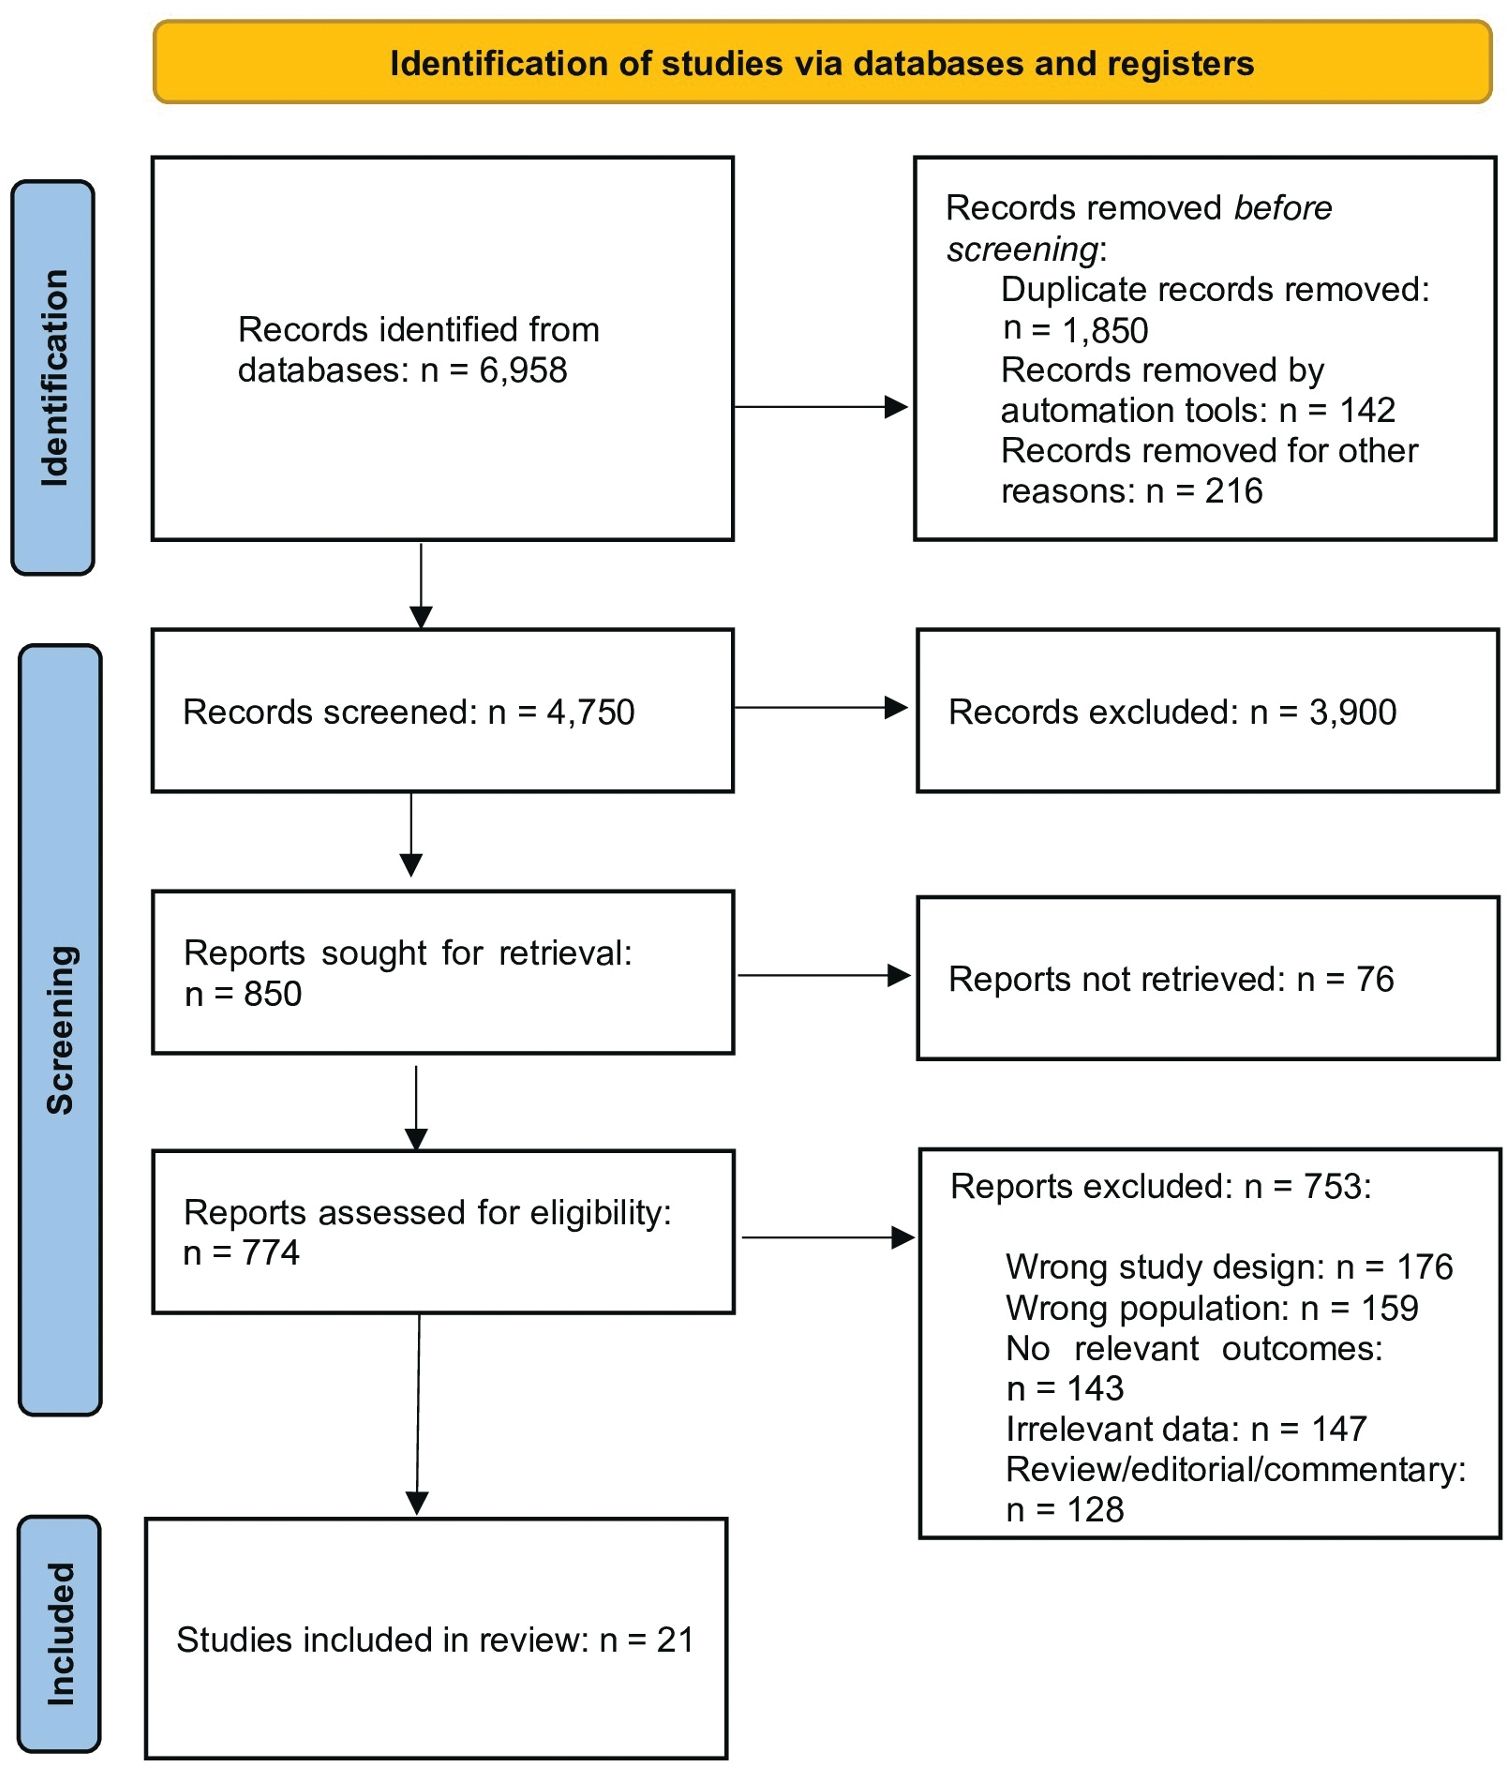
Figure 1.
PRISMA 2020 flow diagram illustrating study identification, screening, eligibility assessment and inclusion. Records were identified from five databases (n = 6958); 21 studies were ultimately included in the systematic review and meta-analysis.
Table 1.
GRADE certainty of evidence for primary outcomes.
Outcome | Studies (N) | Design | RoB | Incons. | Indirect. | Imprec. | Pub. Bias | Certainty | Effect [95% CI] |
|---|---|---|---|---|---|---|---|---|---|
Paediatric: poor asthma control (adjusted) | 2 (n = 475) | Observational | –1 | –1 | 0 | –1 | 0 | VL | OR 2.48 [1.45, 4.23] |
Adults: persistent symptoms (OSA-risk questionnaire) | 2 (n = 1153) | Observational | –1 | 0 | 0 | 0 | –1 | Low | OR 1.74 [1.49, 2.02] |
Adults: persistent symptoms (diagnosed OSA) | 2 (n = 1553) | Observational | –1 | –1 | 0 | –1 | 0 | VL | OR 2.06 [0.63, 6.77] |
Adults: severe asthma (diagnosed OSA) | 1 (n = 813) | Observational | –1 | –1 | 0 | –1 | 0 | VL | OR 3.49 [1.49, 8.15] |
Adults: poor control (symptom-defined SA) | 1 (n = 428) | Observational | –1 | 0 | 0 | –1 | 0 | VL | OR 1.77 [1.01, 3.07] |
Adults: hospital readmission (OSA coded) | 1 (n = 65731) | Observational | –1 | 0 | 0 | 0 | 0 | Low | IRR/HR 1.09 [1.04, 1.15] |
Adults: severe exacerbation (OSA by PSG) | 1 (n = 303) | Observational | –1 | 0 | 0 | –1 | 0 | VL | OR 14.23 [4.60, 44.04] |
Paediatric: length of stay (OSA coded) | 1 (n = 564,468) | Observational | –1 | 0 | 0 | 0 | 0 | Low | IRR 1.34 [1.28, 1.40] |
Paediatric: mechanical ventilation (OSA coded) | 1 (n = 564,468) | Observational | –1 | –1 | 0 | 0 | 0 | VL | OR 6.62 [4.29, 10.22] |
Asthma predicts incident OSA (bidirectional) | 4–6 (≥200,000) | Observational | –1 | –1 | 0 | –1 | 0 | VL | OR/HR/RR 2.11 [1.35, 3.29] |
OSA/SDB prevalence in asthma (PSG/ HSAT) | 7 (n = 592) | Observational | –1 | –1 | 0 | –1 | 0 | VL | 62.3% [34.7%, 83.7%] |
[i] CI, confidence interval; HR: hazard ratio; IRR: incidence rate ratio; OR, odds ratio; OSA, obstructive sleep apnoea; PSG, polysomnography; RR: relative risk; SDB, sleep-disordered breathing.
Table 2.
Characteristics of included studies
Study, Year [Ref] | Country | Design | Population/ Setting | N | Age group | Female (%) | BMI | Asthma diagnosis | OSA/SDB measure | Threshold | OSA/SDB prevalence | Outcomes | Effect measure | Key effect estimate [95% Cl] | Covariates adjusted | Overall RoB |
|---|---|---|---|---|---|---|---|---|---|---|---|---|---|---|---|---|
Kheirandish-Gozal 2011 (19) | USA | Prospective referred cohort; before-after T&A | Children with poorly controlled asthma (PCA), age 3–10 years | 92 | Paediatric | NR | NR | Physician diagnosis | Overnight PSG | AH I ≥ 5/hrTST | 58/92 (63.0%) | Exacerbations/ year; beta-agonist use; asthma symptom score | Pre-post | Exacerba tions: –56.1%; Rescue: –51.2% | Age, sex (T&A non-ran-domised) | Serious |
Araujo 2022 (20) | Brazil | Cross- sectional | Severe asthma patients on biologic therapy | 56 | Adult | 78.6% | 34.3 kg/m2 | Physician diagnosis; severe GINA criteria | HSAT (Apnea-Link Air) | RDI ≥ 5/hr | 30/56 (53.6%) | ACT; asthma control classification | OR | ACT association: null | BMI, smoking | Serious |
Byun 2013 (21) | South Korea | Cross-sec-tional clinic sample | Pulmonary/sleep clinic patients with SDB symptoms | 167 | Adult | 40.7% | NR | Physician diagnosis | ApneaLink + PSG subset | AHI ≥ 5 | 111/167 (66.5%) | Asthma predicts OSA; OSA prevalence by asthma severity | OR | OR 4.25 [1.50, 12.16] | Age, sex, BMI, smoking | Serious |
Teodorescu 2012 (24) | USA | Cross-sec-tional tertiary asthma clinic | Adult asthma clinic patients age 18–75 | 752 | Adult | 67.0% | 32.0 kg/m2 | Physician diagnosis | SA-SDQ + medical record | SA-SDQ ≥ 36 (M), ≥ 32 (F) | High-risk 212/752; Diagnosed 60/752 | Persistent daytime/nighttime symptoms; beta-agonist use | OR | High-risk: OR 1.96 [1.31, 2.94] | Age, sex, BMI, rhinitis, GERD, ICS | Serious |
Teodorescu 2013 (25) | USA | Cross-sec-tional asthma clinic | Older (≥40 year) and younger (< 40 year) adult asthma patients | 813 | Adult | 67.0% | 31.5 kg/m2 | Physician diagnosis | Medical record diagnosis | Record-based | Older OSA 13%; younger OSA 7% | Persistent nocturnal symptoms; severe asthma | OR | Nocturnal older: OR 4.56 [1.55, 13.43]; Severe asthma pooled: OR 3.49 [1.49, 8.15] | Age, sex, BMI, rhinitis, smoking | Serious |
Teodorescu 2015 SARP (26) | USA | Cross-sectional multi centre SARP | Severe asthma, n on-severe asthma, and normal controls | 401 | Adult | 69.0% | 31.8 kg/m2 | SARP physician diagnosis | SA-SDQ questionnaire | High risk: men ≥ 36, women ≥ 32 | Severe asthma 26% high-risk | Daily symptoms; beta-agonist; nightly symptoms | OR | Daily symptoms pooled: OR 1.74 [1.49, 2.02] | Age, sex, BMI, rhinitis, smoking | Serious |
Teodorescu 2015 JAMA (12) | USA | Prospective population-based cohort | Wisconsin Sleep Cohort adults free of OSA at baseline | 547 | Adult | 54.1% | 28.9 kg/m2 | Self-report question naire | Laboratory PSG | AHI ≥5 or PAP | Incident OSA: 22/81 asthma vs 75/466 no asthma | Incident OSA | RR | RR 1.39 [1.06, 1.82] | Age, sex, BMI, smoking, sleepiness | Serious |
Wang 2016 (34) | China | Matched clinical observational | Adults with asthma and matched healthy controls; all had PSG | 303 | Adult | NR | NR | Physician diagnosis; spirometry | Full-night PSG | Threshold NE | Asthma 19.2%; controls 9.6% | Severe asthma exacerbation; OSA prevalence | OR/RR | Exacerbation: OR 14.23 [4.60, 44.04]; Prevalence: RR 2.25 [1.15, 4.40] | Matching (age,sex, BMI) | Serious |
Shen 2015 (13) | Taiwan | Retrospective population cohort | Newly diagnosed adult asthma vs matched comparators | 194,187 | Adult | 55.0% | NR | Administrative ICD (asthma) | Administrative claims OSA | N/A | Incident OSA rate: 12.1 vs 4.84/1000 PY | Incident OSA | HR | HR 1.87 [1.61, 2.17] | Age, sex, income, comorbidities | Serious |
Hi ray am a 2020 (30) | USA | Retrospective administrative cohort | Adults 18–54 hospitalised for asthma; 7 State Inpatient DBs | 65,731 | Adult | 61.0% | NR | ICD hospitalisation code | ICD-9-CM OSA diagnosis | N/A | 10.0% | All-cause and asthma-specific readmission; time to readmission | IRR/HR | Pooled IRR/ HR: 1.09 [1.04, 1.15] | Age, sex, obesity, depression, SES | Moderate |
Kauppi 2016 (31) | Finland | Retrospective before-after CPAP | CPAP users with pre-existing asthma | 152 | Adult | 60.0% | 30.4 kg/m2 | Physician diagnosis | Home respiratory polygraphy | REI ≥ 15 or 5–14 with symptoms | All enrolled (100%) | ACT improvement after longterm CPAP | Pre-post | ACT improvement: 29.0% | None (uncontrolled) | Serious |
Serrano- Pariente 2016 (23) | Spain | Prospective multi centre before-after CPAP | Adults with asthma + moder-ate-severe OSA starting CPAP | 99 | Adult | 71.0% | 32.3 kg/m2 | Physician diagnosis; GINA criteria | PSG or cardiorespiratory polygraphy | RDI ≥ 20 | All enrolled (100%) | Exacerbations; ACQ; mini-AQLQ | Pre-post | Exacerba tions: –51.4%; ACQ: –28.1% | CPAP compliance subgroup | Serious |
Study, Year [Ref] | Country | Design | Population/ Setting | N | Age group | Female (%) | BMI | Asthma diagnosis | OSA/SDB measure | Threshold | OSA/SDB prevalence | Outcomes | Effect measure | Key effect estimate [95% Cl] | Covariates adjusted | Overall RoB |
Sato 2021 (27) | Japan | Prospective cohort | Middle-aged and older adult asthma patients with Watch-PAT | 62 | Adult | 63.0% | 24.6 kg/m2 | Physician diagnosis | V\fetch-PAT | pAHI ≥ 5 | 50/62 (80.6%) | Asthma worsening/exacerbation by OSA severity | OR | pAHI not retained in final model | Age, sex, BMI, smoking, ICS | Serious |
Sakhamuri 2020 (29) | Trinidad & Tobago | Cross-sectional specialty clinic survey | Adult physician-diagnosed asthma patients in specialty clinics | 428 | Adult | 71.2% | NR | Physician diagnosis | Symptom features (≥ 2 features) | NR | 150/428 (35.0%) | Poor asthma control (ACT < 20); quality of life | OR | ACT < 20: OR 1.77 [1.01, 3.07] | Age, sex, BMI, smoking, GERD | Serious |
Zandieh 2016 (35) | USA | Cross-sec-tional school survey | Urban ninth-grade students | 9565 | Adolescent | 52.0% | NR | Self-reported probable asthma | Self-report questionnaire SDB | Frequent symptoms per criteria | 1220/9565 (12.8%) | Probable asthma vs SDB; bidirectional | OR | Asthma predicts SDB: OR 2.63 [2.30, 3.00]; SDB predicts asthma: OR 2.44 [1.86, 3.20] | Age, sex, race, BMI | Serious |
Li 2015 (32) | China | Cross-sec-tional school survey + me-ta-analysis | Schoolchildren age 5–12 across 8 Chinese cities | 22,478 | Paediatric | 46.0% | NR | Question naire physician-diagnosed | Questionnaire SDB items (snoring, stops, snorts) | Usual/often categories | SDB prevalence 12.0% | Physician-diag-nosed asthma vs SDB | OR | Pooled OR 1.53 [1.03, 2.27] | Age, sex, city, ethnicity | Serious |
Locci 2024 (22) | Italy | Cross- sectional | Children age 5–12 with asthma | 78 | Paediatric | 51.3% | NR | Physician diagnosis | PSQ-SDBS questionnaire | PSQ-SD-BS ≥ 0.33 | 29/78 (37.2%) | Poor asthma control; SDB prevalence | OR | Adjusted OR 2.81 [0.91, 8.64]; Crude OR 4.15 [1.49, 11.60] | Age, sex, BMI, rhinitis, GERD | Serious |
Tao 2024 (36) | China | Cross- sectional | Paediatric asthma outpatients age 0–18 | 397 | Paediatric | 44.8% | NR | Physician diagnosis | PSQ-SRBD questionnaire | PSQ- SRBD ≥ 0.33 | 86/397 (21.7%) | Poor asthma control | OR | Adjusted OR 2.39 [1.30, 4.39]; Crude OR 2.33 [1.35, 4.04] | Age, sex, BMI, rhinitis, medication | Serious |
Tsou 2021 (33) | USA | Retrospective national inpatient database | Children hospitalised for acute asthma exacerbation 2000–2012 | 564,468 | Paediatric | 44.5% | NR | ICD hospitalisation code | Administrative ICD code OSA | N/A | 4209/564,468 (0.75%) | Length of stay; invasive/ non-invasive ventilation | IRR/OR | LOS: IRR 1.34 [1.28, 1.40]; IMV: OR 5.33 [4.35, 6.54]; NIV: OR 8.30 [6.56, 10.51]; Pooled ventilation: OR 6.62 [4.29, 10.22] | Age, sex, year, race, insurance, hospital type | Moderate |
Yigla 2003 (37) | Israel | Prospective clinical series | Difficu It-to-control asthma on long-term oral steroids | 22 | Adult | 54.5% | NR | Physician diagnosis; steroid-dependent | Full-night PSG | RDI≥ 15 + symptoms | 21/22 (95.5%) | Descriptive OSA severity (mild vs moderate-severe) | Descrip tive | 95.5% prevalence; no comparative control outcome | None | Serious |
Madama 2016 (28) | Portugal | Retrospective clinical series | Asthma patients referred for suspected OSA | 47 | Adult | NR | NR | Physician diagnosis | PSG 68%; polygraphy 32% | NE | 27/47 (57.4%) | OSA prevalence; treated follow-up descriptive | Descrip tive | 57.4% prevalence | None | Serious |
[i] ACQ: Asthma Control Questionnaire; ACT: Asthma Control Test; CI, confidence interval; CPAP: continuous positive airway pressure; GINA, Global Initiative for Asthma; GERD: gastro-oesophageal reflux disease; HR: hazard ratio; HSAT: home sleep apnoea test; ICS: inhaled corticosteroid; IRR: incidence rate ratio; NE: not extracted; NR: not reported; OR, odds ratio; OSA: obstructive sleep apnoea; PSG: polysomnography; PSQ: Pediatric Sleep Questionnaire; RR: relative risk; RoB: risk of bias; SA-SDQ: Sleep Apnoea-Sleep Disorders Questionnaire; SDB: sleep-disordered breathing; T&A: adenotonsillectomy.
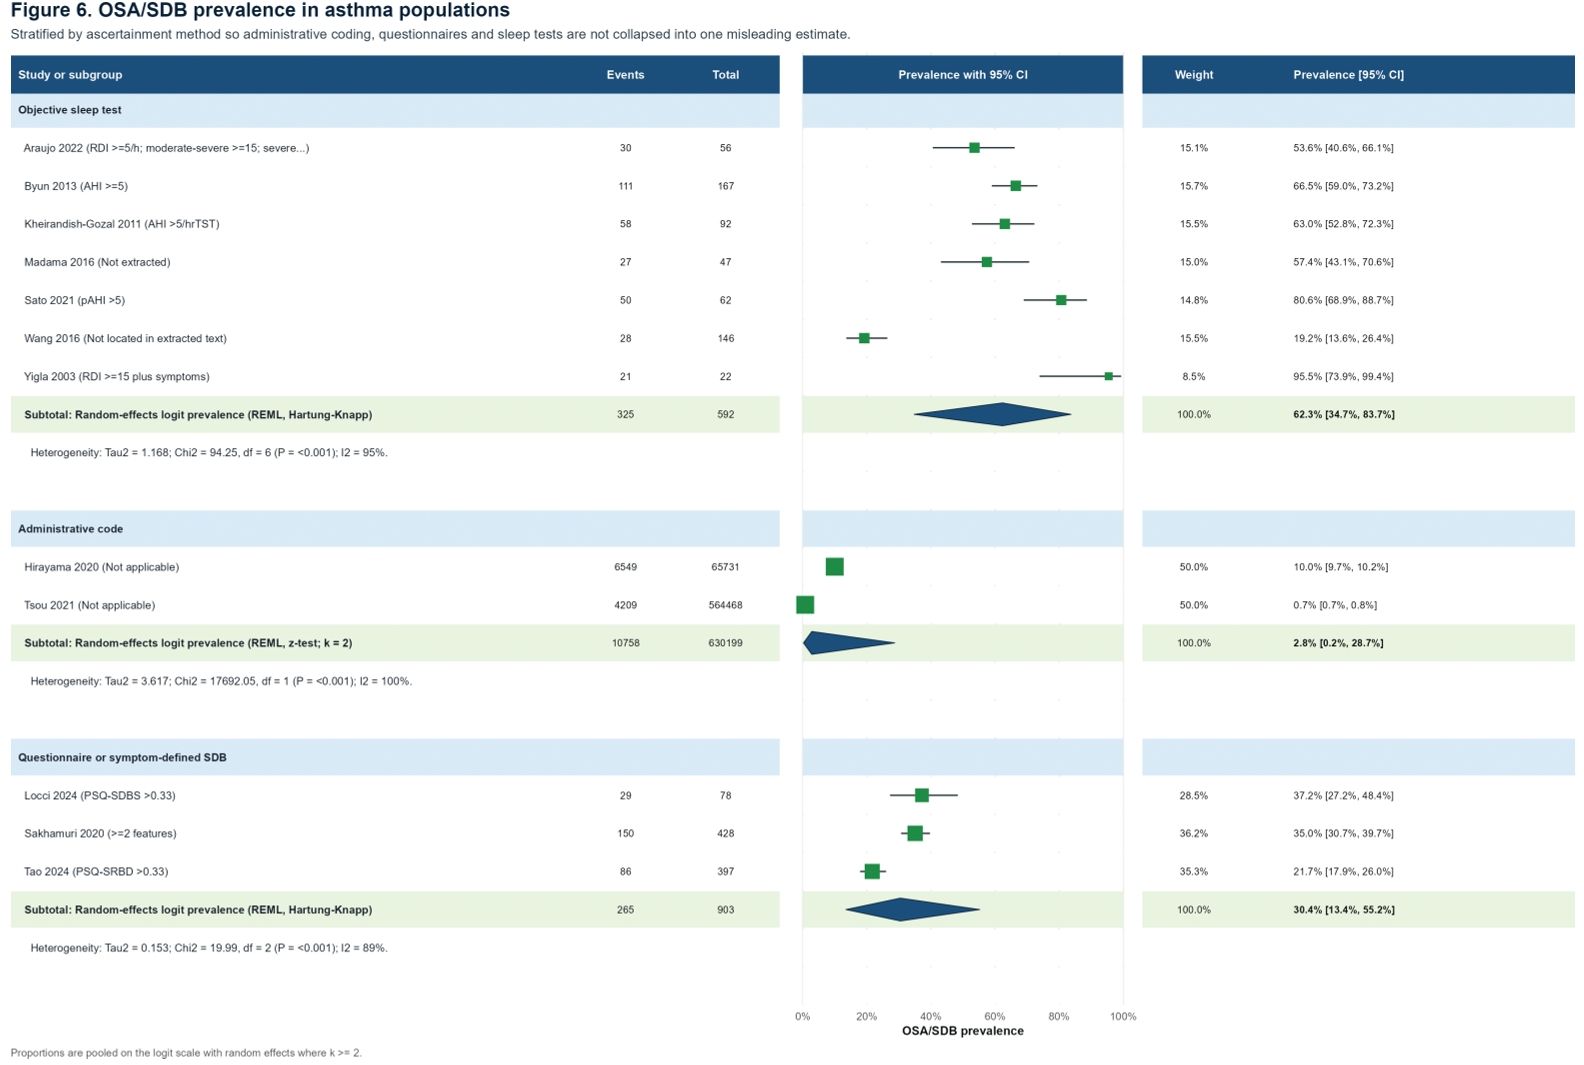
Figure 2.
Forest plot of OSA/SDB prevalence in asthma populations stratified by ascertainment method. Administrative coding, question-naire-based SDB assessment and objective sleep testing are presented in separate subgroups to avoid misleading synthesis. Proportions are pooled on the logit scale with random effects where k ≥ 2. OSA, obstructive sleep apnoea; REML, restricted maximum likelihood; SDB, sleep-disordered breathing.
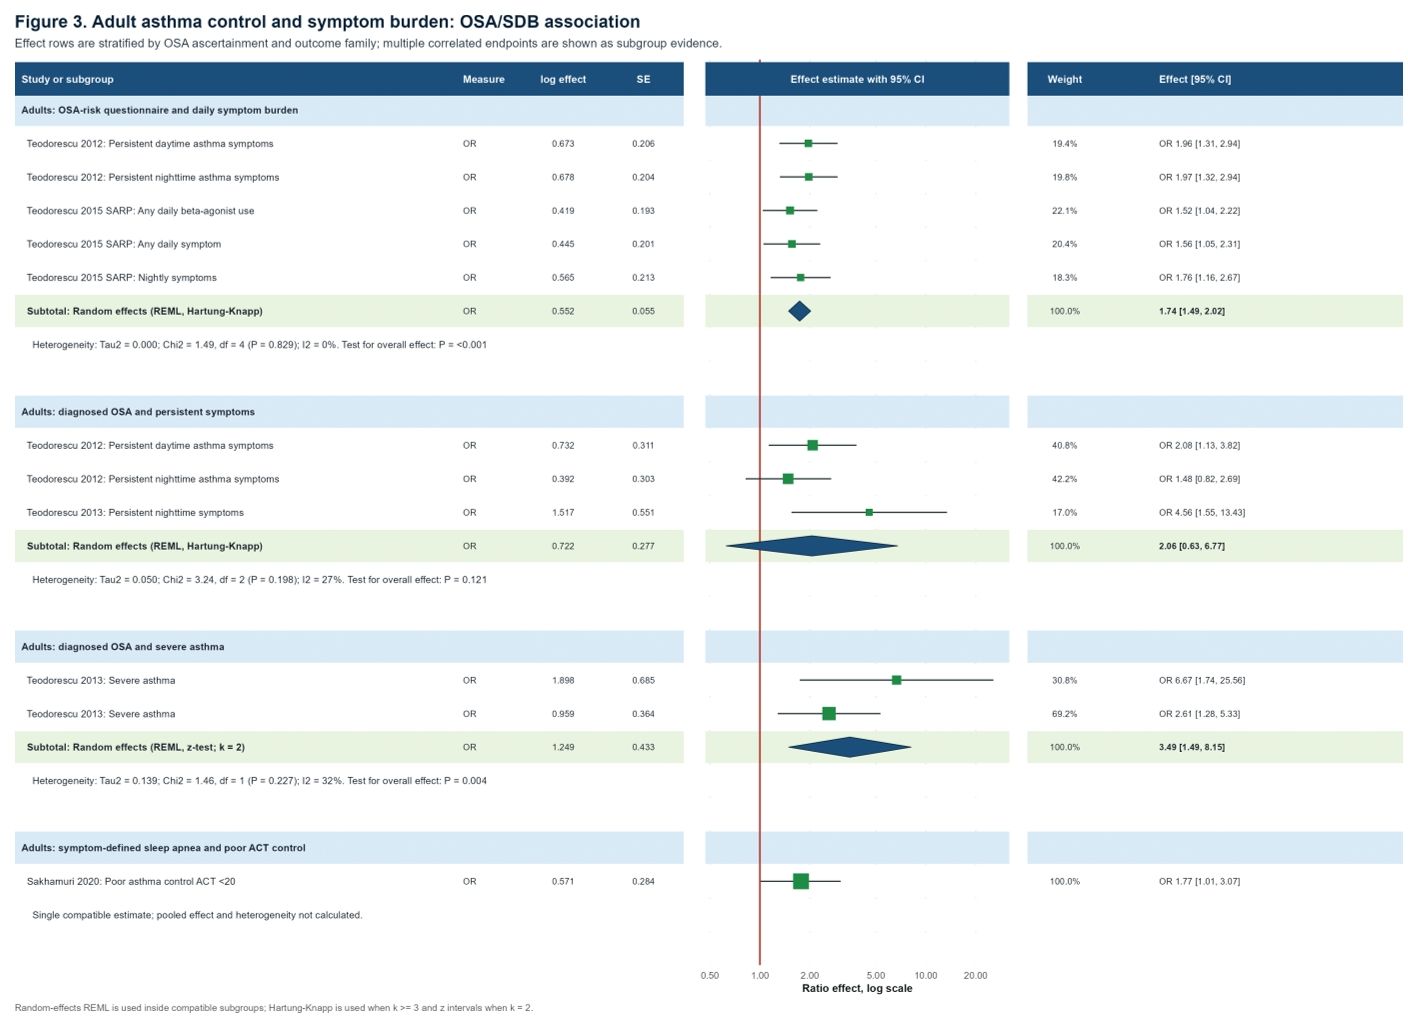
Figure 3.
Forest plot of adult asthma control and symptom burden: OSA/SDB association. Effect rows are stratified by OSA ascertainment method and outcome family; multiple correlated endpoints from the same study are shown as subgroup evidence. Random-effects REML is used inside compatible subgroups; Hartung-Knapp interval correction is applied when k ≥ 3 and z-intervals when k = 2. OSA, obstructive sleep apnea; REML, restricted maximum likelihood; SDB, sleep-disordered breathing.
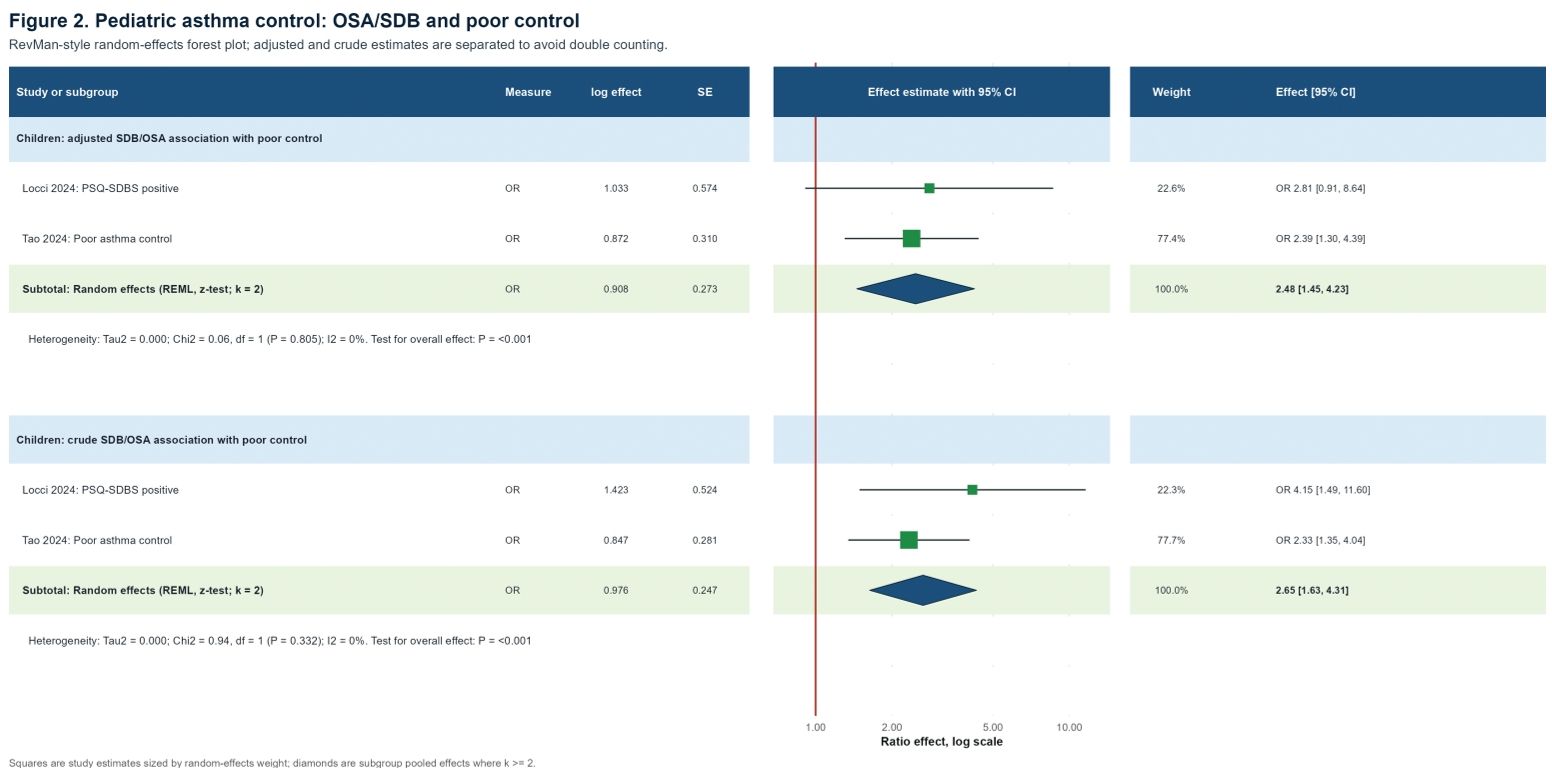
Figure 4.
Forest plot of paediatric asthma control: OSA/SDB and poor asthma control. RevMan-style random-effects forest plot; adjusted and crude estimates are presented in separate subgroups to avoid double-counting. Squares represent study estimates sized by random-effects weight; diamonds represent subgroup pooled effects where k ≥ 2. Ratio effect on log scale; no-effect line = 1.0. OSA, obstructive sleep apnoea; REML, restricted maximum likelihood; SDB, sleep-disordered breathing.
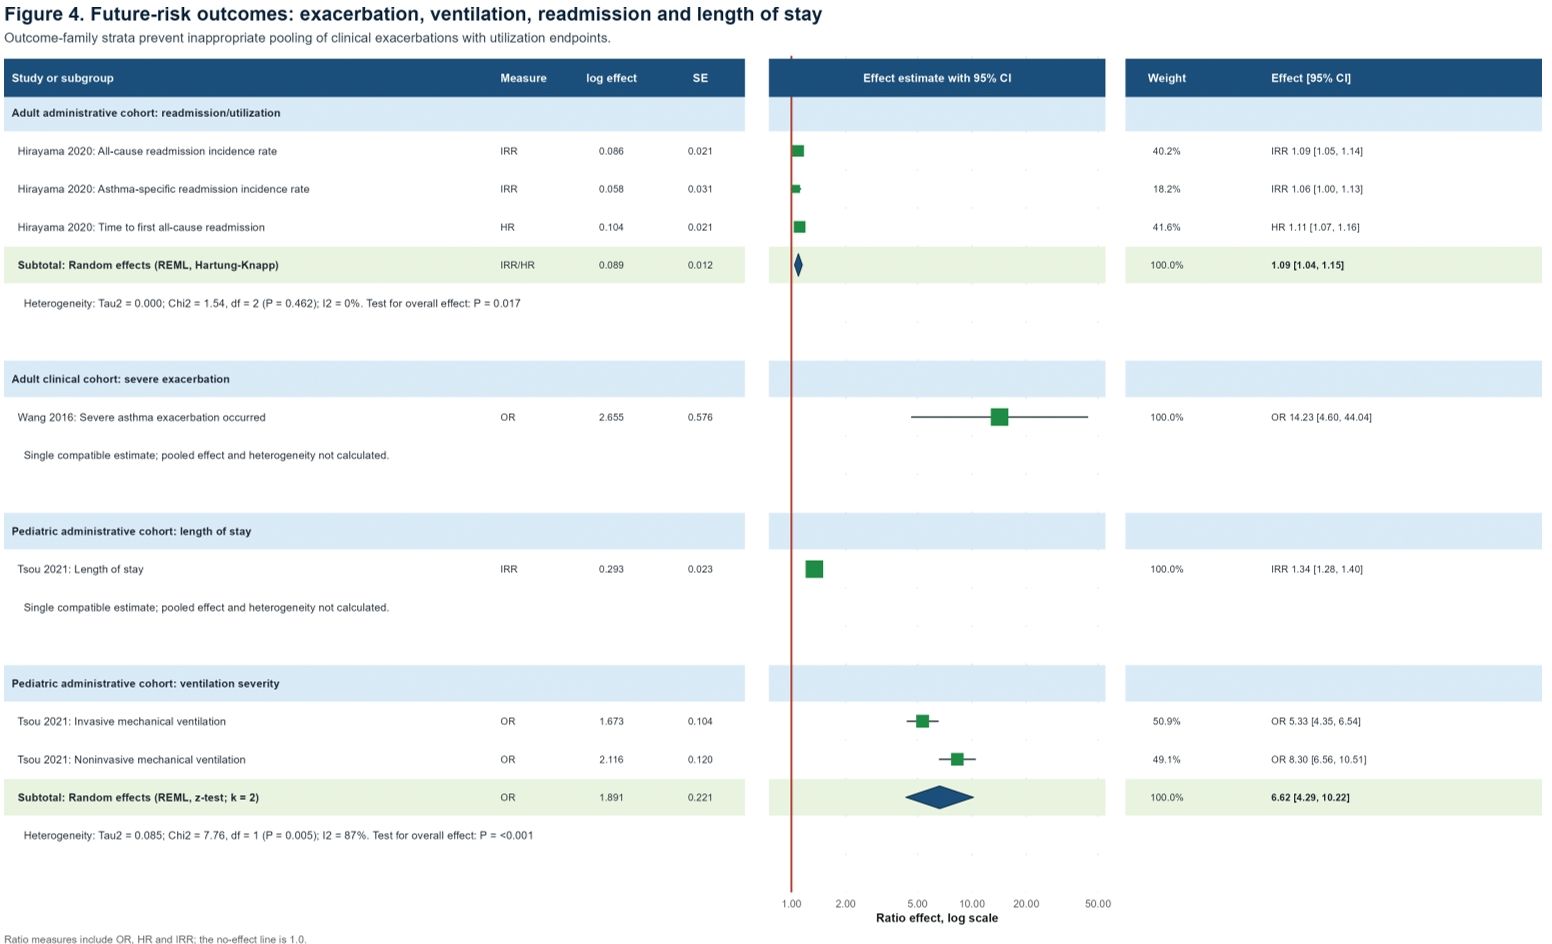
Figure 5.
Forest plot of future-risk outcomes associated with OSA/SDB in asthma: exacerbation, mechanical ventilation, hospital readmission and length of stay. Outcome-family strata prevent inappropriate pooling of clinical exacerbations with utilisation endpoints. Ratio measures include OR, HR and IRR; the no-effect line is 1.0. HR: hazard ratio; IRR: incidence rate ratio; OR, odds ratio; OSA, obstructive sleep apnoea; REML, restricted maximum likelihood; SDB, sleep-disordered breathing.
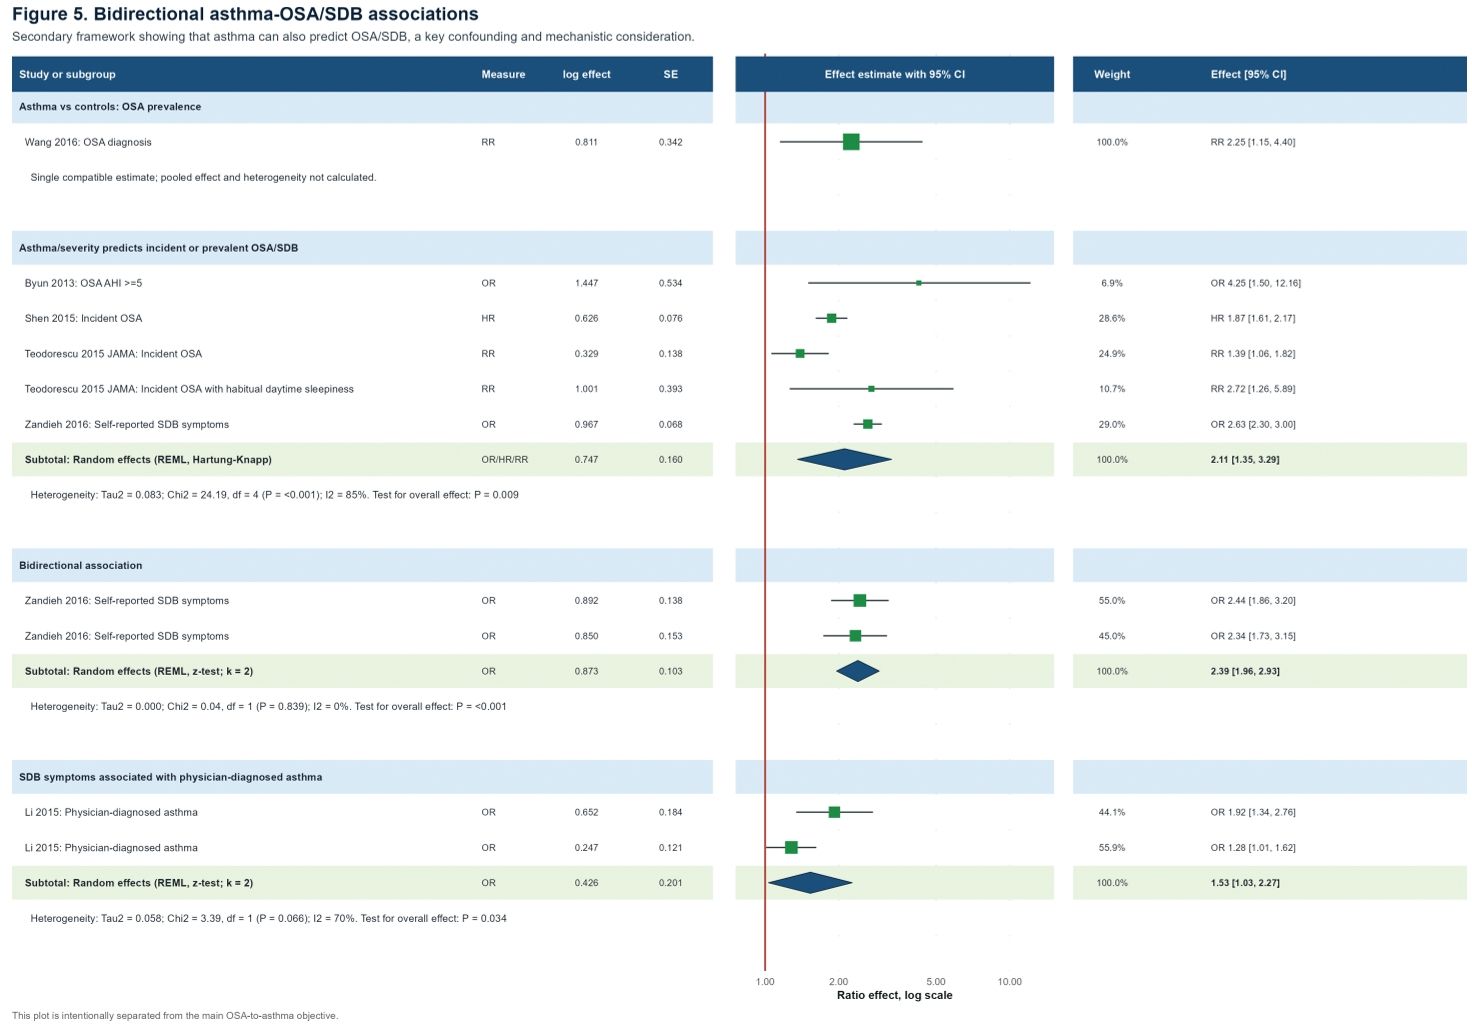
Figure 6.
Forest plot of bidirectional asthma-OSA/SDB associations. This secondary framework demonstrates that asthma also independently predicts incident and prevalent OSA/SDB, a key confounding and mechanistic consideration. Pooling is performed within directional strata using random-effects REML. HR: hazard ratio; OR, odds ratio; OSA, obstructive sleep apnoea; REML, restricted maximum likelihood; SDB, sleep-disordered breathing.
Table 3.
Summary of meta-analysis results by objective and subgroup
Objective | Subgroup/stratum | k studies | k effects | Statistical model | Pooled effect [95% CI] | P-value | I2 (%) | T2 | Q P-value | GRADE |
|---|---|---|---|---|---|---|---|---|---|---|
OBJ1: Paediatric asthma control | Children: adjusted SDB/ OSA and poor control | 2 | 2 | RE-REML, z-test | OR 2.48 [1.45, 4.23] | <0.001 | 0% | 0.000 | 0.805 | L |
OBJ1: Paediatric asthma control | Children: crude SDB/ OSA and poor control | 2 | 2 | RE-REML, z-test | OR 2.65 [1.63, 4.31] | <0.001 | 0% | 0.000 | 0.332 | L |
OBJ2: Adult control/symptom burden | OSA-risk questionnaire and daily symptoms | 2 | 5 | RE-REML, HK | OR 1.74 [1.49, 2.02] | <0.001 | 0% | 0.000 | 0.829 | L |
OBJ2: Adult control/symptom burden | Diagnosed OSA and persistent symptoms | 2 | 3 | RE-REML, HK | OR 2.06 [0.63, 6.77] | 0.121 | 27% | 0.050 | 0.198 | VL |
OBJ2: Adult control/symptom burden | Diagnosed OSA and severe asthma | 1 | 2 | RE-REML, z-test | OR 3.49 [1.49, 8.15] | 0.004 | 32% | 0.139 | 0.227 | L |
OBJ2: Adult control/symptom burden | Symptom-defined SA and poor ACT control | 1 | 1 | Single estimate; NP | OR 1.77 [1.01, 3.07] | 0.047 | - | - | - | VL |
OBJ3: Exacerbation/future risk | Adult admin cohort: readmission/utilisation | 1 | 3 | RE-REML, HK | IRR/HR 1.09 [1.04, 1.15] | 0.017 | 0% | 0.000 | 0.462 | L |
OBJ3: Exacerbation/future risk | Adult clinical: severe exacerbation | 1 | 1 | Single estimate; NP | OR 14.23 [4.60, 44.04] | <0.001 | - | - | - | VL |
OBJ3: Exacerbation/future risk | Paediatric admin cohort: length of stay | 1 | 1 | Single estimate; NP | IRR 1.34 [1.28, 1.40] | <0.001 | - | - | - | L |
OBJ3: Exacerbation/future risk | Paediatric admin cohort: ventilation severity | 1 | 2 | RE-REML, z-test | OR 6.62 [4.29, 10.22] | <0.001 | 87% | 0.085 | 0.005 | VL |
OBJ5: Bidirectional pathway | Asthma predicts incident/prevalent OSA/SDB | 4 | 5 | RE-REML, HK | OR/HR/RR 2.11 [1.35, 3.29] | 0.009 | 85% | 0.083 | <0.001 | VL |
OBJ5: Bidirectional pathway | Bidirectional association (Zandieh 2016) | 1 | 2 | RE-REML, z-test | OR 2.39 [1.96, 2.93] | <0.001 | 0% | 0.000 | 0.839 | L |
OBJ5: Bidirectional pathway | SDB predicts physician-diagnosed asthma | 1 | 2 | RE-REML, z-test | OR 1.53 [1.03, 2.27] | 0.034 | 70% | 0.058 | 0.066 | VL |
OBJ6: OSA/SDB prevalence | Objective sleep test (seven studies) | 7 | 7 | RE-logit, HK | 62.3% [34.7%, 83.7%] | 0.320 | 95% | 1.168 | <0.001 | VL |
OBJ6: OSA/SDB prevalence | Administrative code (two studies) | 2 | 2 | RE-logit, z-test | 2.8% [0.2%, 28.7%] | 0.008 | 100% | 3.617 | <0.001 | VL |
OBJ6: OSA/SDB prevalence | Questionnaire/symptom-defined SDB (three studies) | 3 | 3 | RE-logit, HK | 30.4% [13.4%, 55.2%] | 0.076 | 89% | 0.153 | <0.001 | VL |
[i] ACT: Asthma Control Test; CI, confidence interval; HK: Hartung-Knapp; HR: hazard ratio; IRR: incidence rate ratio; k: number of effect estimates; NP: not pooled (single compatible estimate); OR: odds ratio; OSA, obstructive sleep apnoea; SDB, sleep-disordered breathing; REML: restricted maximum likelihood; RR: relative risk.
[ii] GRADE certainty: L = low; VL = very low.
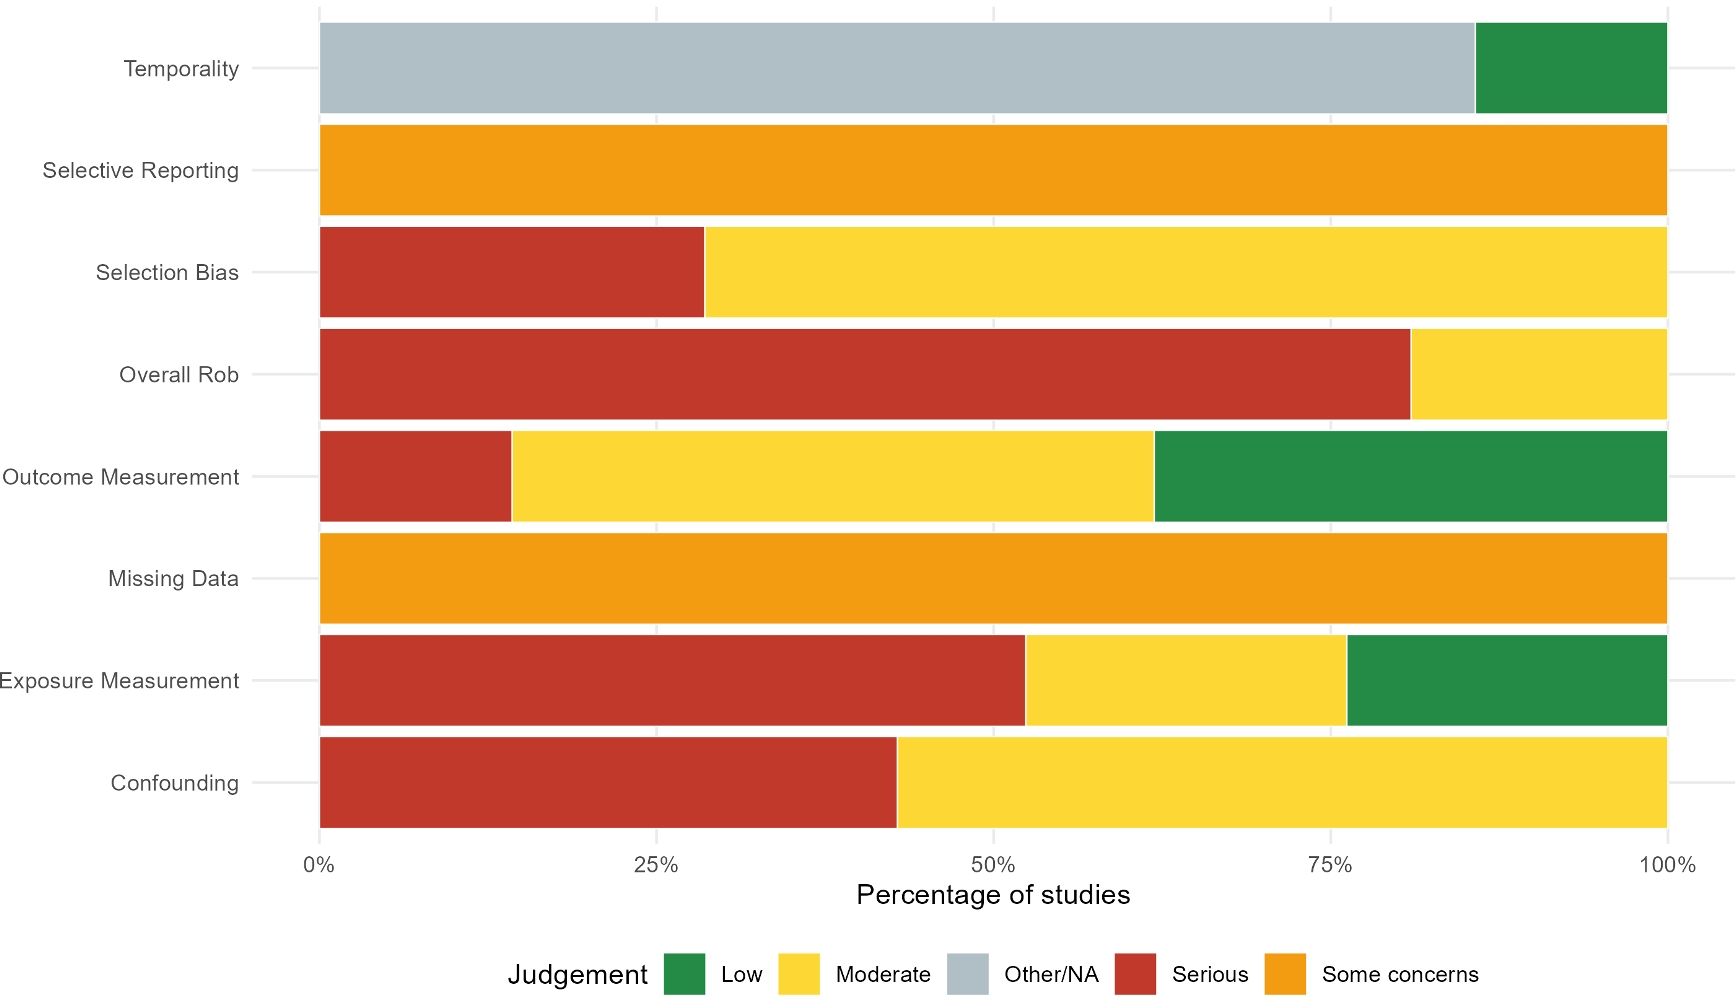
Supplementary Figure S1.
Risk-of-bias profile across observational studies (ROBINS-I adapted domains). Stacked bar chart showing the distribution of judgements (low, moderate, some concerns, serious, other/NA) for each domain across all 21 included studies. N/A.
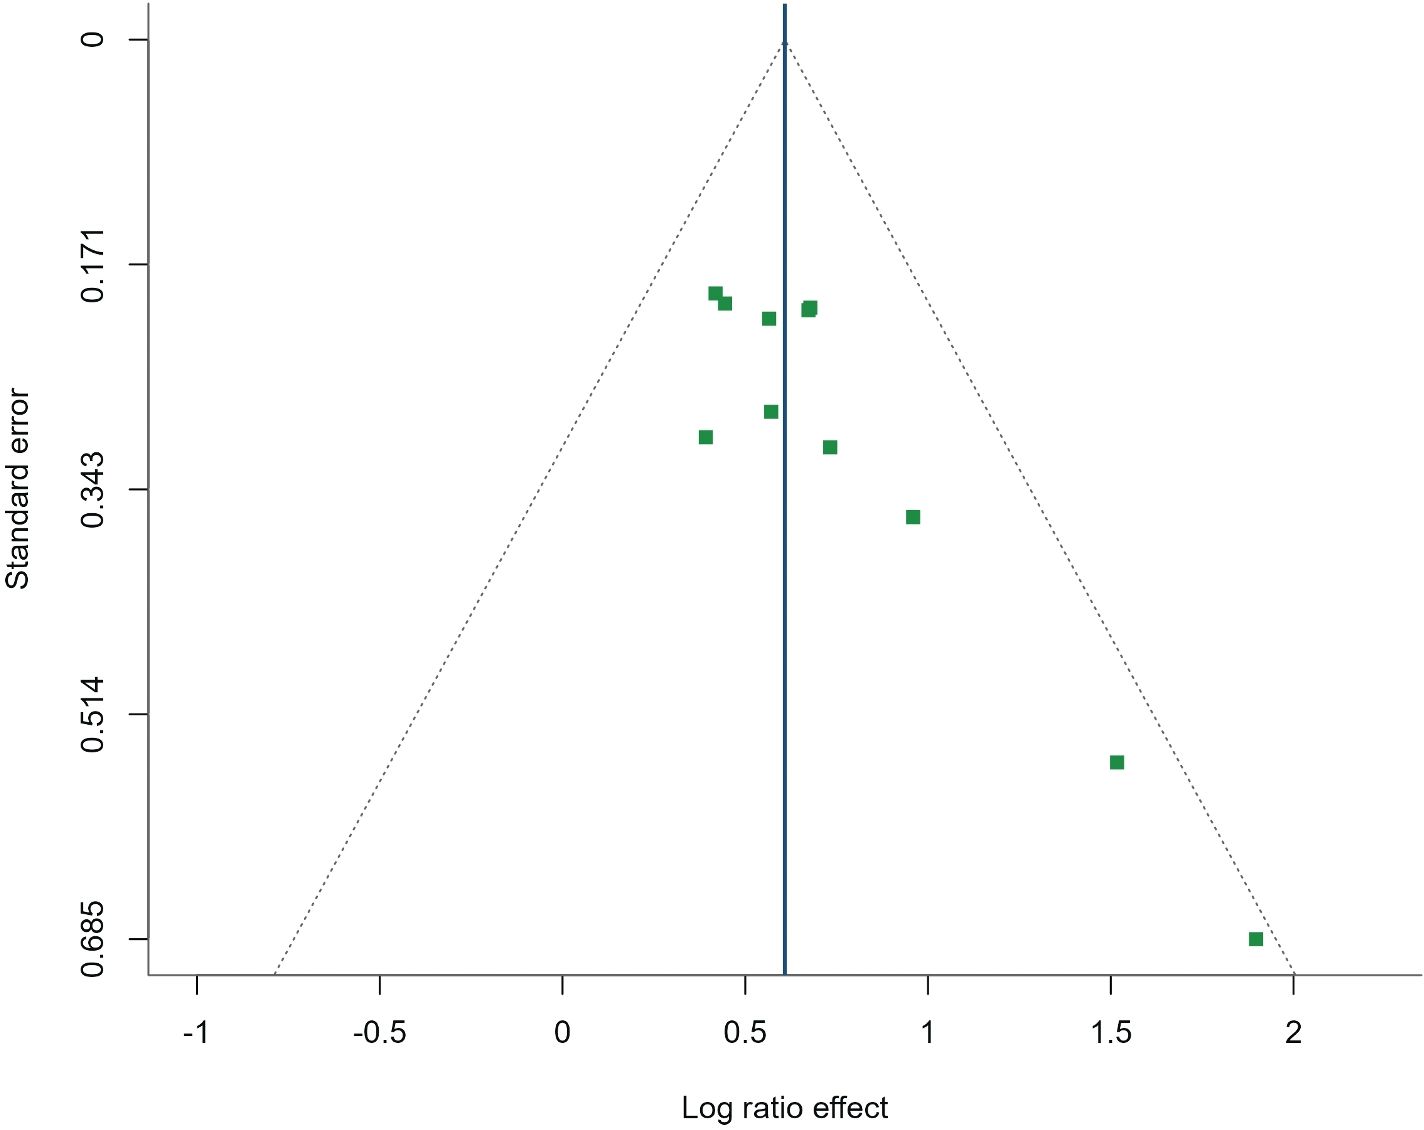
Supplementary Figure S2.
Funnel plot for adult asthma control: OSA/SDB association. The vertical blue line represents the pooled log ratio effect (log-scale = 0.552). Dotted lines indicate the pseudo-95% confidence region. Asymmetry at larger standard errors suggests possible small-study publication bias. OSA, obstructive sleep apnea; SDB, sleep-disordered breathing.
Supplementary Figure S3.
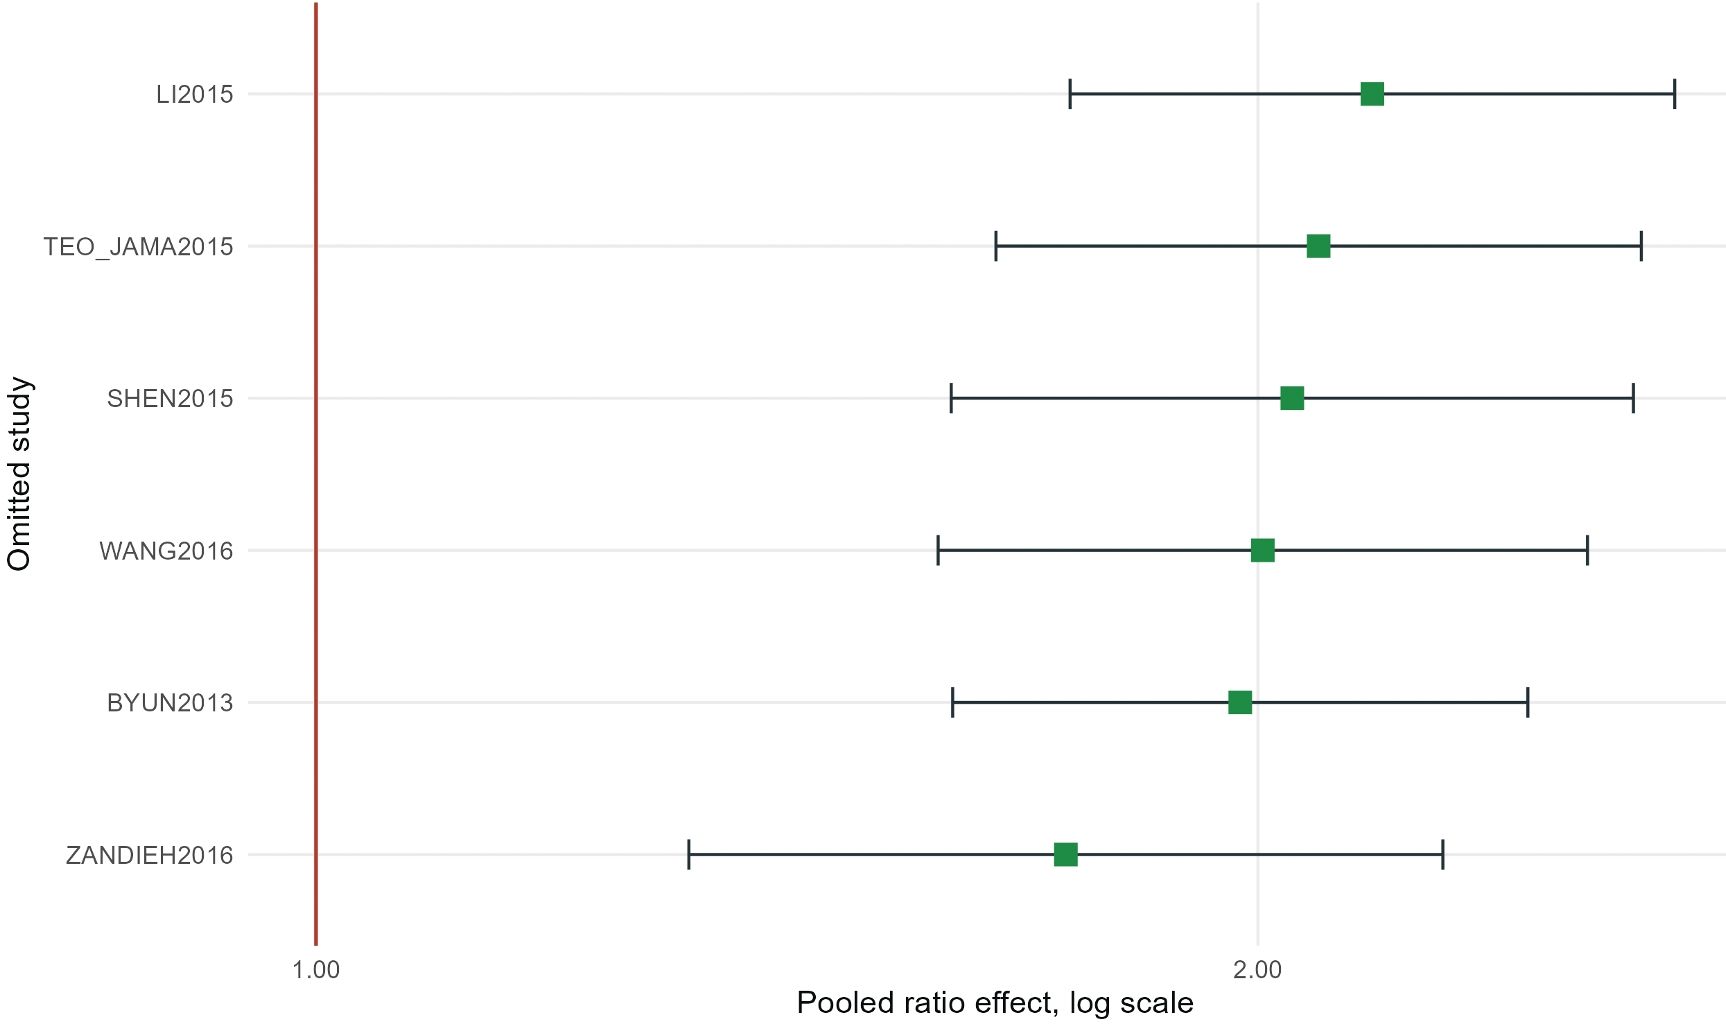
Leave-one-study-out sensitivity analysis for the bidirectional asthma-OSA/SDB association (Objective 5). The x-axis shows the pooled ratio effect on the log scale after omission of each study in turn. All pooled estimates remain substantially above the null value (1.0), confirming robustness of the main finding. OSA, obstructive sleep apnea; SDB, sleep-disordered breathing.
Supplementary Figure S4.
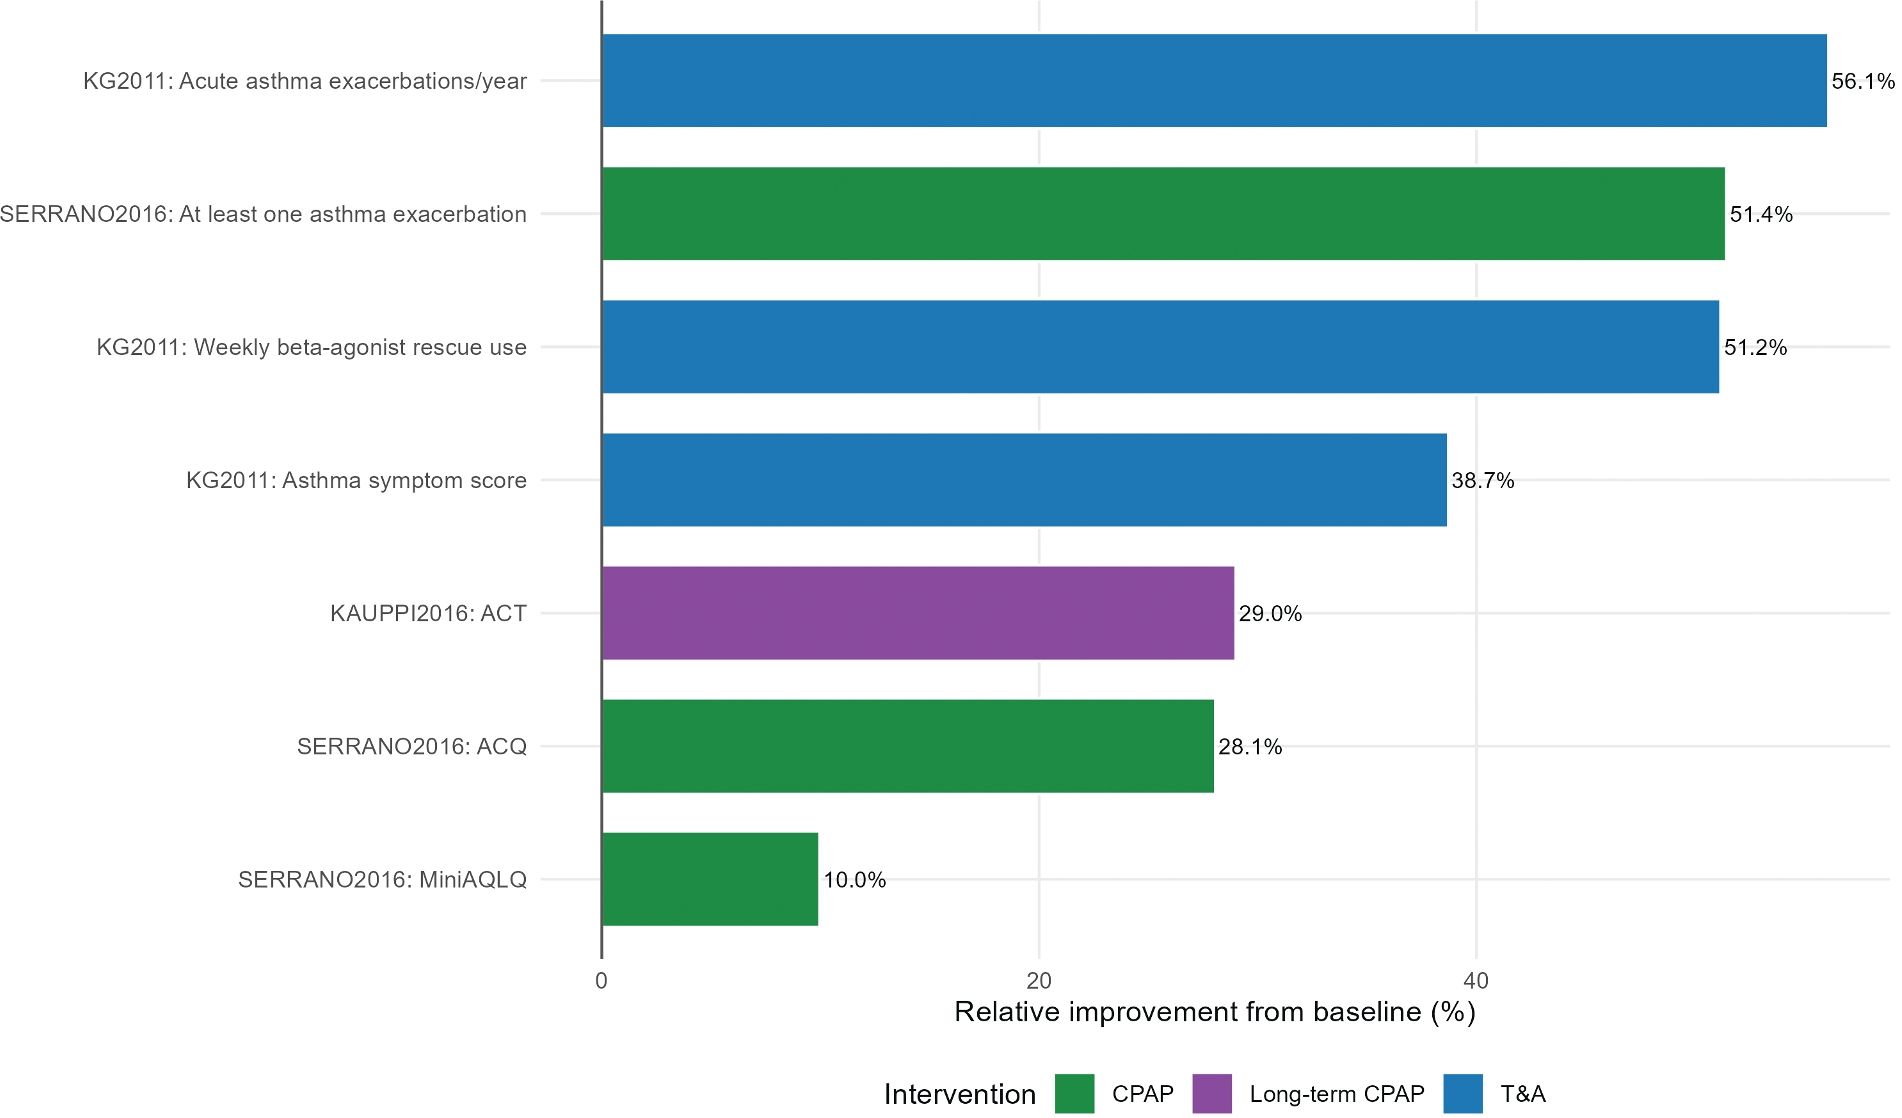
Treatment response after OSA-directed therapy: relative improvement from baseline across asthma outcomes following CPAP (green) and adenotonsillectomy/T&A (blue). Direction is harmonised so that positive values indicate improvement. Pre-post evidence is not treated as causal owing to uncontrolled before-after designs. CPAP, OSA.
Supplementary Figure S5.
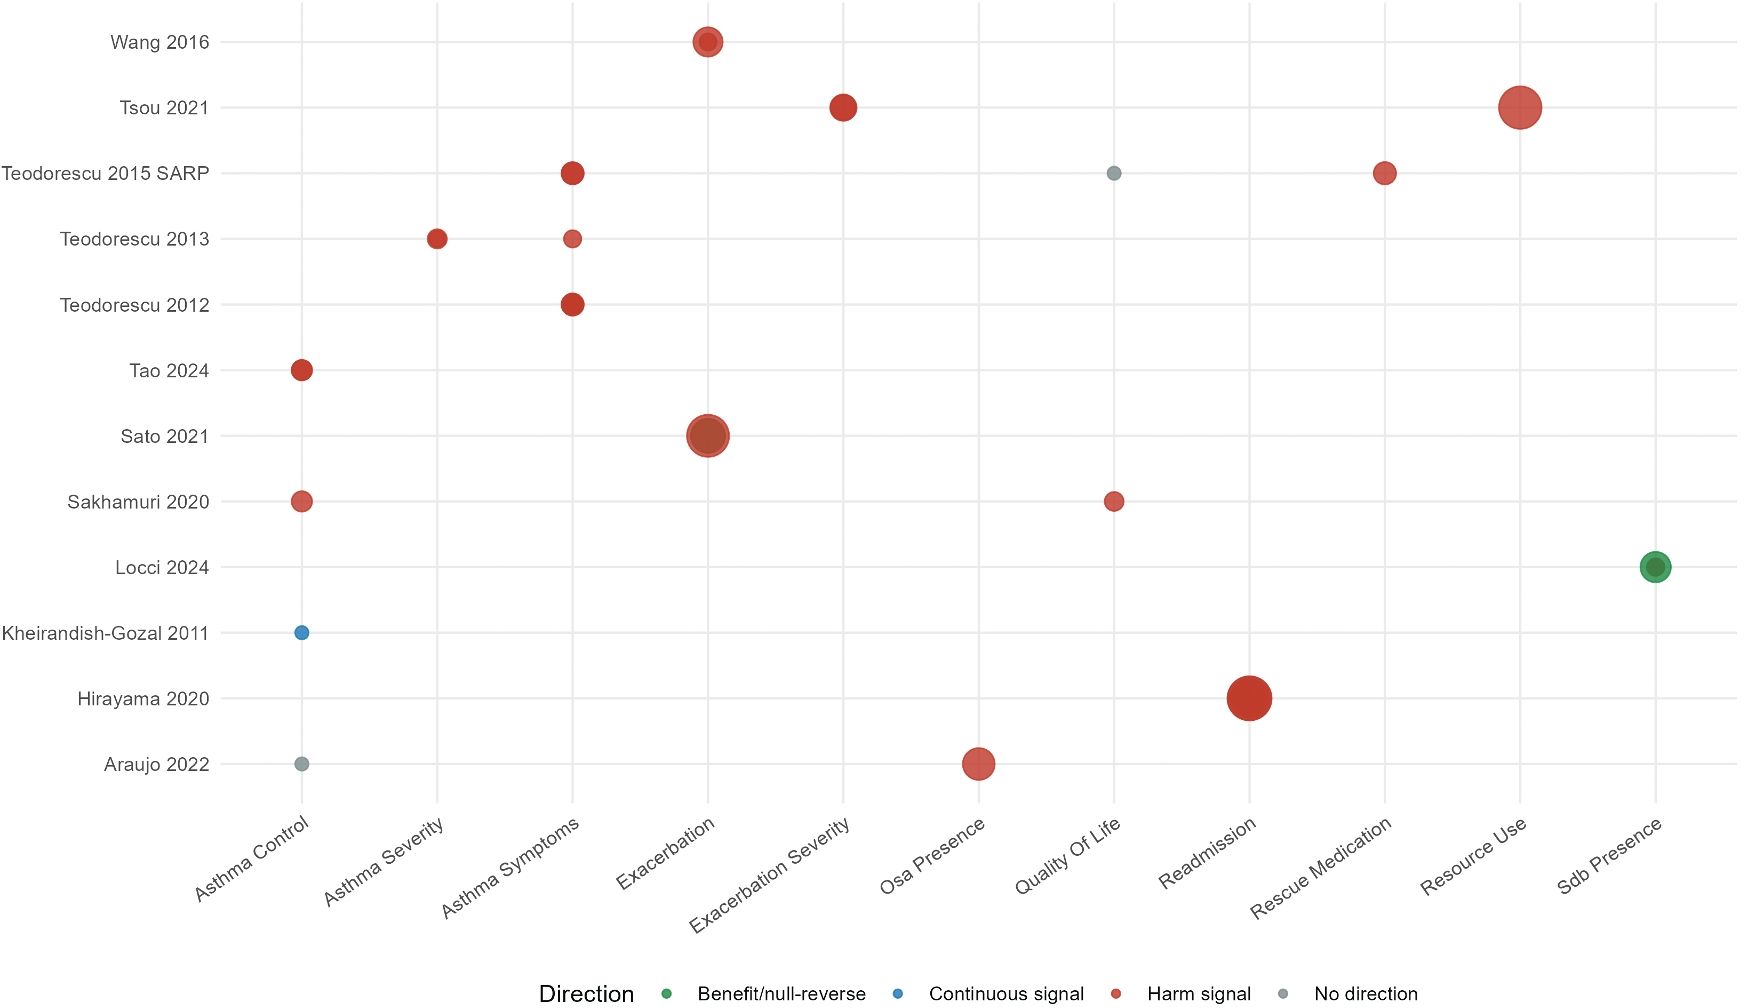
Evidence map showing which objectives each included study addresses. Bubble size reflects approximate precision where standard errors were available. Point colour indicates direction of signal (harm, benefit/null-reverse, continuous, or no direction).
Table S1.
Risk-of-bias assessment by domain for all 21 included primary studies (ROBINS-I-adapted framework; underlies Supplementary Figure S4). Risk of bias (RoB) was assessed for each included study using domains adapted from the ROBINS-I framework: selection bias, exposure measurement, outcome measurement, confounding, temporality, missing data and selective reporting. Each domain was rated low, moderate, some concerns or serious risk of bias. An overall risk-of-bias judgement was assigned per study by two independent reviewers, with disagreements resolved through consensus discussion. Corresponds to Supplementary Figure S4 and the Risk of bias assessment / RoB and GRADE certainty sections of the main text.
Study (ref.) | Selection bias | Exposure measurement | Outcome measurement | Confounding | Temporality | Missing data | Selective reporting | Overall RoB | Rationale |
|---|---|---|---|---|---|---|---|---|---|
Kheirandish-Gozal 2011 (19) | Serious | Low | Moderate | Serious | Some concerns (T&A follow-up) | Some concerns | Some concerns | Serious | Objective PSG and 1-year outcomes, but selected poorly controlled children and non-ran-domised T&A. |
Araujo 2022 (20) | Moderate | Moderate | Low | Serious | Cross-sectional | Some concerns | Some concerns | Serious | Objective HSAT and ACT, but small severe-asthma-on-bioiogics cohort with cross-sectional analysis. |
Byun 2013 (21) | Serious | Moderate | Moderate | Serious | Cross-sectional | Some concerns | Some concerns | Serious | Symptomatic clinic sample; only a subset underwent PSG; reverse-di-rection association. |
Teodorescu 2012 (24) | Moderate | Serious | Moderate | Moderate | Cross-sectional | Some concerns | Some concerns | Serious | Large asthma clinic sample with adjusted models; OSA risk/diagnosis not by systematic PSG. |
Teodorescu 2013 (25) | Moderate | Serious | Moderate | Moderate | Cross-sectional | Some concerns | Some concerns | Serious | Age-stratified adjusted estimates; OSA ascertained from history/ records, not systematic testing. |
Teodorescu 2015 SARP (26) | Moderate | Serious | Low | Moderate | Cross-sectional | Some concerns | Some concerns | Serious | Well-characterised SARP outcomes and sputum data, but OSA risk by questionnaire only. |
Teodorescu 2015 JAMA (12) | Moderate | Low | Moderate | Moderate | Prospective | Some concerns | Some concerns | Moderate | Repeated laboratory PSG and prospective design; asthma ascertained by self-report. |
Wang 2016 (34) | Moderate | Low | Moderate | Serious | Partly retrospective outcomes | Some concerns | Some concerns | Serious | Full PSG for all subjects; small OSA subgroup and covariate model not fully reported. |
Shen 2015 (13) | Moderate | Serious | Moderate | Moderate | Cohort follow-up | Some concerns | Some concerns | Moderate- to-serious | Large incident-OSA cohort; administrative claims lack BMI/smoking/se-verity detail. |
Hirayama 2020 (30) | Moderate | Serious | Low | Moderate | Cohort follow-up | Some concerns | Some concerns | Moderate-to- serious | Large longitudinal readmission data with extensive adjustment; administrative coding may misclassify exposure/outcome. |
Kauppi 2016 (31) | Serious | Moderate | Serious | Serious | Retrospective before-after | Some concerns | Some concerns | Serious | Long CPAP duration, but recalled pre-CPAPACT/ symptoms and no control group. |
Serrano-Pariente 2016 (23) | Moderate | Low | Low | Serious | Before-after | Some concerns | Some concerns | Serious | Validated ACQ/ AQLQ and objective OSA diagnosis, but uncontrolled CPAP before-after design. |
Sato 2021 (27) | Moderate | Moderate | Moderate | Serious | Prospective | Some concerns | Some concerns | Serious | Prospective exacerbation follow-up; small sample and an unexpected inverse pAHI association. |
Sakhamuri 2020 (29) | Serious | Serious | Low | Moderate | Cross-sectional | Some concerns | Some concerns | Serious | Validated ACT/ AQLQ, but sleep apnoea defined by symptoms only; specialty-clinic sample. |
Zandieh 2016 (35) | Moderate | Serious | Moderate | Moderate | Cross-sectional | Some concerns | Some concerns | Serious | Large urban adolescent cohort; self-reported SDB and probable asthma. |
Li 2015 (32) | Moderate | Serious | Moderate | Moderate | Cross-sectional | Some concerns | Some concerns | Serious | Very large sample with adjusted models; SDB and asthma both by parent questionnaire. |
Locci 2024 (22) | Moderate | Serious | Low | Moderate | Cross-sectional | Some concerns | Some concerns | Serious | Validated C-ACT/ PedsQL outcomes, but SDB ascertained by questionnaire and small sample. |
Tao 2024 (36) | Moderate | Serious | Low | Moderate | Cross-sectional | Some concerns | Some concerns | Serious | Large paediatric sample with adjusted model; SDB by PSQ only, not objective testing. |
Tsou 2021 (33) | Moderate | Serious | Low | Moderate | Index hospitalisation | Some concerns | Some concerns | Moderate-to- serious | Very large adjusted inpatient sample; administrative OSA coding likely under-ascertains exposure. |
Yigla 2003 (37) | Serious | Low | Serious | Serious | Cross-sectional / descriptive | Some concerns | Some concerns | Serious | Objective PSG, but a highly selected steroid-dependent sample with no asthma-control comparator. |
Madama 2016 (28) | Serious | Moderate | Serious | Serious | Retrospective | Some concerns | Some concerns | Serious | Referred suspect-ed-OSA sample; outcome reported only as qualitative improvement. |
[i] RoB, risk of bias; ROBINS-I, Risk Of Bias In Non-randomised Studies of Interventions (adapted for observational exposure-outcome studies). ‘Some concerns’ ratings for missing data and selective reporting reflect incomplete reporting of pre-specified outcomes or attrition detail typical of the source publications rather than a specific identified flaw. Reference numbers correspond to the main manuscript reference list.
Table S2.
OSA/SDB prevalence extraction, stratified by ascertainment method (underlies Figure 2). Twelve studies reported OSA/SDB prevalence in asthma populations. Studies are grouped into three ascertainment strata (objective sleep test, administrative code, and questionnaire/symptom-defined SDB) as pooling across strata was not performed, given the marked heterogeneity in prevalence estimates by ascertainment method. Pooled estimates use a random-effects logit-scale (metaprop) model with Hartung-Knapp correction where k ≥ 3, back-transformed to the prevalence scale; corresponds to Figure 2, Table 1 and Table 3 (Objective 6) in the main text.
Study (ref.) | Age group | Ascertainment stratum | Events (n) | Total (N) | Prevalence | OSA/SDB measure | Threshold / cut-off |
|---|---|---|---|---|---|---|---|
Kheirandish-Gozal 2011 (19) | Paediatric | Objective sleep test | 58 | 92 | 63.0% | Overnight polysomnography (PSG) | AHI ≥ 5/hr TST |
Araujo 2022 (20) | Adult | Objective sleep test | 30 | 56 | 53.6% | HSAT (ApneaLink Air) | RDI ≥ 5/hr |
Byun 2013 (21) | Adult | Objective sleep test | 111 | 167 | 66.5% | ApneaLink + PSG subset | AHI ≥ 5 |
Sato 2021 (27) | Adult | Objective sleep test | 50 | 62 | 80.6% | Watch-PAT (peripheral arterial tonometry) | pAHI ≥ 5 |
Madama 2016 (28) | Adult | Objective sleep test | 27 | 47 | 57.4% | PSG (68%) or cardiorespiratory polygraphy (32%) | Not extracted |
Wang 2016 (34) | Adult | Objective sleep test | 28 | 146 | 19.2% | Full-night PSG | Threshold not extracted |
Yigla 2003 (37) | Adult | Objective sleep test | 21 | 22 | 95.5% | Full-night PSG | RDI ≥ 15 + symptoms |
Pooled (Objective sleep test; k=7) | 325 | 592 | 62.3% [34.7%, 83.7%] | I2 = 95% | τ2 = 1.168 | ||
Hirayama 2020 (30) | Adult | Administrative code | 6549 | 65,731 | 10.0% | Administrative ICD-9-CM diagnosis | Not applicable |
Tsou 2021 (33) | Paediatric | Administrative code | 4209 | 564,468 | 0.7% | Administrative ICD hospitalisation code | Not applicable |
Pooled (Administrative code; k=2) | 10,758 | 630,199 | 2.8% [0.2%, 28.7%] | I2 = 100% | τ2 = 3.617 | ||
Locci 2024 (22) | Paediatric | Questionnaire / symp-tom-defined SDB | 29 | 78 | 37.2% | Pediatric Sleep Questionnaire (PSQ-SDBS) | PSQ-SDBS ≥ 0.33 |
Tao 2024 (36) | Paediatric | Questionnaire / symp-tom-defined SDB | 86 | 397 | 21.7% | Pediatric Sleep Questionnaire (PSQ-SRBD) | PSQ-SRBD ≥ 0.33 |
Sakhamuri 2020 (29) | Adult | Questionnaire / symp-tom-defined SDB | 150 | 428 | 35.0% | Symptom features (≥2 of: snoring, witnessed apnoeas, daytime sleepiness) | ≥ 2 features |
Pooled (Questionnaire / symptom-defined SDB; k=3) | 265 | 903 | 30.4% [13.4%, 55.2%] | I2 = 89% | τ2 = 0.153 |
[i] AHI, apnoea-hypopnoea index; HSAT, home sleep apnoea test; ICD, International Classification of Diseases; NPSG, nocturnal polysomnography; OSA, obstructive sleep apnoea; PSG, polysomnography; PSQ-SDBS/PSQ-SRBD, Pediatric Sleep Questionnaire sleep-disordered-breathing / sleep-related-breathing-disorder scale; RDI, respiratory disturbance index; SDB, sleep-disordered breathing; TST, total sleep time; pAHI, pulse-oximetry-derived (peripheral) apnoea-hypopnoea index (Watch-PAT). I2, heterogeneity statistic; τ2, between-study variance. Reference numbers correspond to the main manuscript reference list.