
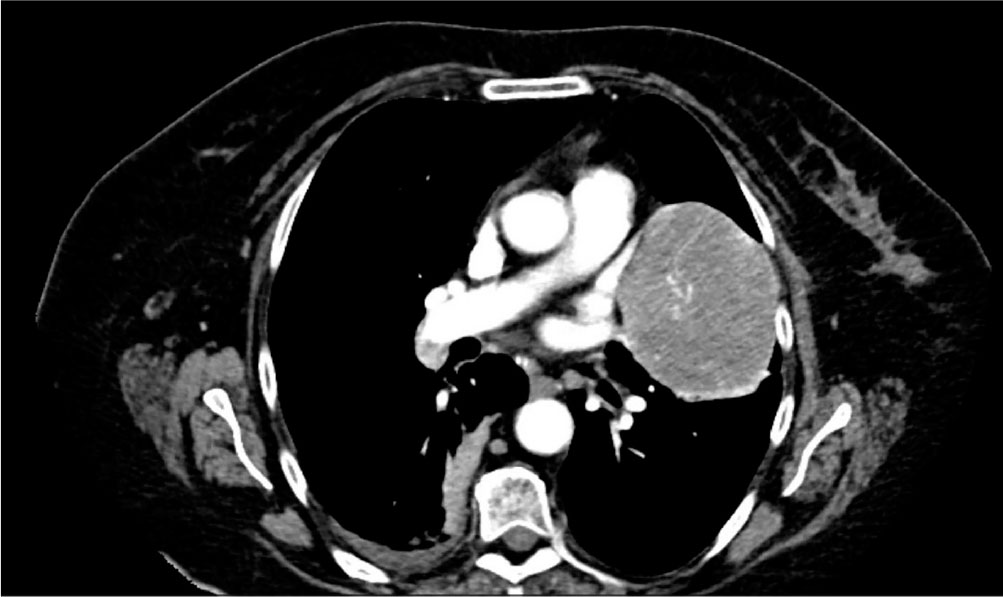
Figure 1.
Contrast-enhanced thoracic CT, transverse section, demonstrating the left upper lobe (lingular) pulmonary mass with well-defined margins. Minimal right pleural effusion and adjacent parenchymal changes consistent with LID pneumonia are also noted. CT, computed tomography.
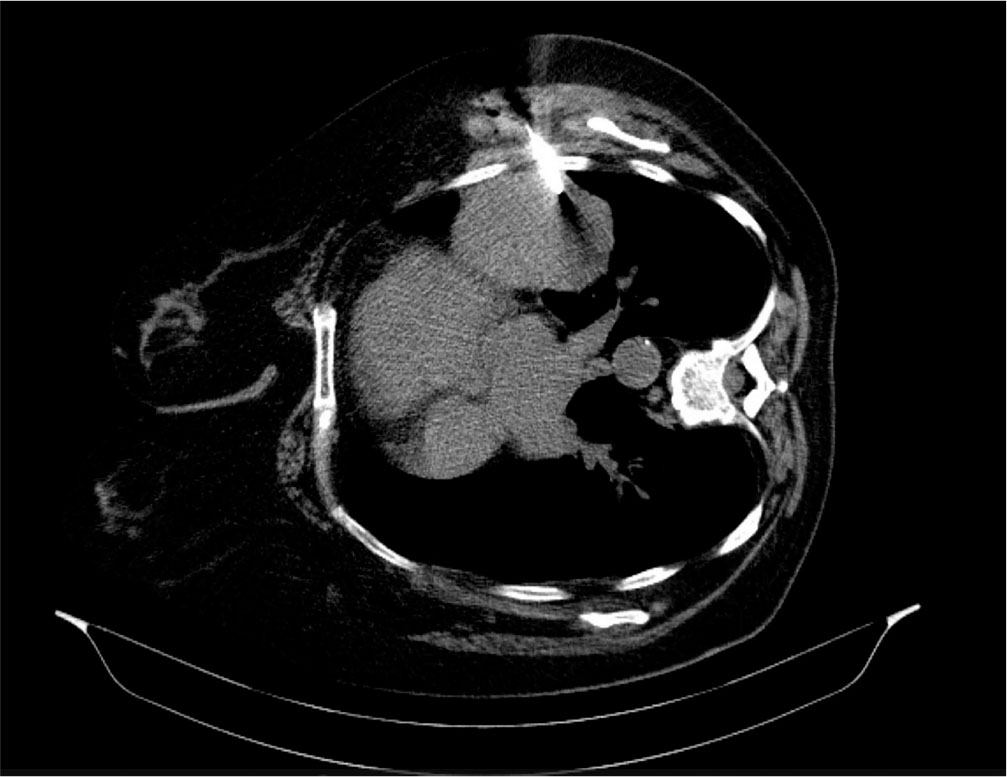
Figure 2.
CT-guided biopsy of the left upper lobe mass in lateral decubitus. Transverse section CT image demonstrating positioning of the biopsy needle within the pulmonary mass in the lingula. CT, computed tomography.
Table 1.
mDemicco score adapted from Demicco et al. (8).
| Variables | Cutoff/Category | Score (Points) |
|---|---|---|
| Age (years> | ≥55 | 1 |
| <55 | 0 | |
| Tumour size (cm) | <5.0 | 0 |
| 5.0 to <10.0 | 1 | |
| 10.0 to <15.0 | 2 | |
| ≥15.0 | 3 | |
| Mitotic count (/10 HPFs) | 0 | 0 |
| 1–3 | 1 | |
| ≥4 | 2 | |
| Tumour necrosis | ≥10% (Present) | 1 |
| <10% (Absent) | 0 |
Table 2.
mDemicco score, risk category adapted from Demicco EG et al. (8).
| Total mDemicco Score | Risk Category | Estimated Metastatic Risk |
|---|---|---|
| 0–3 | Low Risk | Very Low (≈0%–5% at 10 years) |
| 4–5 | Intermediate Risk | Moderate (≈10%–15% at 10 years) |
| 6–7 | High Risk | Substantial (≥50% at 5 years) |