
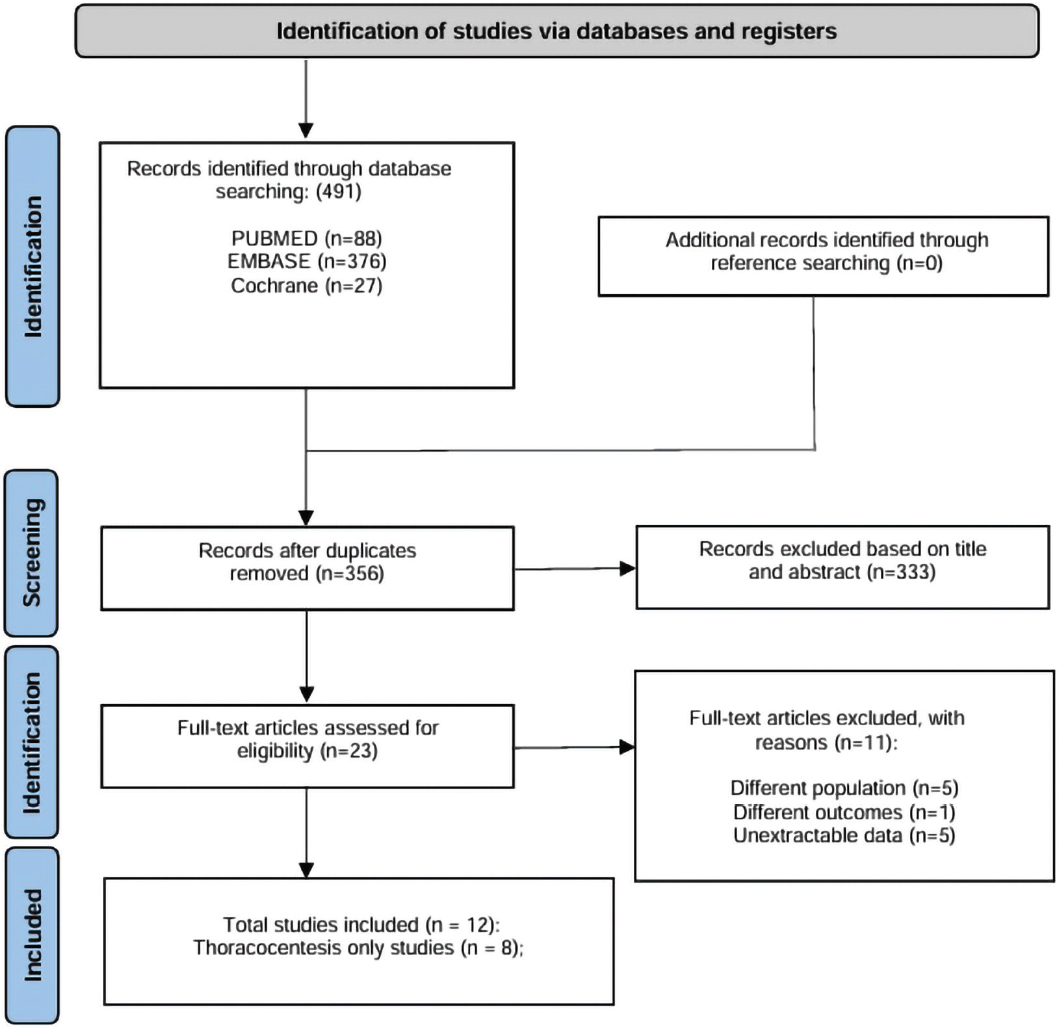
Figure 1.
PRISMA 2020 flow diagram of the study selection process. PRISMA, Preferred Reporting Items for Systematic Reviews and Meta-Analyses.
Table 1.
Baseline characteristics of included studies.
| Study | Design | Mean age | Participants/procedures | Male (%) | USG% | Concurrent aspirin (%) | Renal disease (%) | Procedure type | Drug studied |
|---|---|---|---|---|---|---|---|---|---|
| Mahmood et al. (15) | Prospective | 70.2 ± 13.3 | 25 | 21 (84) | 100 | 22 (88) | 3 (12) | TC + SBCT | Clopidogrel |
| Perl et al. (5) | Retrospective | 77.5 ± 11 | 88 | 53 (60) | 25 | 41 (46) | 26 (29.5) | TC | Clopidogrel |
| Irugulapati et al. (8)* | Retrospective | N/A | 7 | N/A | N/A | N/A | 5 (71.4) | TC | Clopidogrel |
| Parks et al. (24)* | Retrospective | 65 (41–86) | 14 | 5 (35.6) | N/A | N/A | N/A | TC | Clopidogrel |
| Salguero et al. (23)* | Retrospective | N/A | 22 | N/A | 100 | 20 (91) | N/A | TC | Clopidogrel + Ticagrelor |
| Sisniega et al. (22)* | Retrospective | N/A | 5 | N/A | N/A | 2 (40) | N/A | IPC | Clopidogrel + Prasugrel |
| Abouzgheib et al. (21) | Retrospective | 73.1 | 24 | 8 (44.4) | 100 | 13 (72.2) | N/A | SBCT | Clopidogrel |
| Zalt et al. (20) | Prospective | 75.5 (41–96) | 45 | 9 (30) | 100 | N/A | N/A | TC | Clopidogrel |
| Dammert et al. (19) | Retrospective | 71 ± 10 | 43 | 21 (70) | 100 | 27 (91) | 4 (15) | SBCT | Clopidogrel |
| Puchalski et al. (18) | Prospective | N/A | 18 | N/A | 100 | N/A | N/A | TC | Clopidogrel |
| Patel et al. (17) | Retrospective | N/A | 72 | N/A | 100 | 58 (80) | N/A | TC | Clopidogrel + Ticagrelor |
| Aljundi et al. (16) | Retrospective | N/A | 32 | N/A | N/A | N/A | N/A | TC | Clopidogrel + Ticagrelor + Prasugrel |
Table 2.
The NOS for assessing the quality of studies in meta-analyses.
| Studies | Selection | Comparability | Outcome | Total score | |||||
|---|---|---|---|---|---|---|---|---|---|
| Author, year | Selection of cases | Selection of controls | Ascertainment of exposure | Outcome not present at the start | Comparability of cases and controls | Assessment of outcome | Follow-up duration | Follow-up % | |
| Mahmood et al. (15) | 1 | 1 | 1 | 1 | 0 | 0 | 1 | 1 | 6 |
| Perl et al. (5) | 1 | 1 | 1 | 0 | 0 | 1 | 1 | 1 | 6 |
| Irugulapati et al. (8)* | 1 | 0 | 1 | 0 | 0 | 1 | 1 | 1 | 5 |
| Parks et al. (24)* | 1 | 0 | 1 | 0 | 0 | 1 | 1 | 1 | 5 |
| Salguero et al. (23)* | 1 | 0 | 1 | 0 | 0 | 1 | 1 | 1 | 5 |
| Sisniega et al. (22)* | 1 | 1 | 1 | 1 | 0 | 1 | 1 | 1 | 7 |
| Abouzgheib et al. (21) | 1 | 0 | 1 | 1 | 0 | 1 | 1 | 1 | 6 |
| Zalt et al. (20) | 1 | 0 | 1 | 1 | 0 | 1 | 1 | 1 | 6 |
| Dammert et al. (19) | 1 | 0 | 1 | 1 | 0 | 1 | 1 | 1 | 6 |
| Puchalski 2013 | 1 | 1 | 1 | 0 | 1 | 0 | 1 | 1 | 6 |
| Patel et al. (4) | 1 | 0 | 1 | 0 | 0 | 1 | 1 | 1 | 5 |
| Aljundi et al. (16) | 1 | 1 | 1 | 0 | 2 | 1 | 1 | 1 | 8 |
1 Original studies were analysed in the quality assessment. Total quality scores ≤5 indicate high risk of bias. A study could be awarded a maximum of one star for each item except for ‘Control for important factor or additional factor’. 0 = Criteria not fulfilled (the study did not meet the requirements for this criterion); 1 = Criteria fulfilled (the study meets the requirements for this criterion).
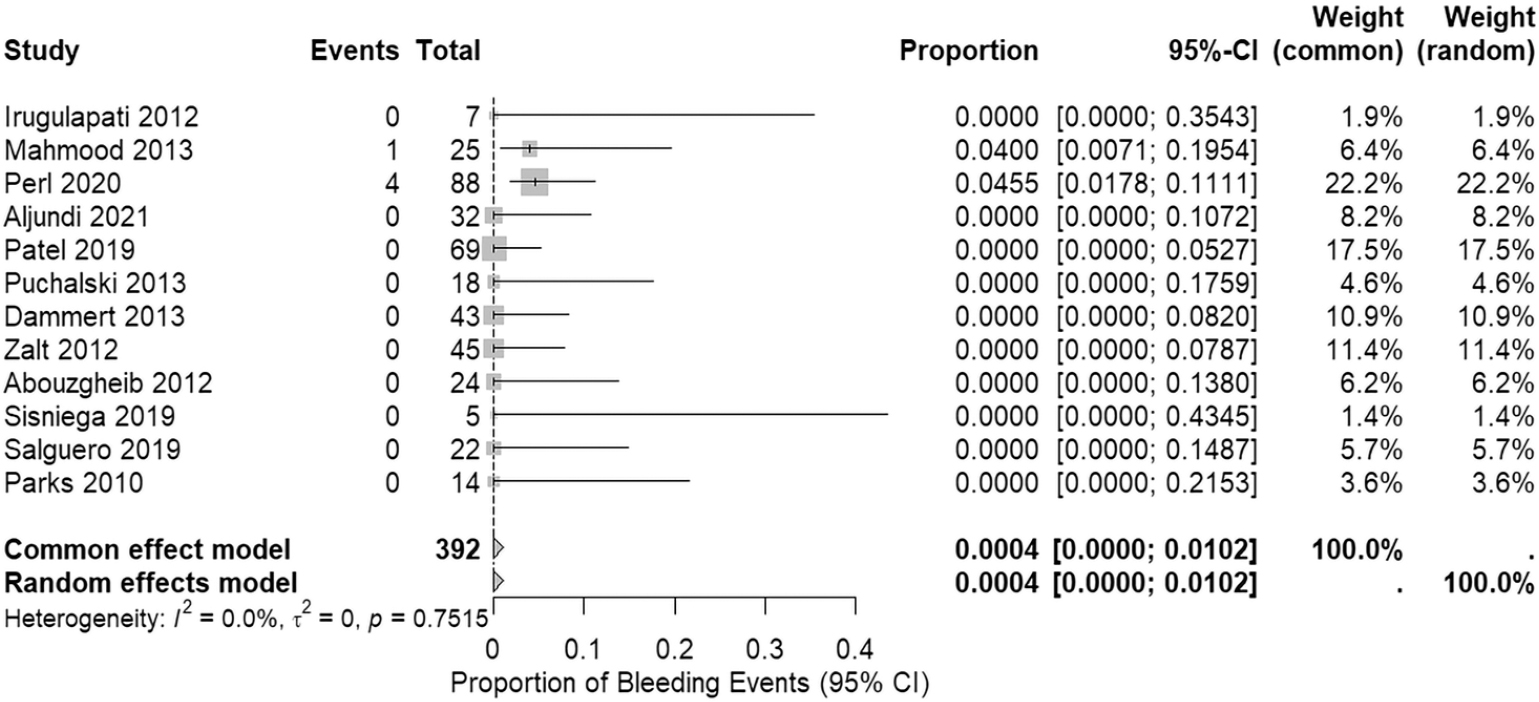
Figure 2.
Forest plot showing the pooled proportion of bleeding events across all included studies. CI, confidence interval.
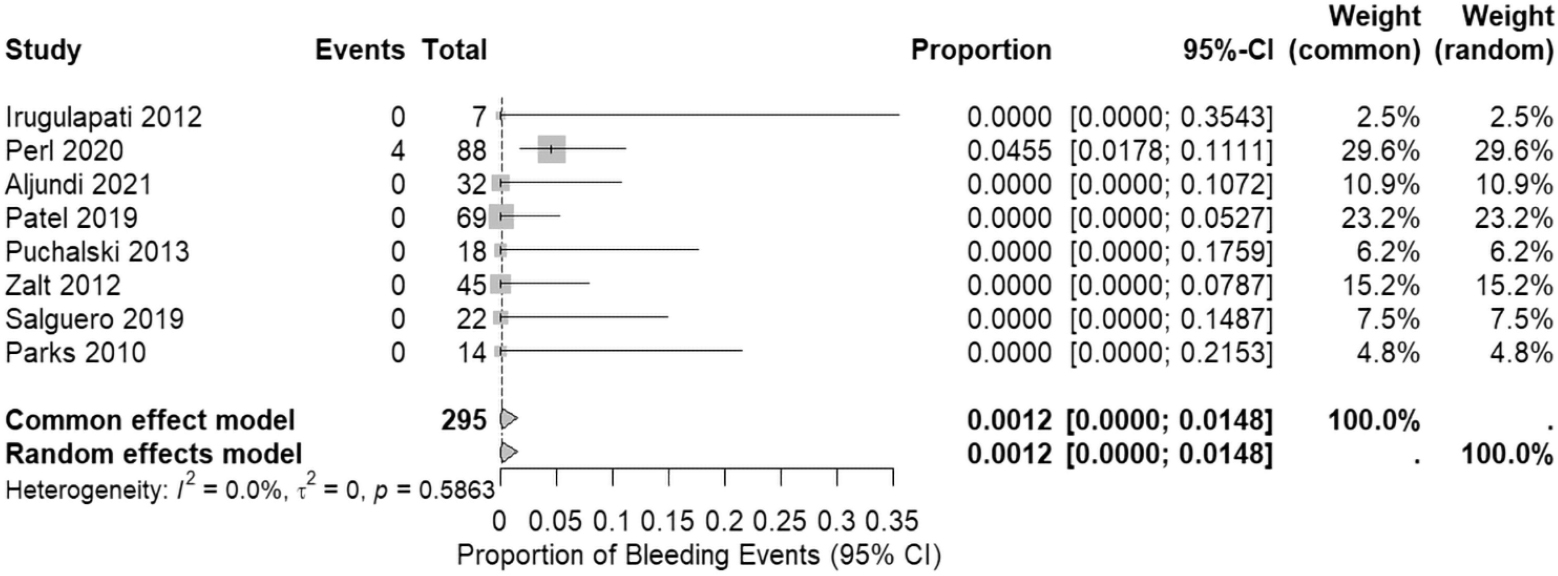
Figure 3.
Forest plot showing the pooled proportion of bleeding events in the thoracentesis-only subgroup. CI, confidence interval.
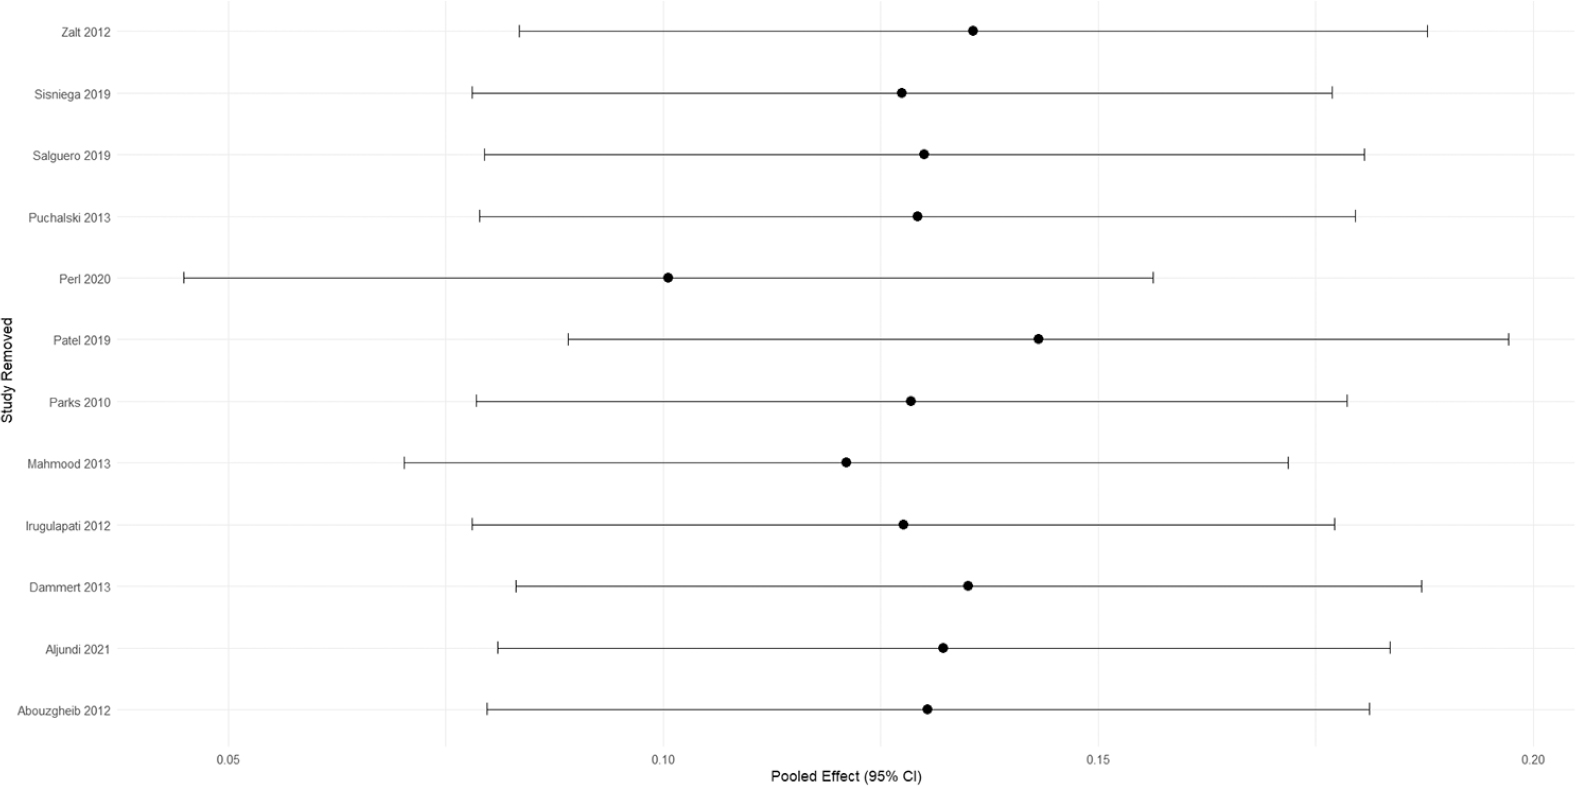
Figure 4.
Leave-one-out sensitivity analysis for the proportion of bleeding events with Freeman-Tukey Double Arcsine transformation applied for zero events. CI, confidence interval.
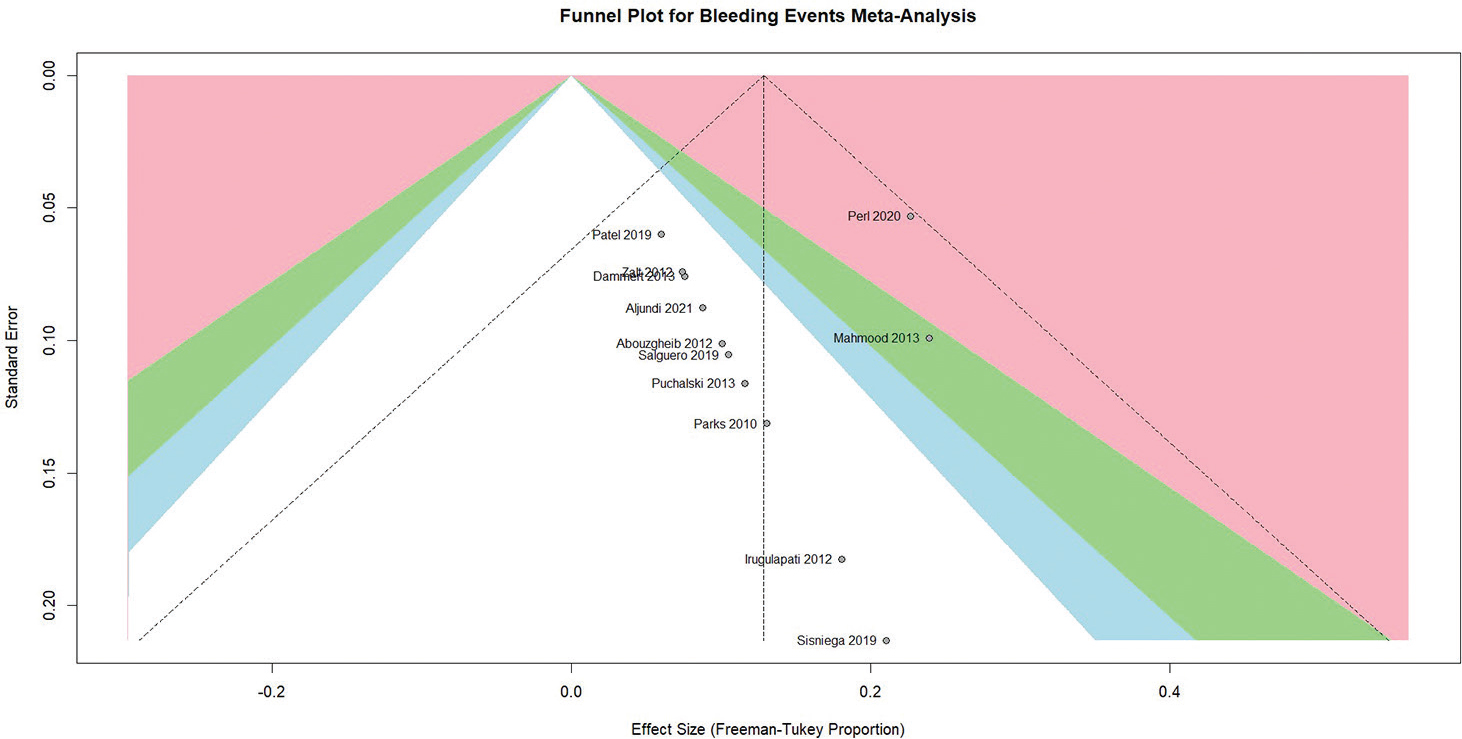
Figure 5.
Funnel plot for the proportion of bleeding events with Freeman-Tukey Double Arcsine transformation applied for zero events.
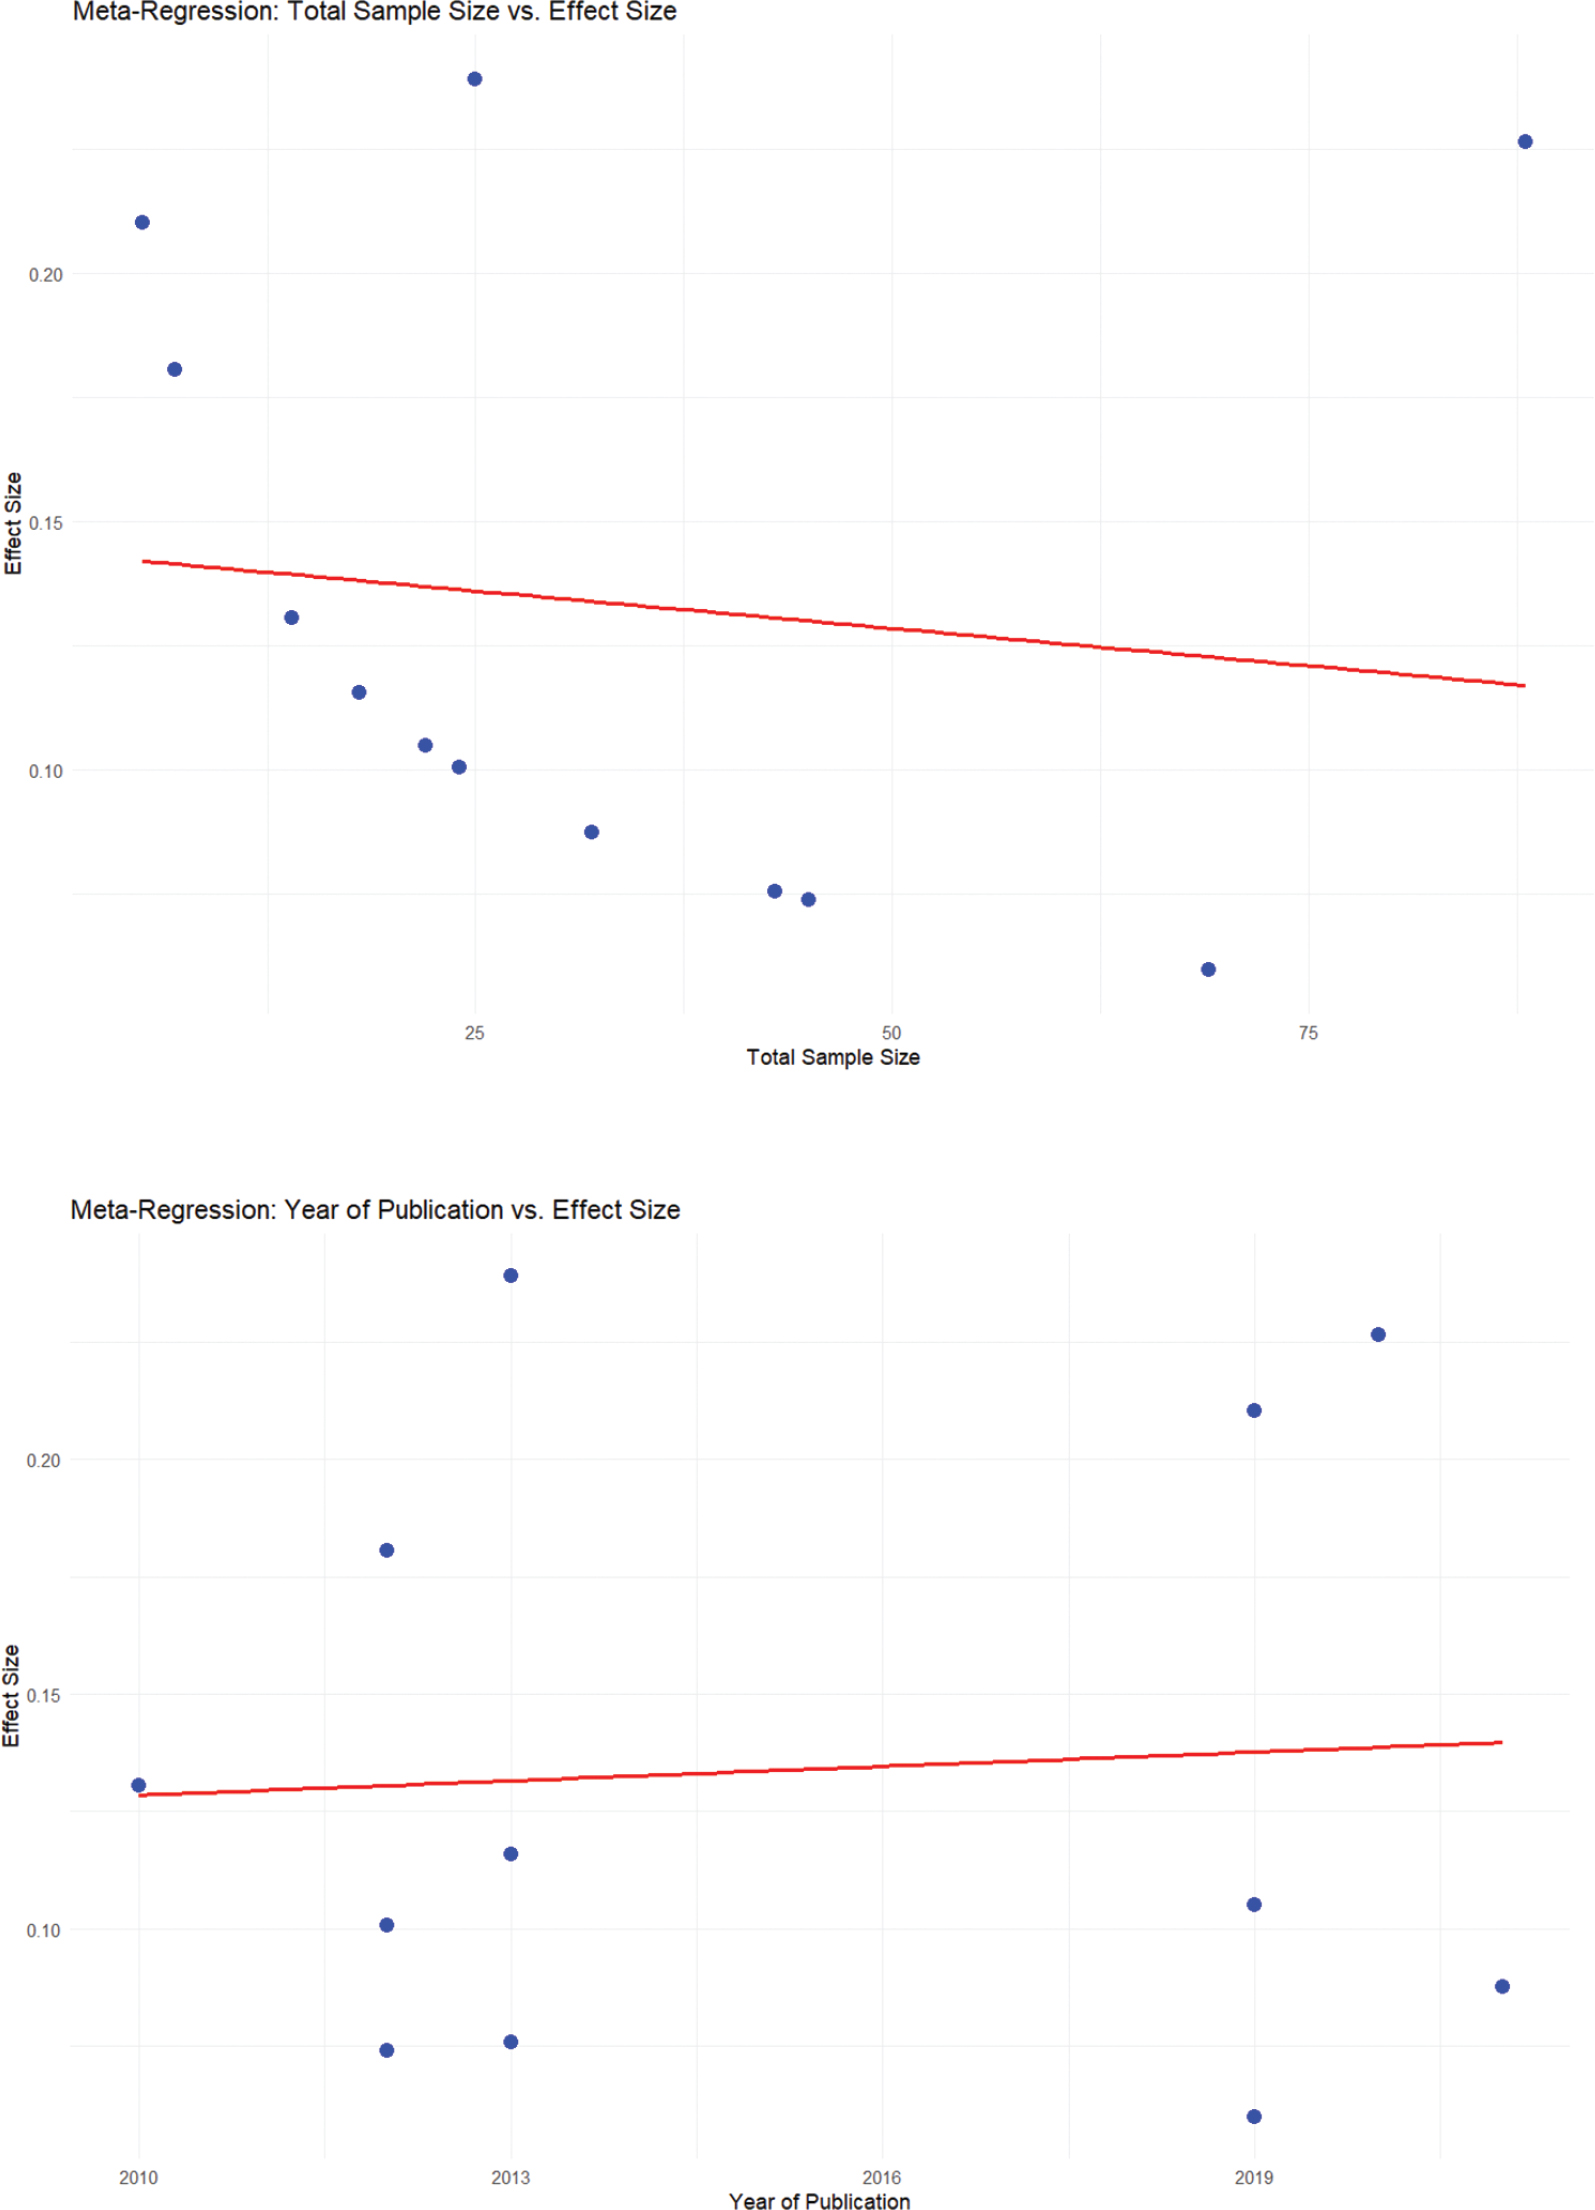
Figure 6.
Meta-regression for total sample size (top) and year of publication (bottom) versus effect size for the proportion of bleeding events in the included studies.