
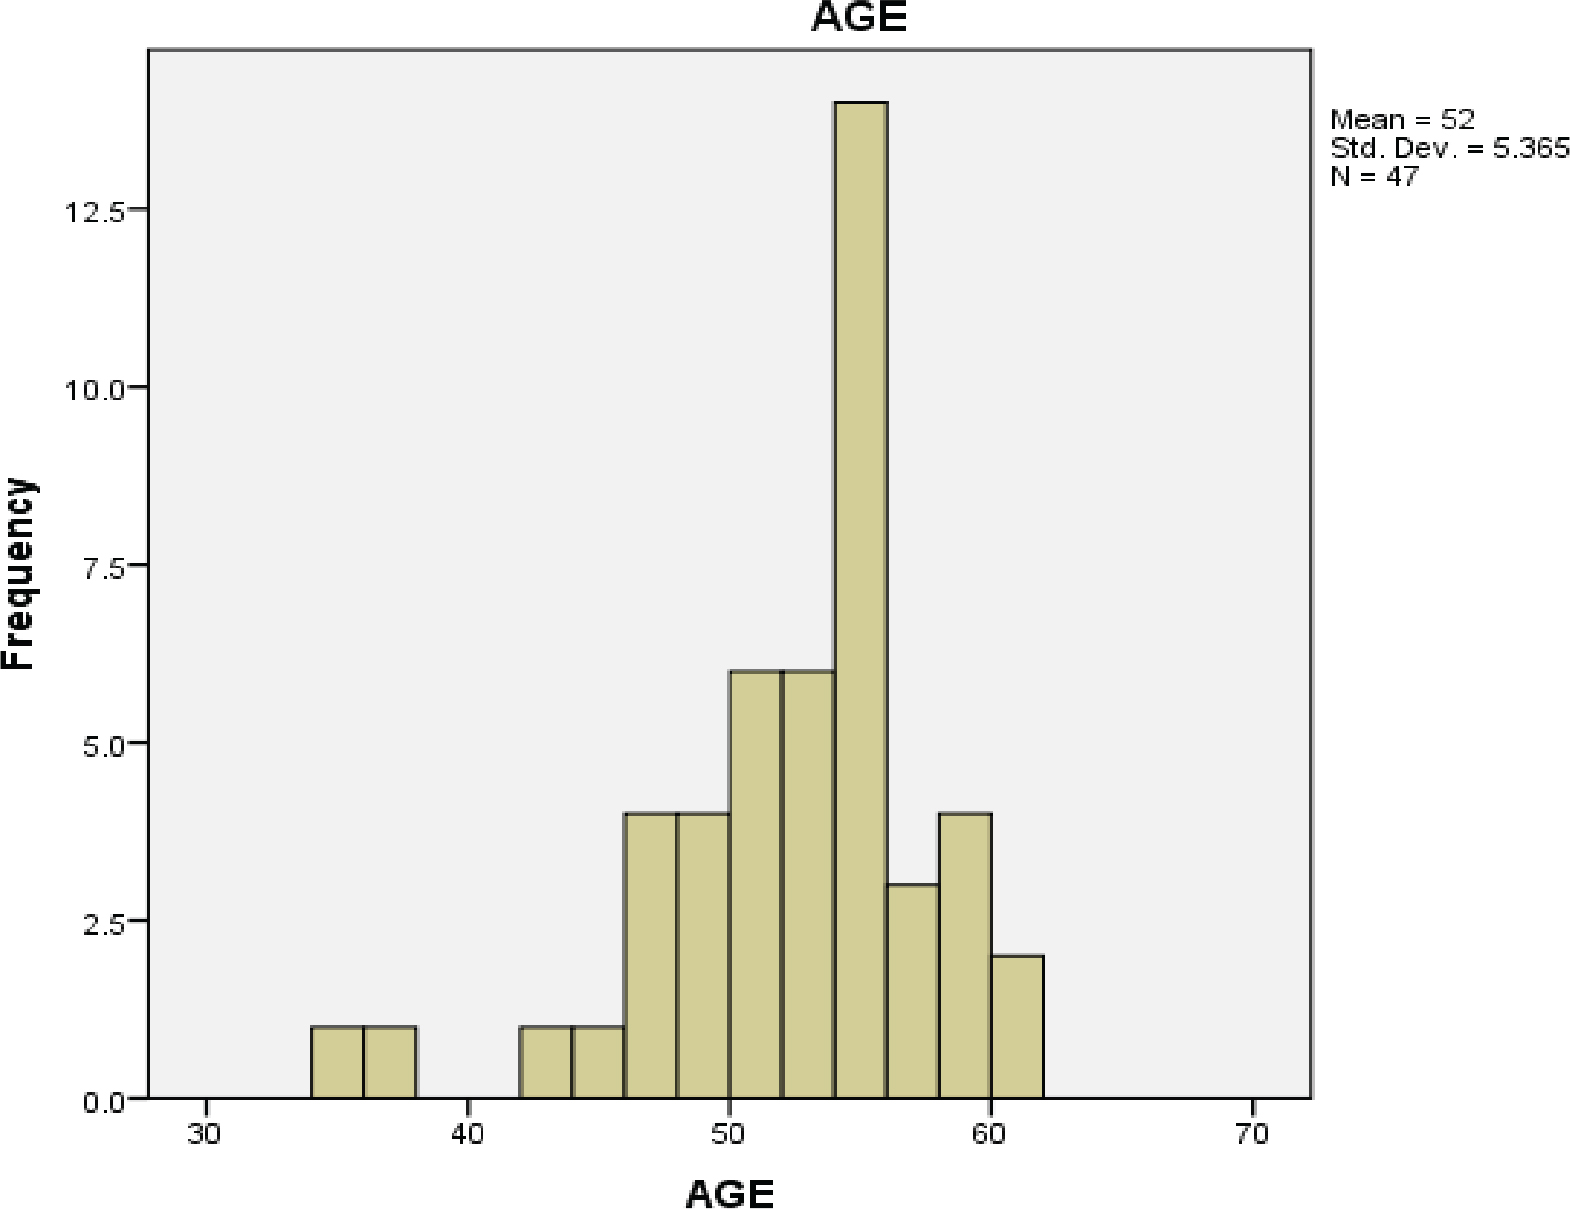
Figure 1.
Age histogram.
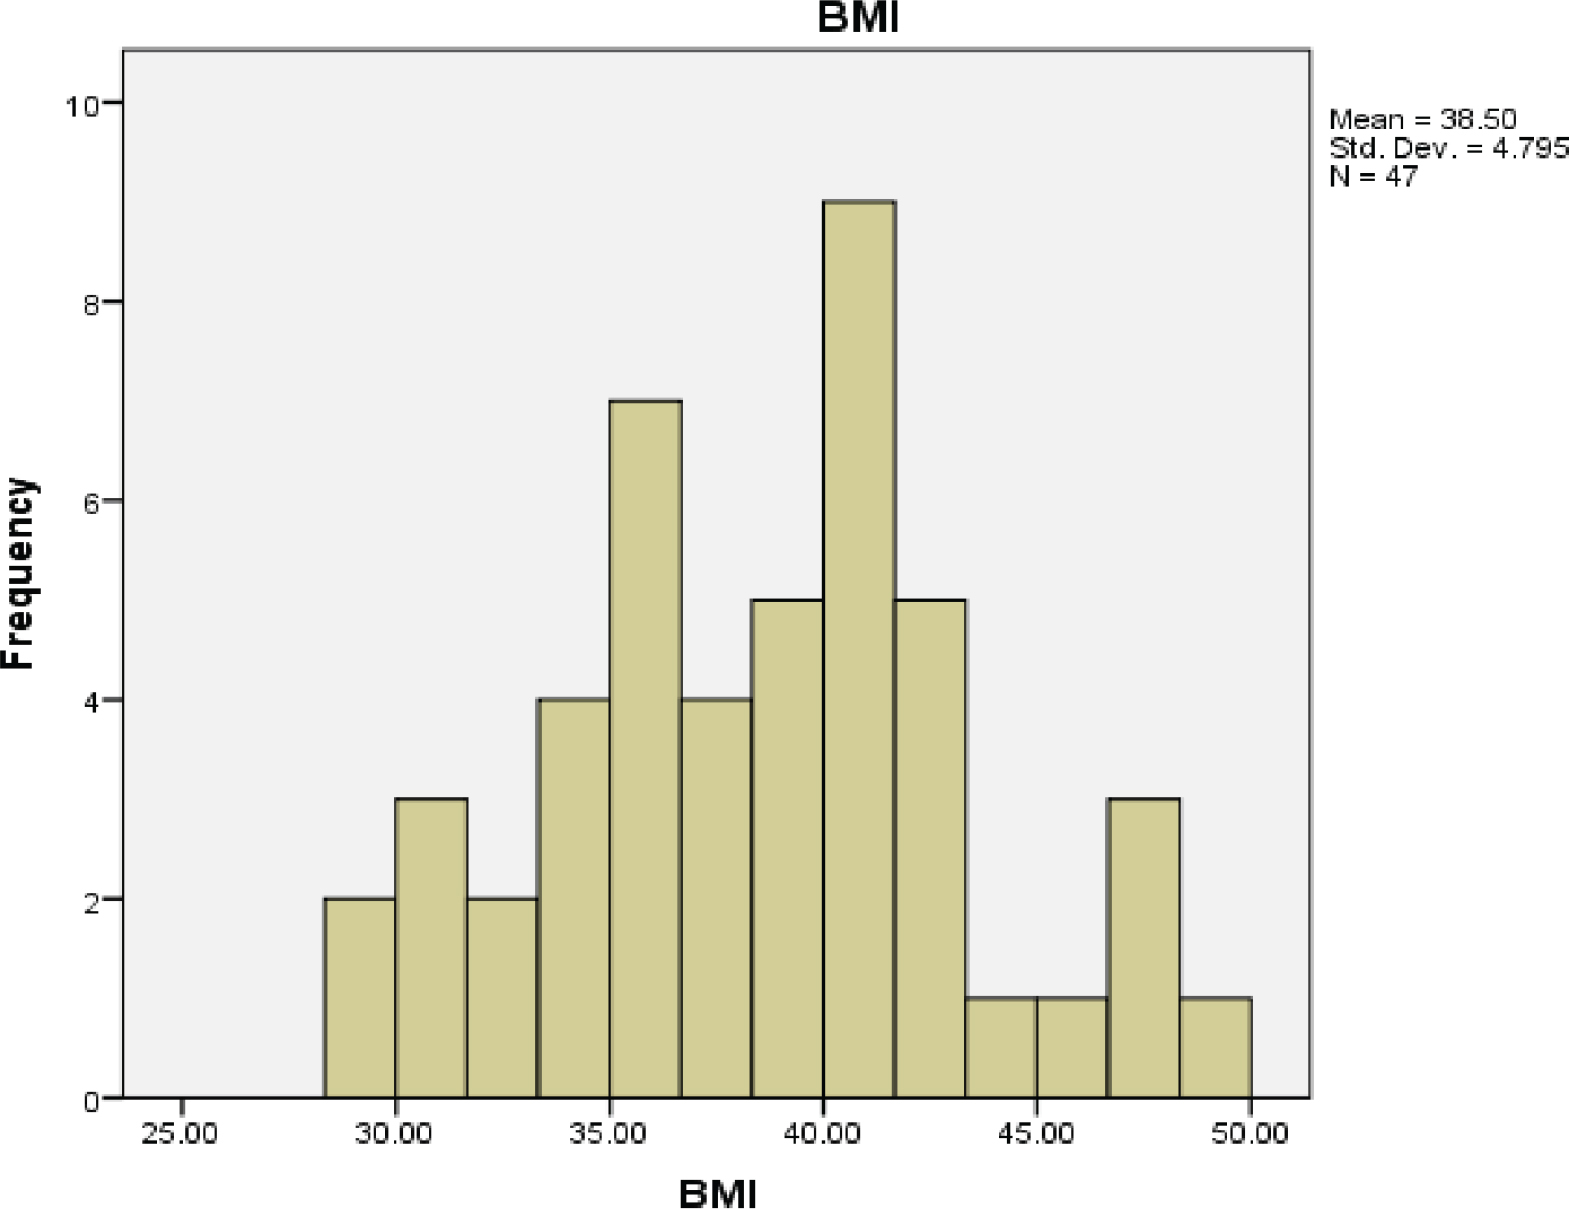
Figure 2.
Body mass index.
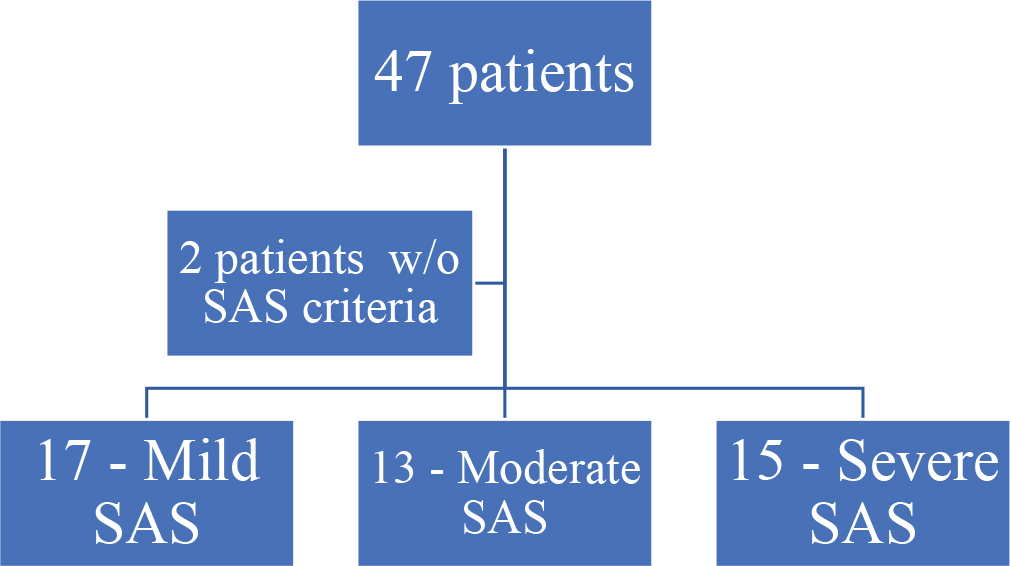
Figure 3.
Classification of enrolled patients.
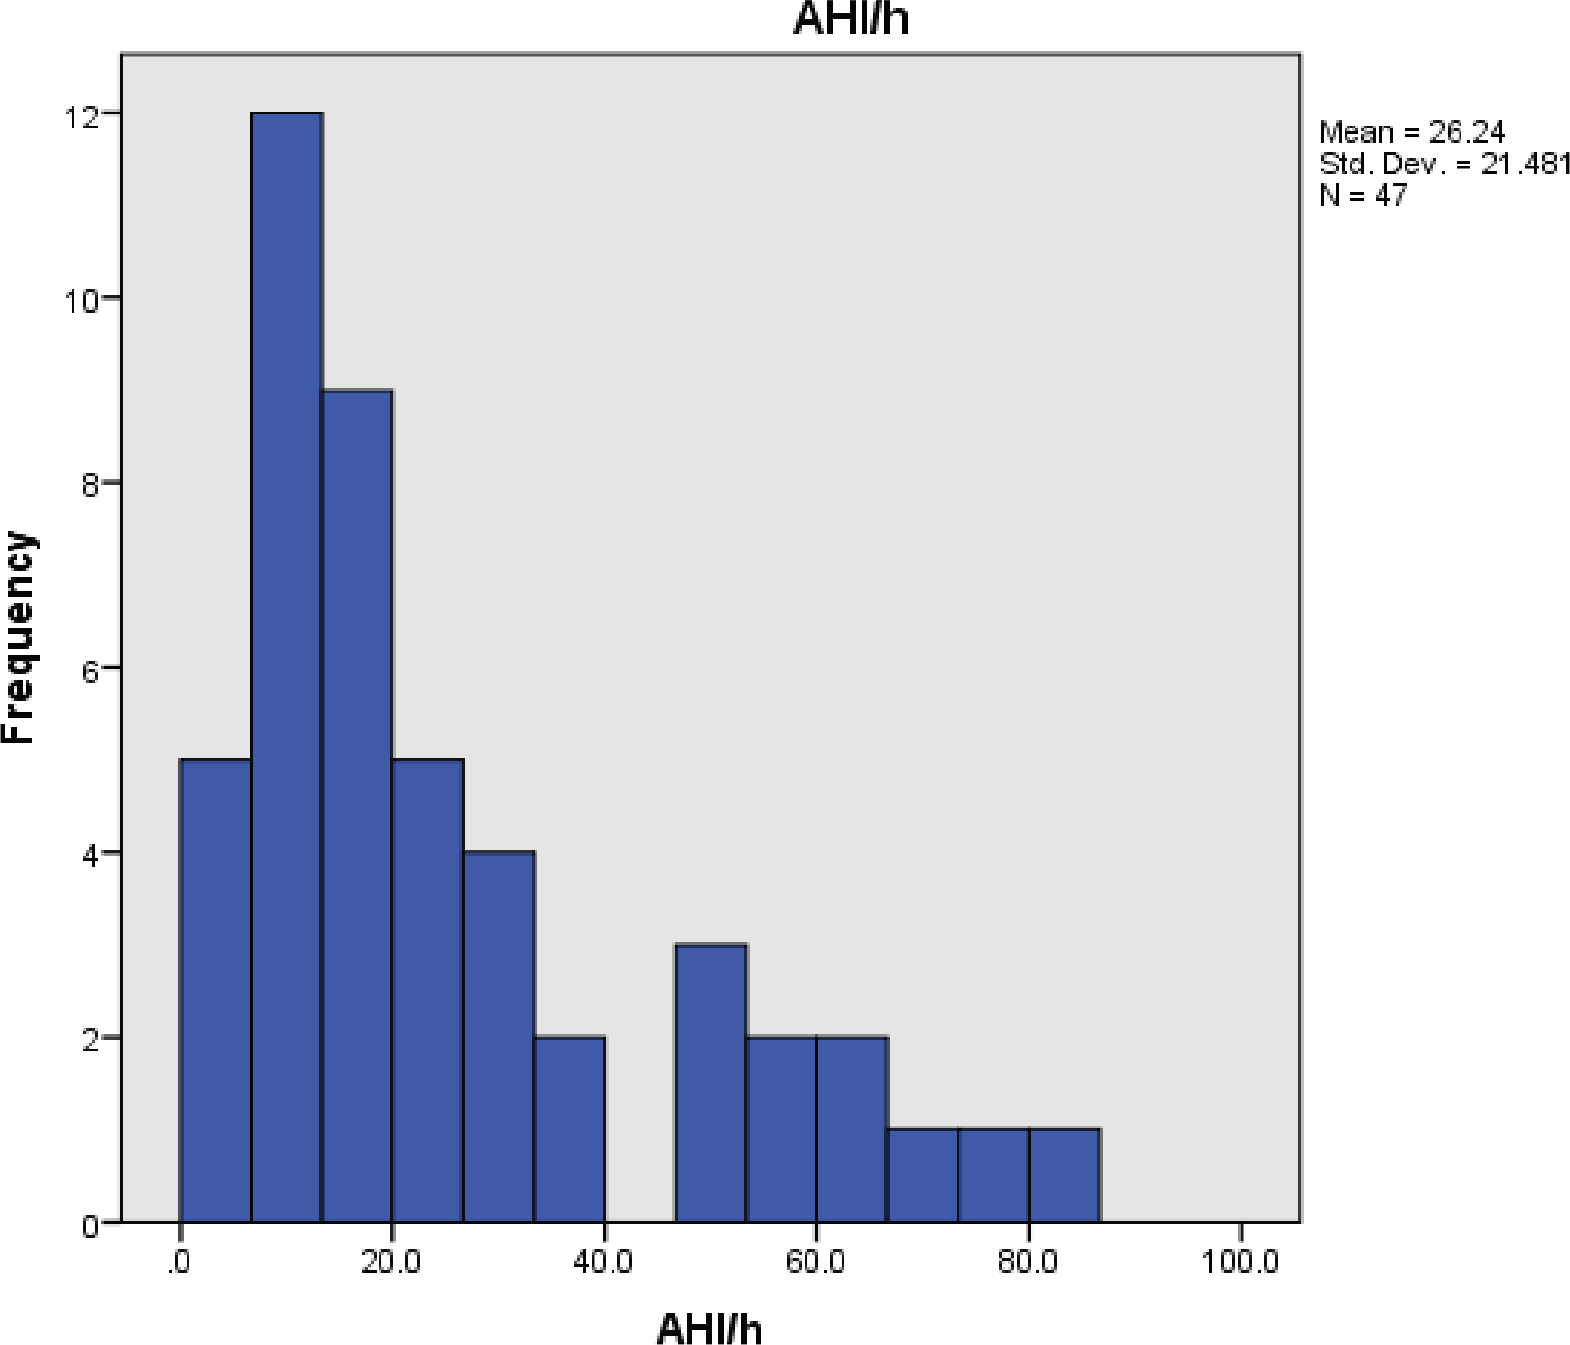
Figure 4.
AHI histogram. AHI, apnoea-hypopnea index.
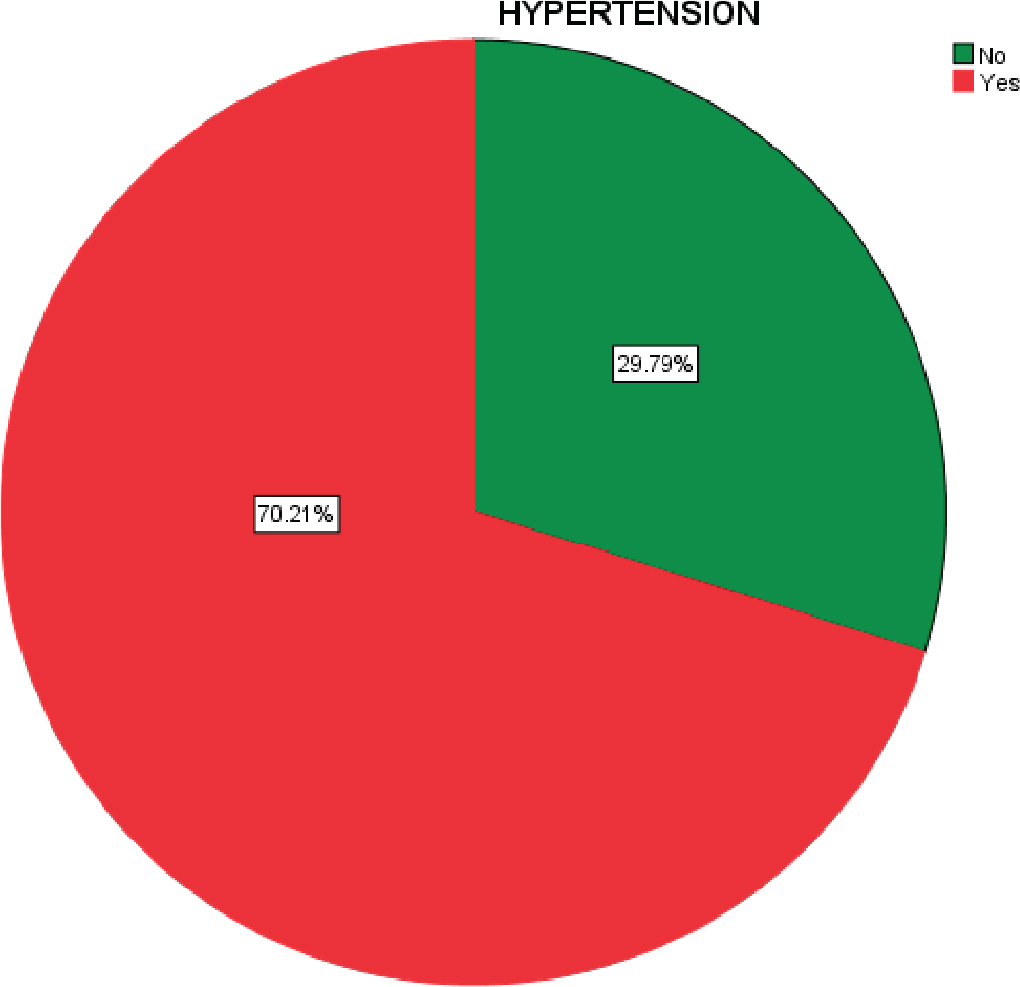
Figure 5.
Arterial hypertension.
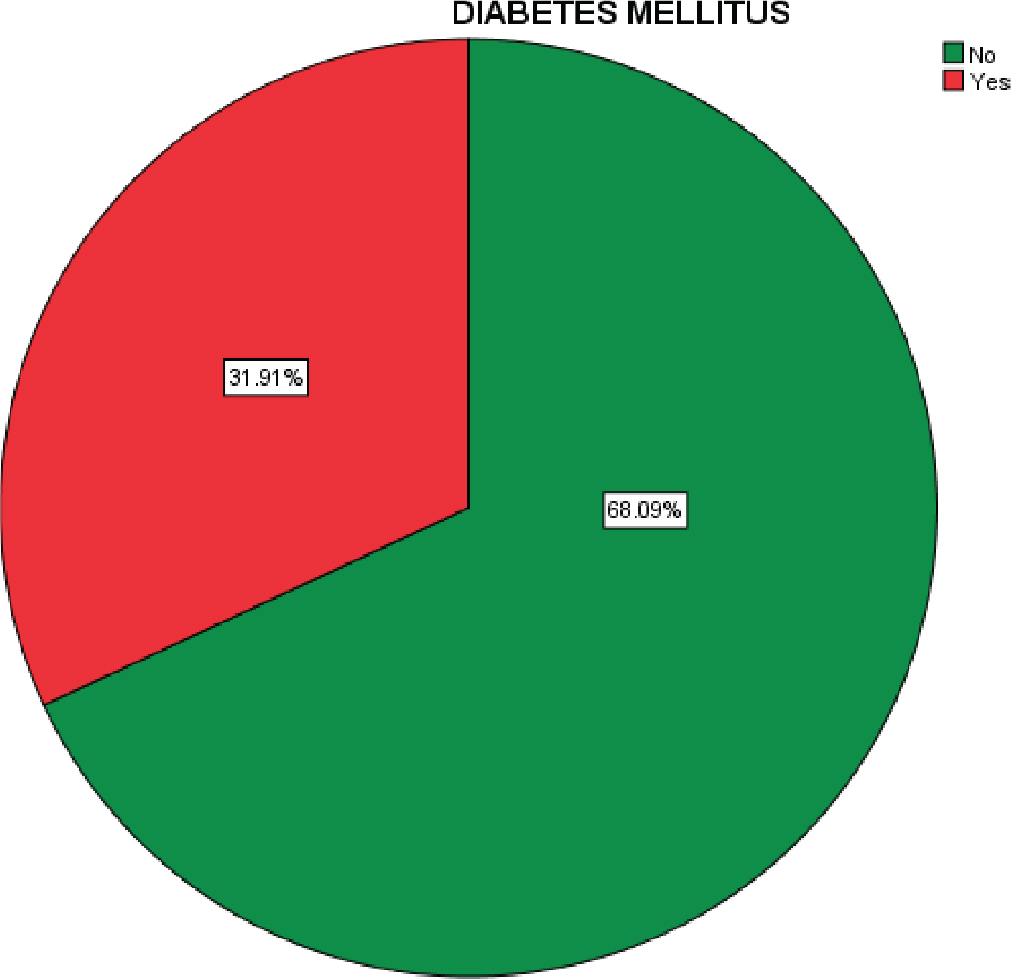
Figure 6.
Diabetes mellitus.
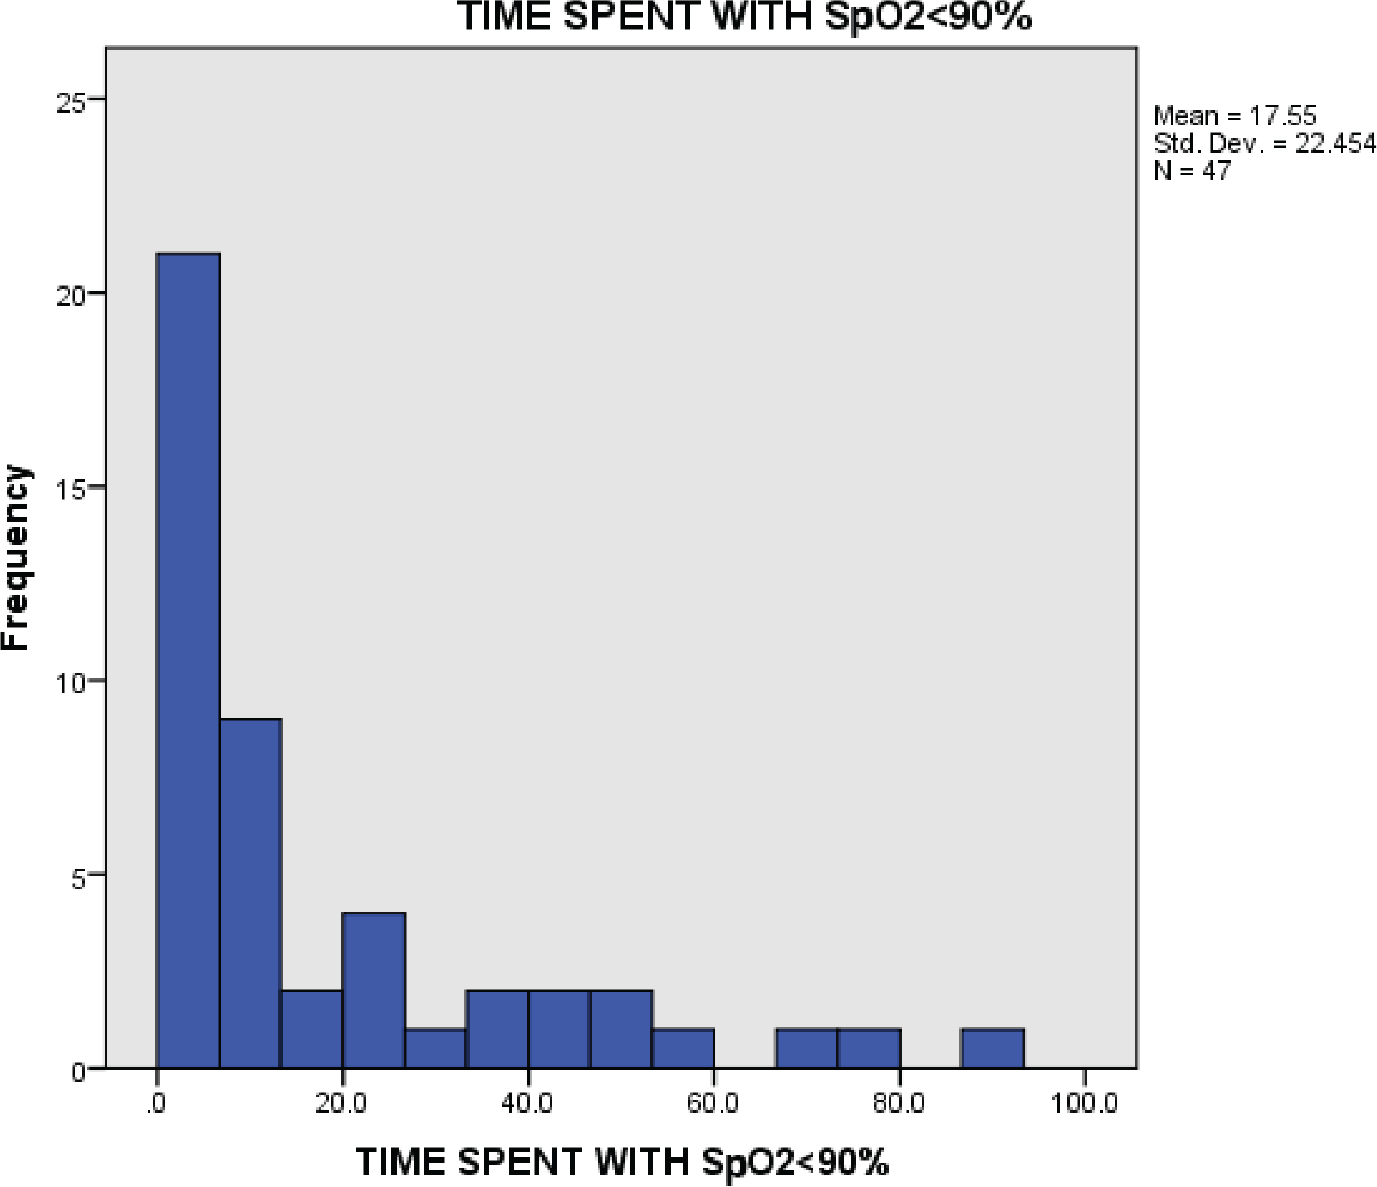
Figure 7.
Time spent with oxygen saturation <90%.
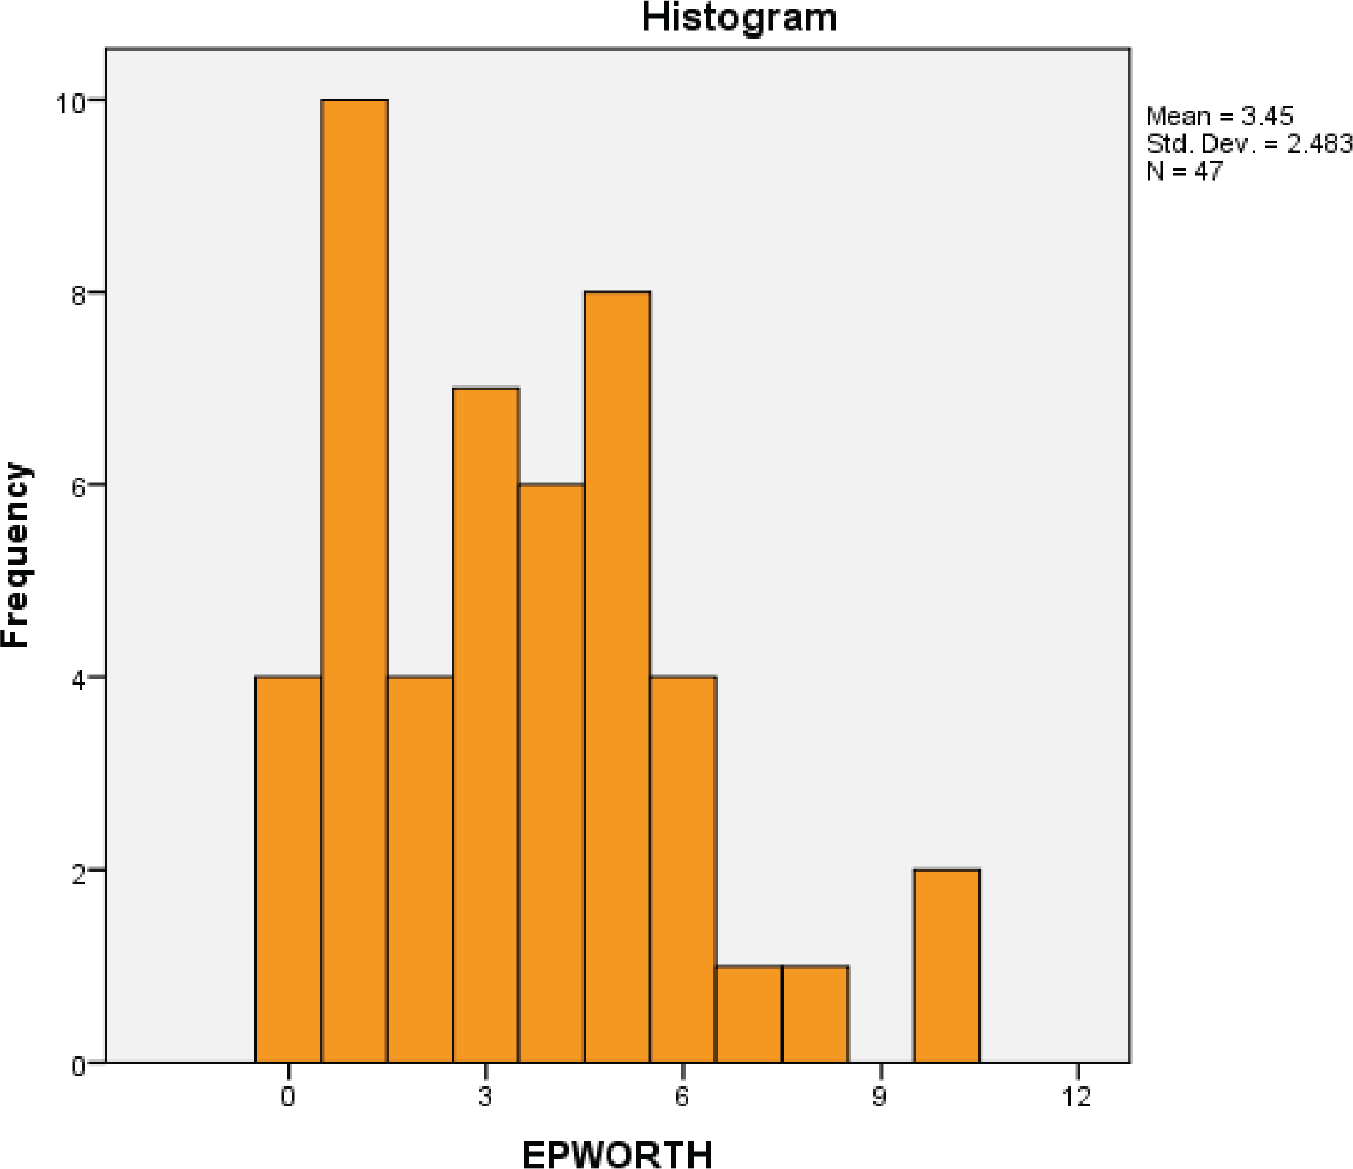
Figure 8.
ESS scores. ESS, Epworth Sleepiness Scale.