
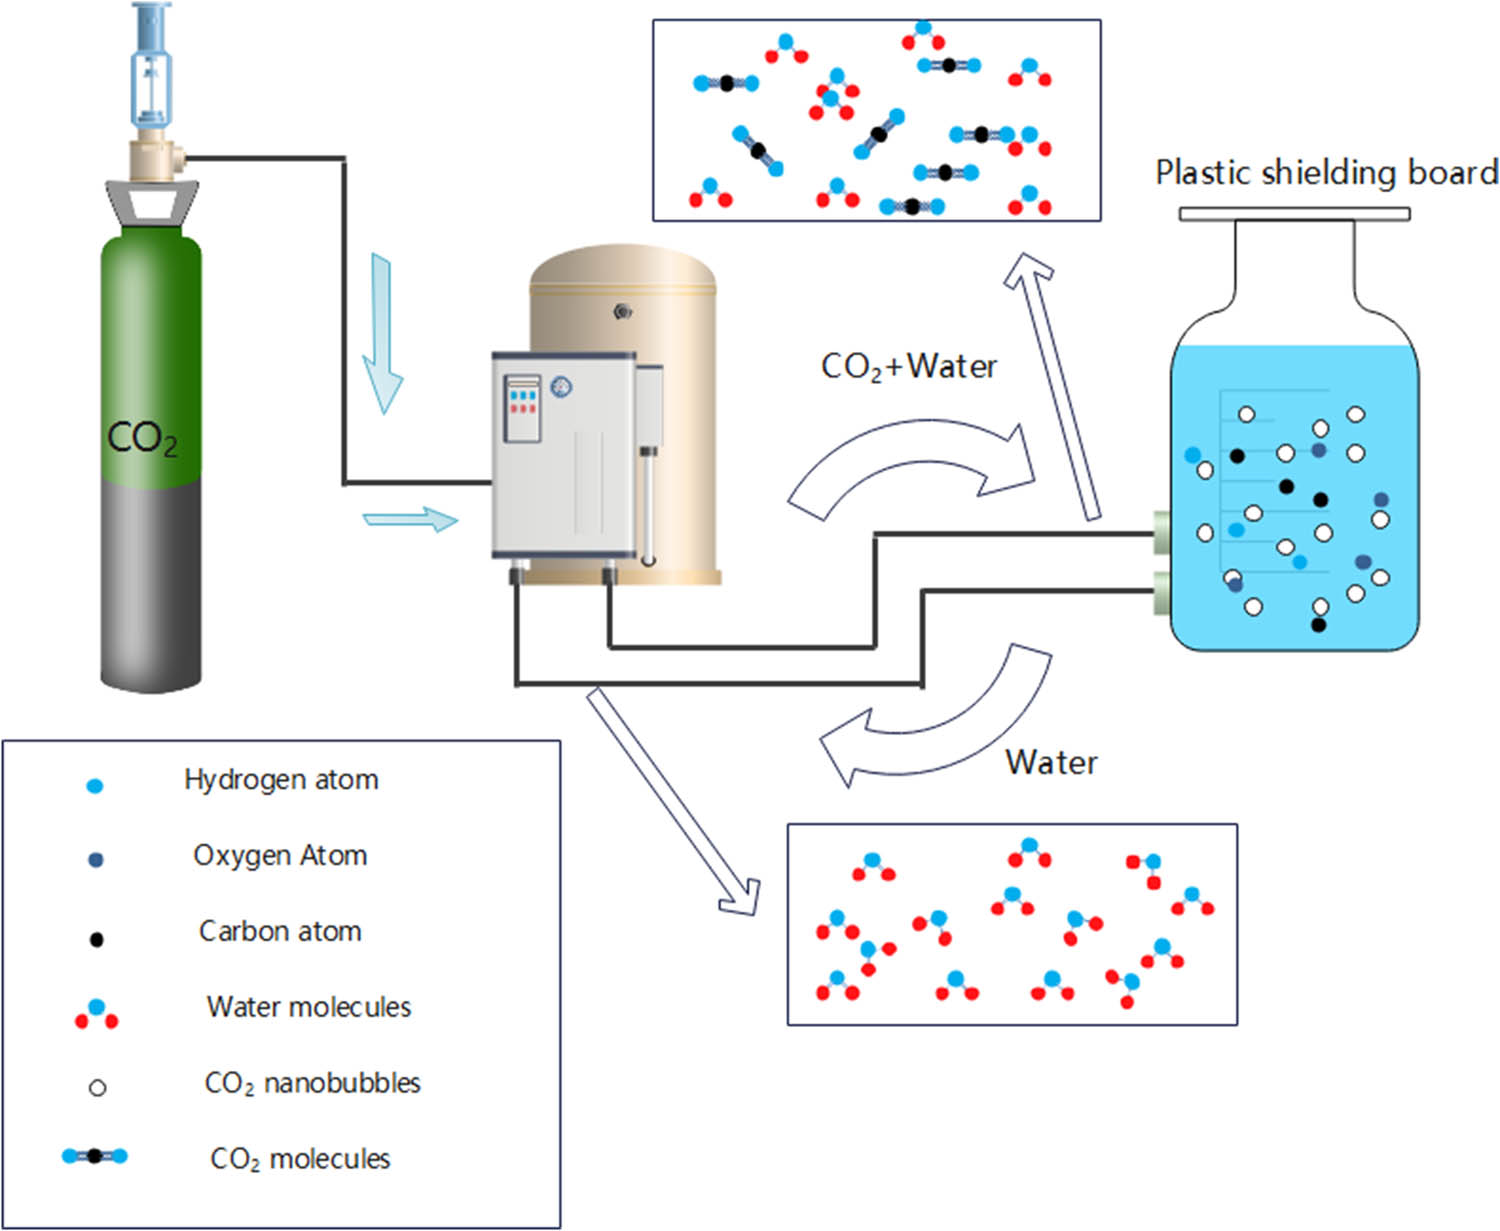
Figure 1
Schematic diagram of CO2 nano bubble preparation process.
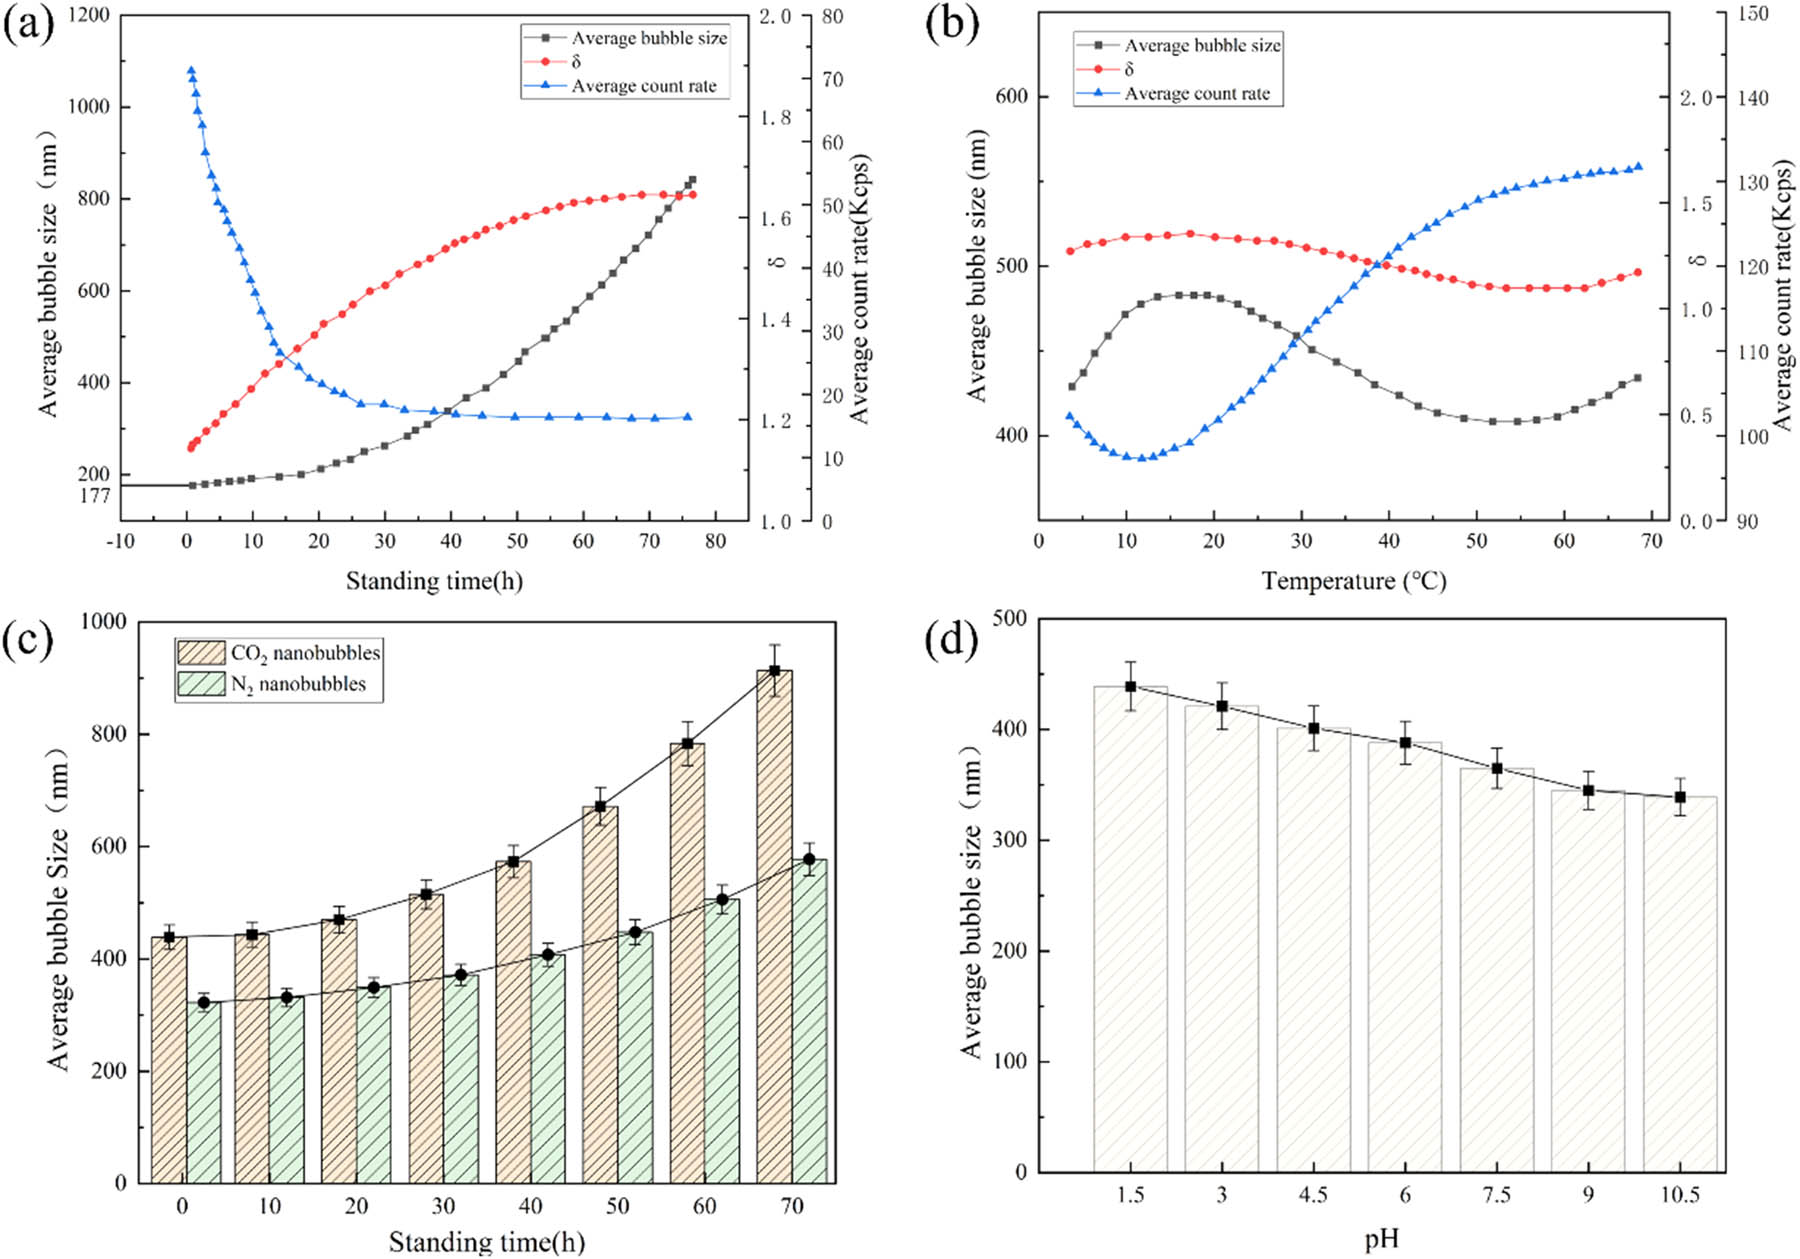
Figure 2
Size change characteristics of CO2 nano bubbles under static conditions. (a) Effect of standing time; (b) effect of temperature; (c) effect of gas type; (d) effect of pH.
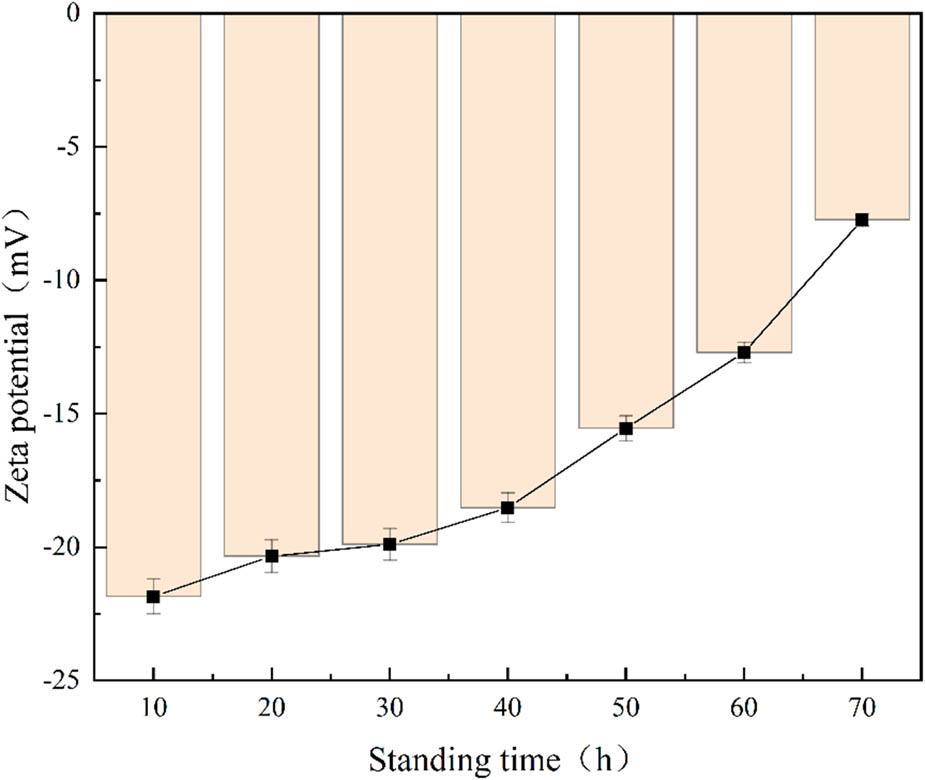
Figure 3
Characteristics of zeta potential changes in CO2 nano bubbles under static conditions.
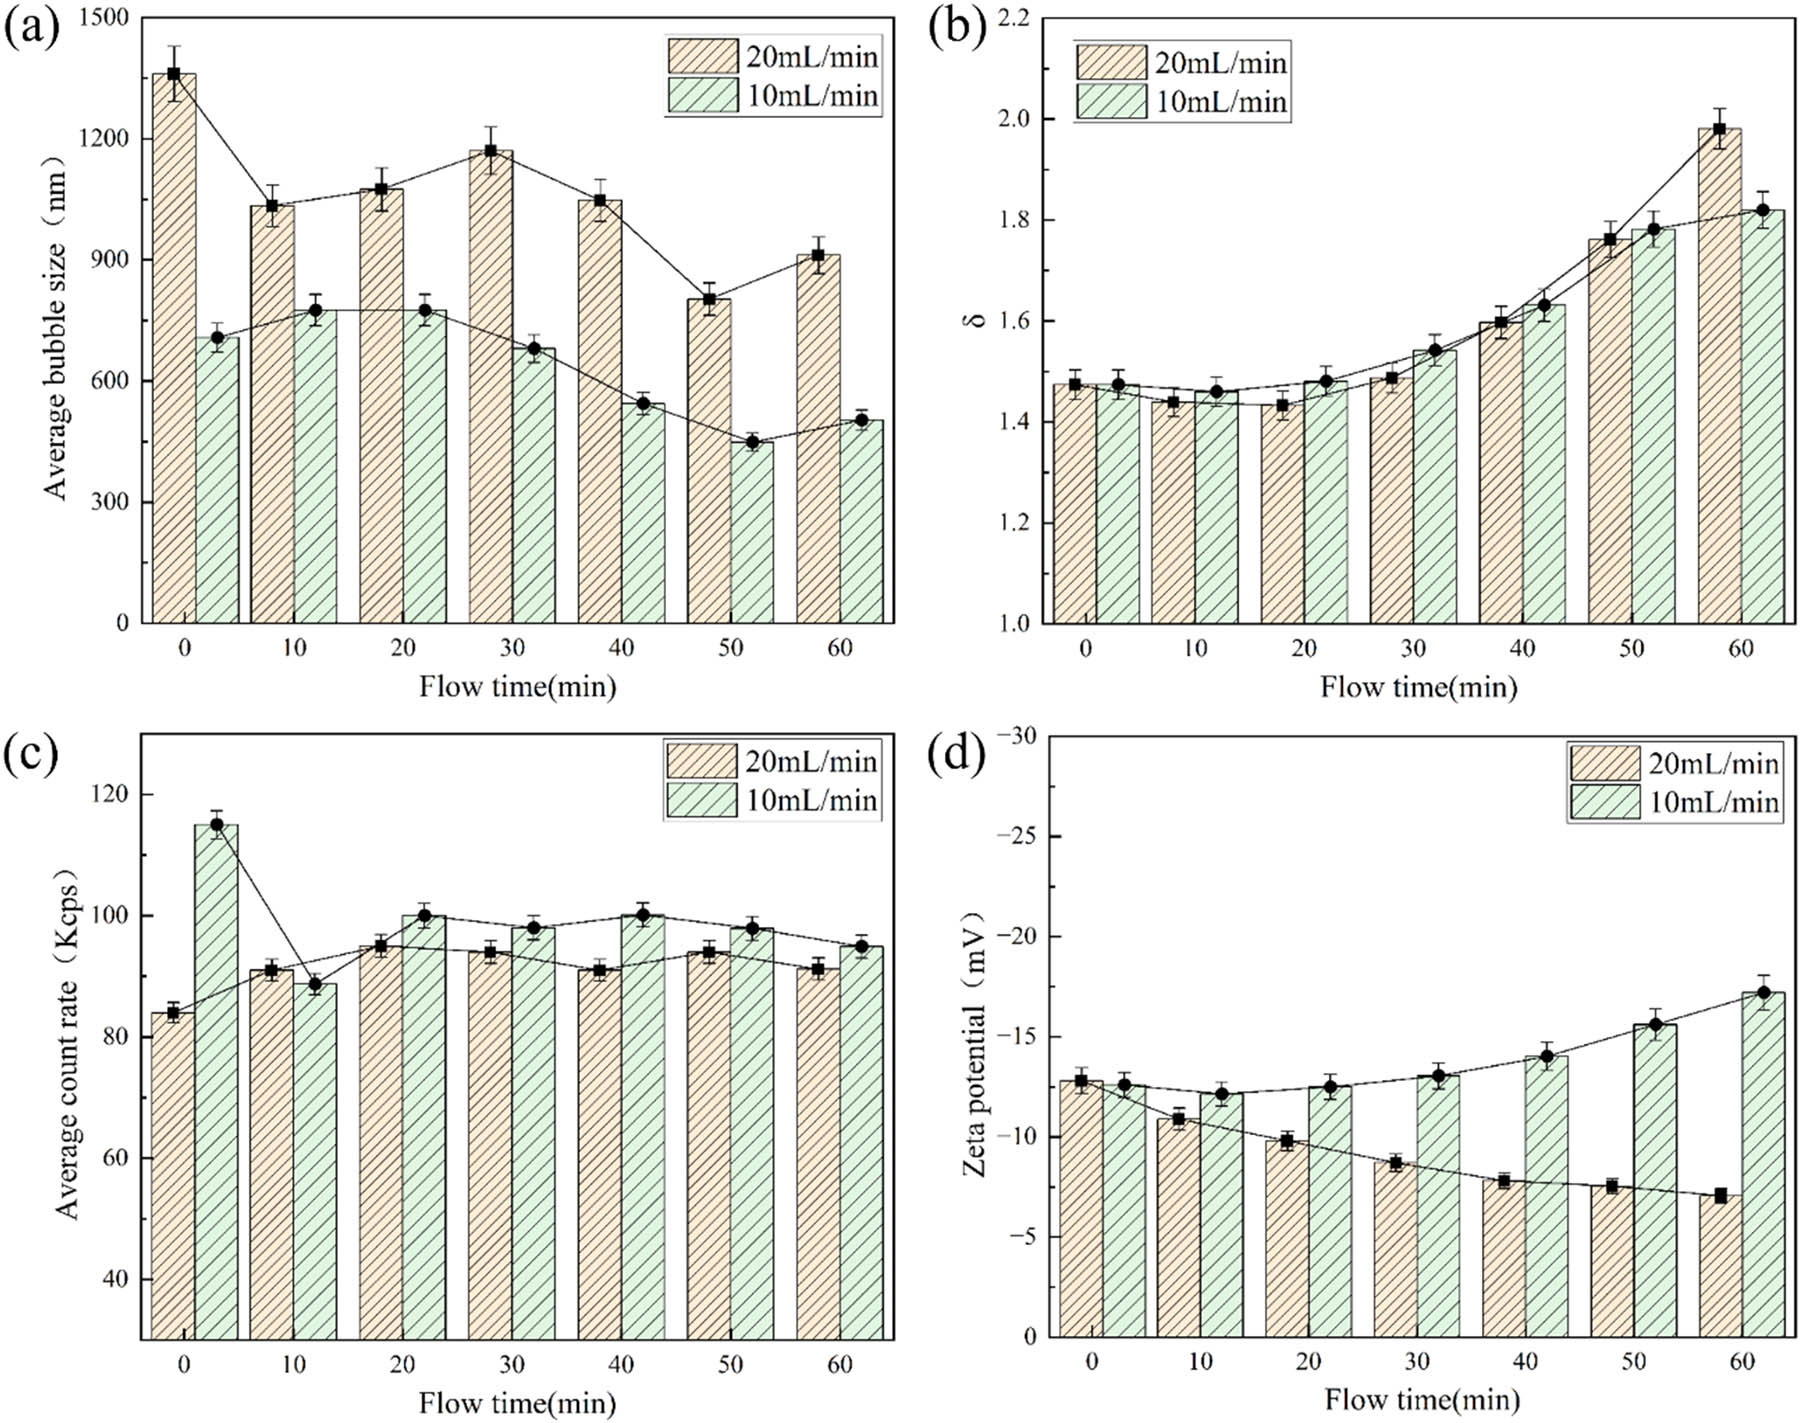
Figure 4
Characteristics of changes in average size and zeta potential of CO2 nano bubbles under flow mode. (a) Result of bubble size; (b) result of dispersibility coefficient; (c) result of count rate; (d) result of zeta potentia.
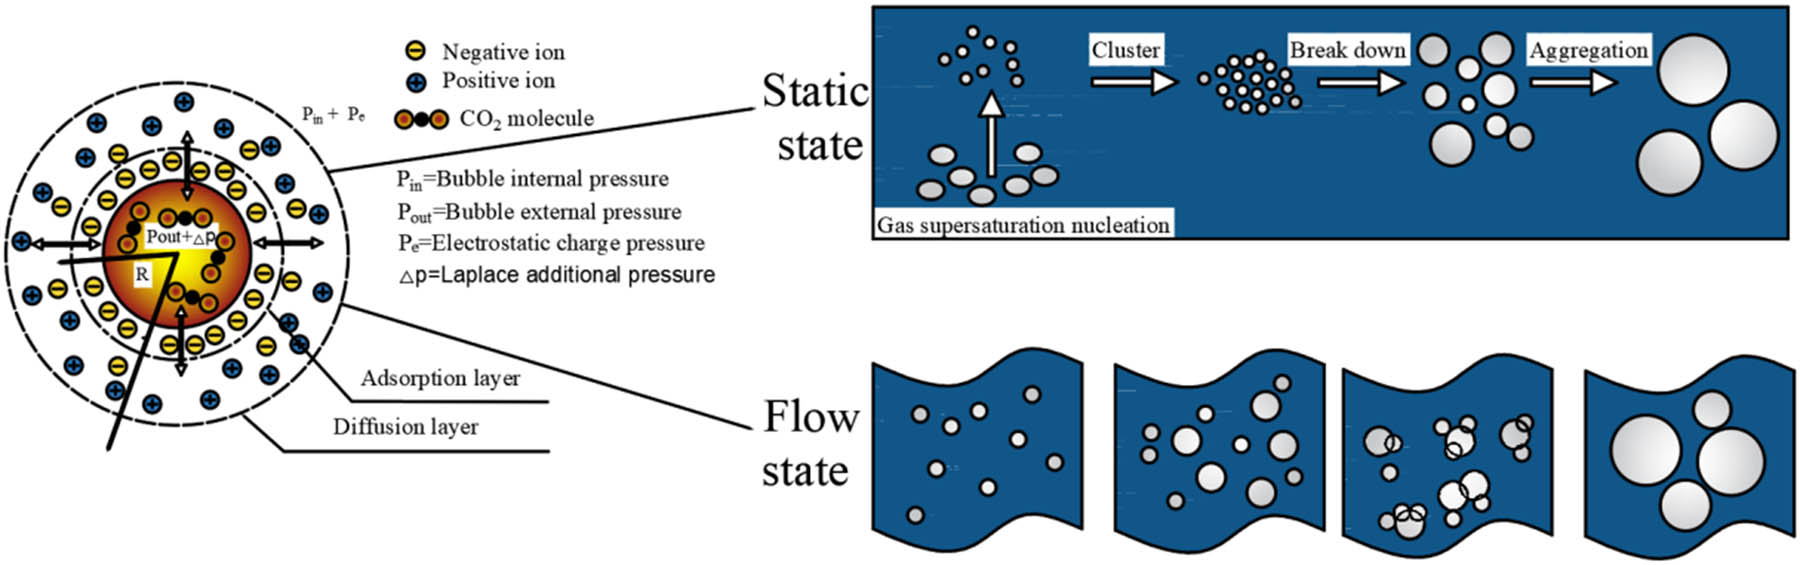
Figure 5
Evolution process of CO2 nano bubbles with time under static and flowing conditions.
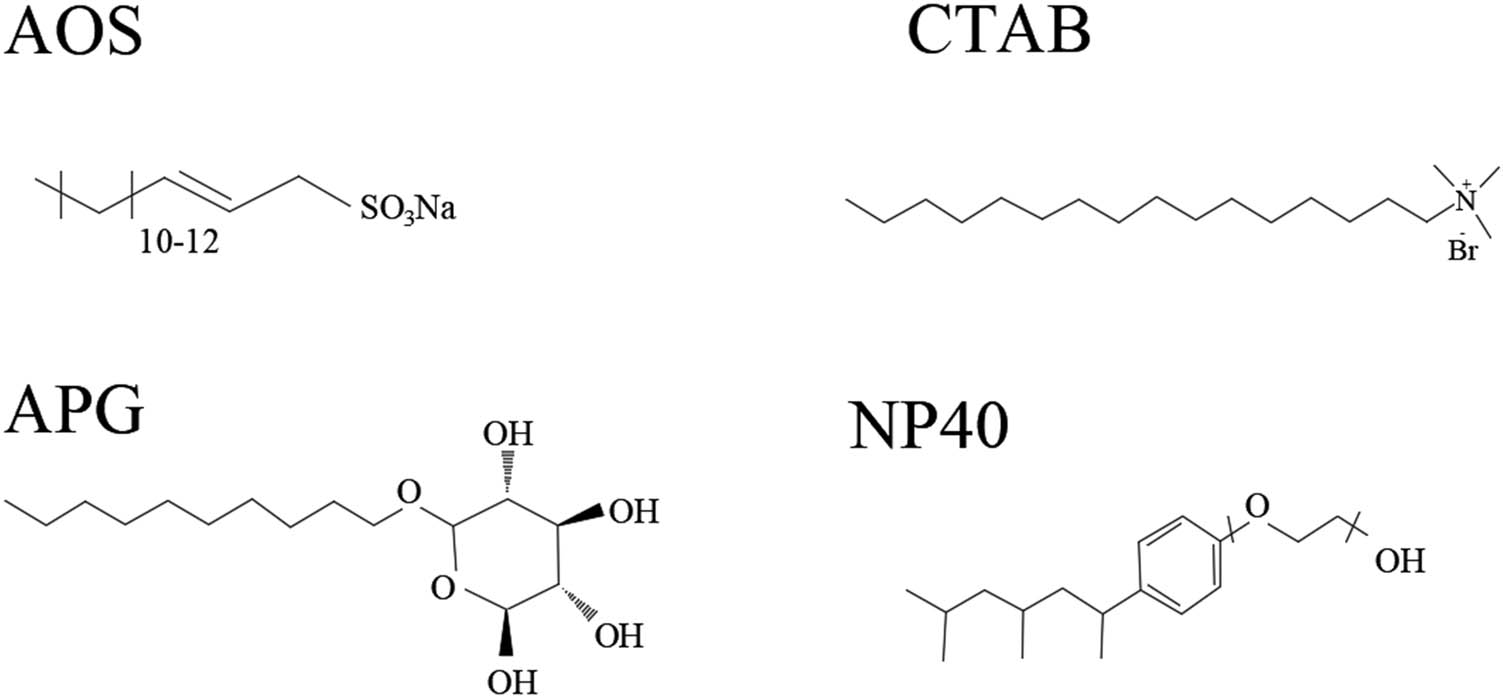
Figure 6
Chemical structural formula of the surfactant used.
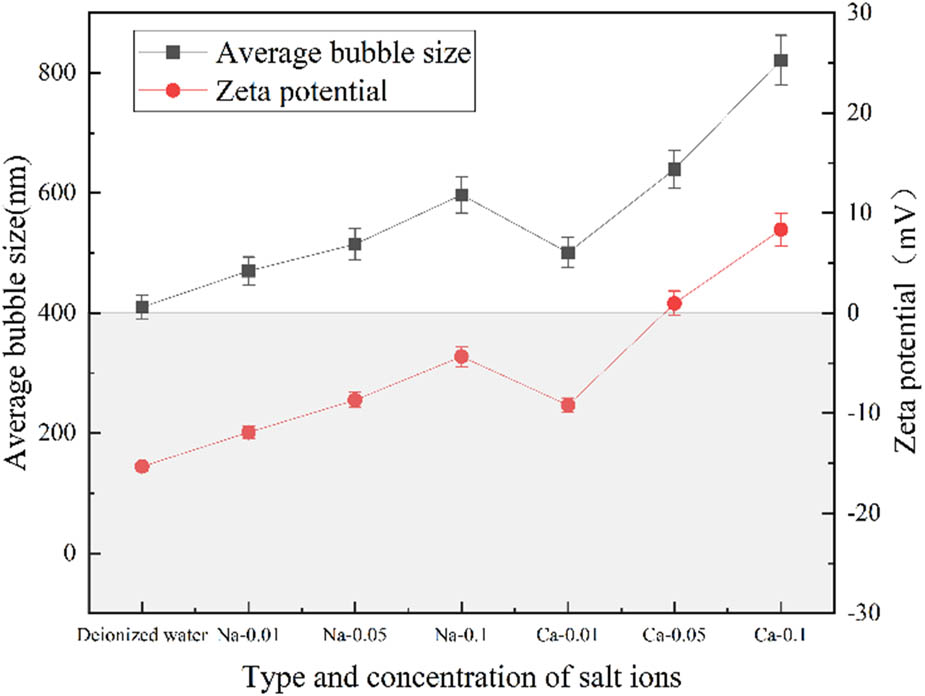
Figure 7
The influence of salt ions on the relative stability of CO2 nano bubbles.
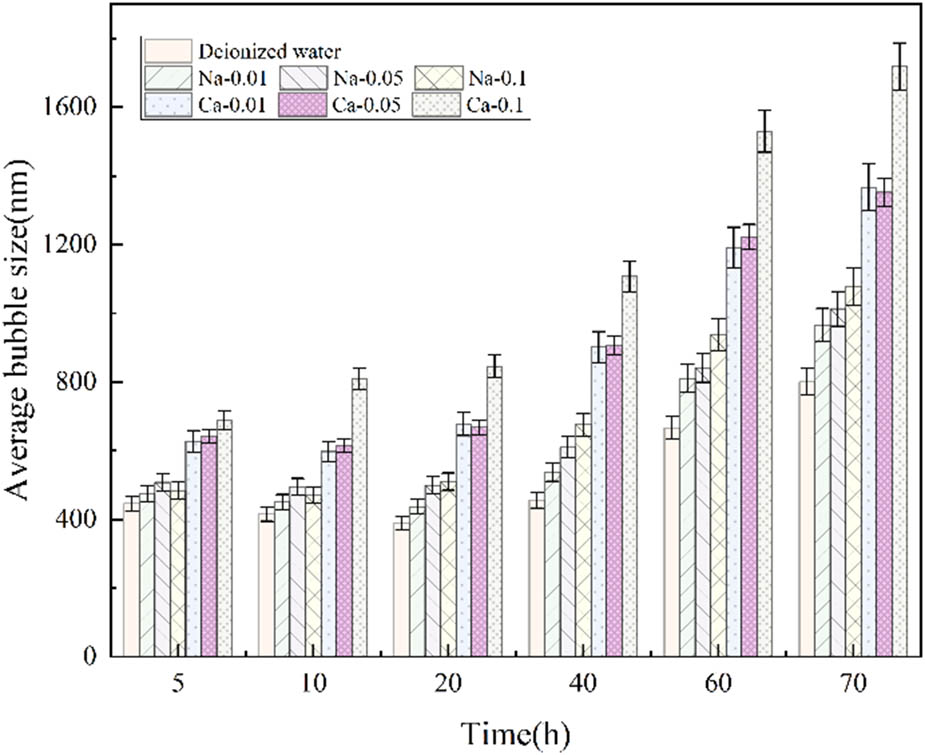
Figure 8
Changes in CO2 nano bubbles formed by solutions with different salt ion types and concentrations over time.
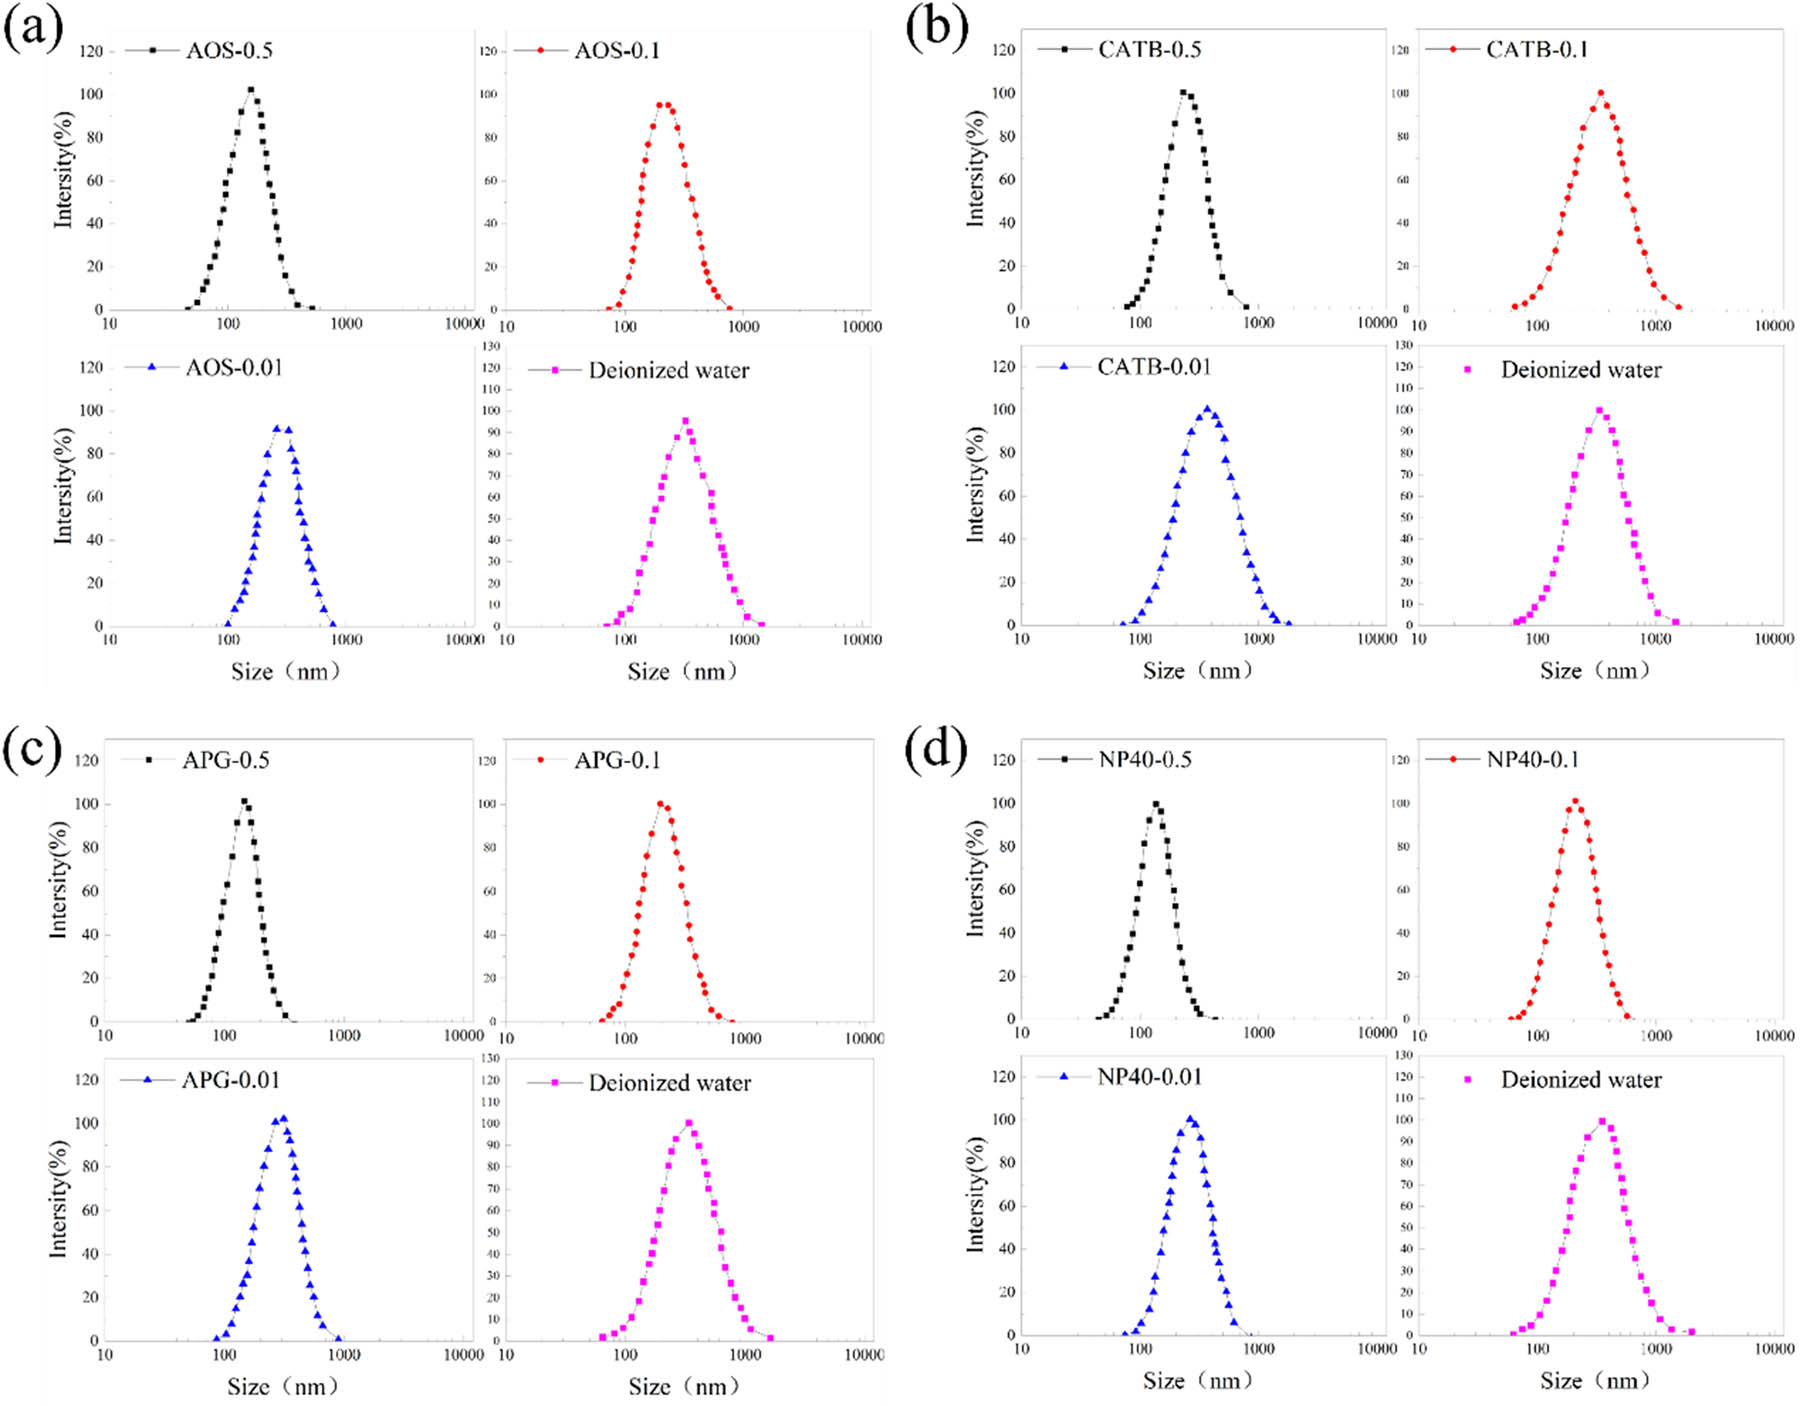
Figure 9
The influence of surfactant type and concentration on the formation of CO2 nano bubbles. (a) Effect of AOS concentration; (b) effect of CATB concentration; (c) effect of APG concentration; (d) effect of NP40 concentration.
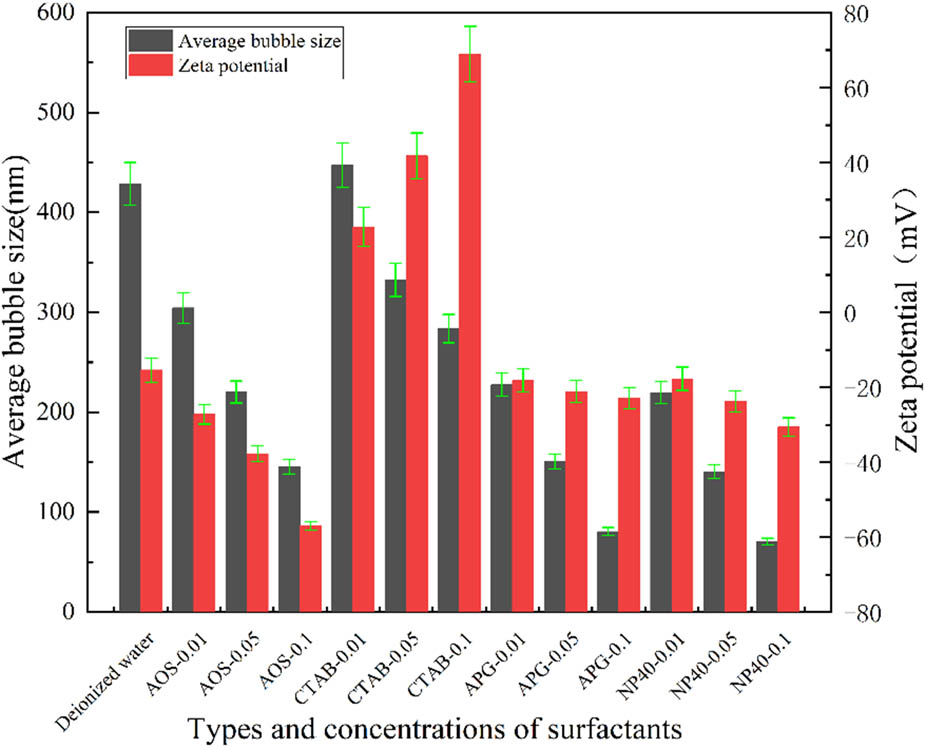
Figure 10
Effect of surfactant type and concentration on the relative stability of CO2 nano bubbles.
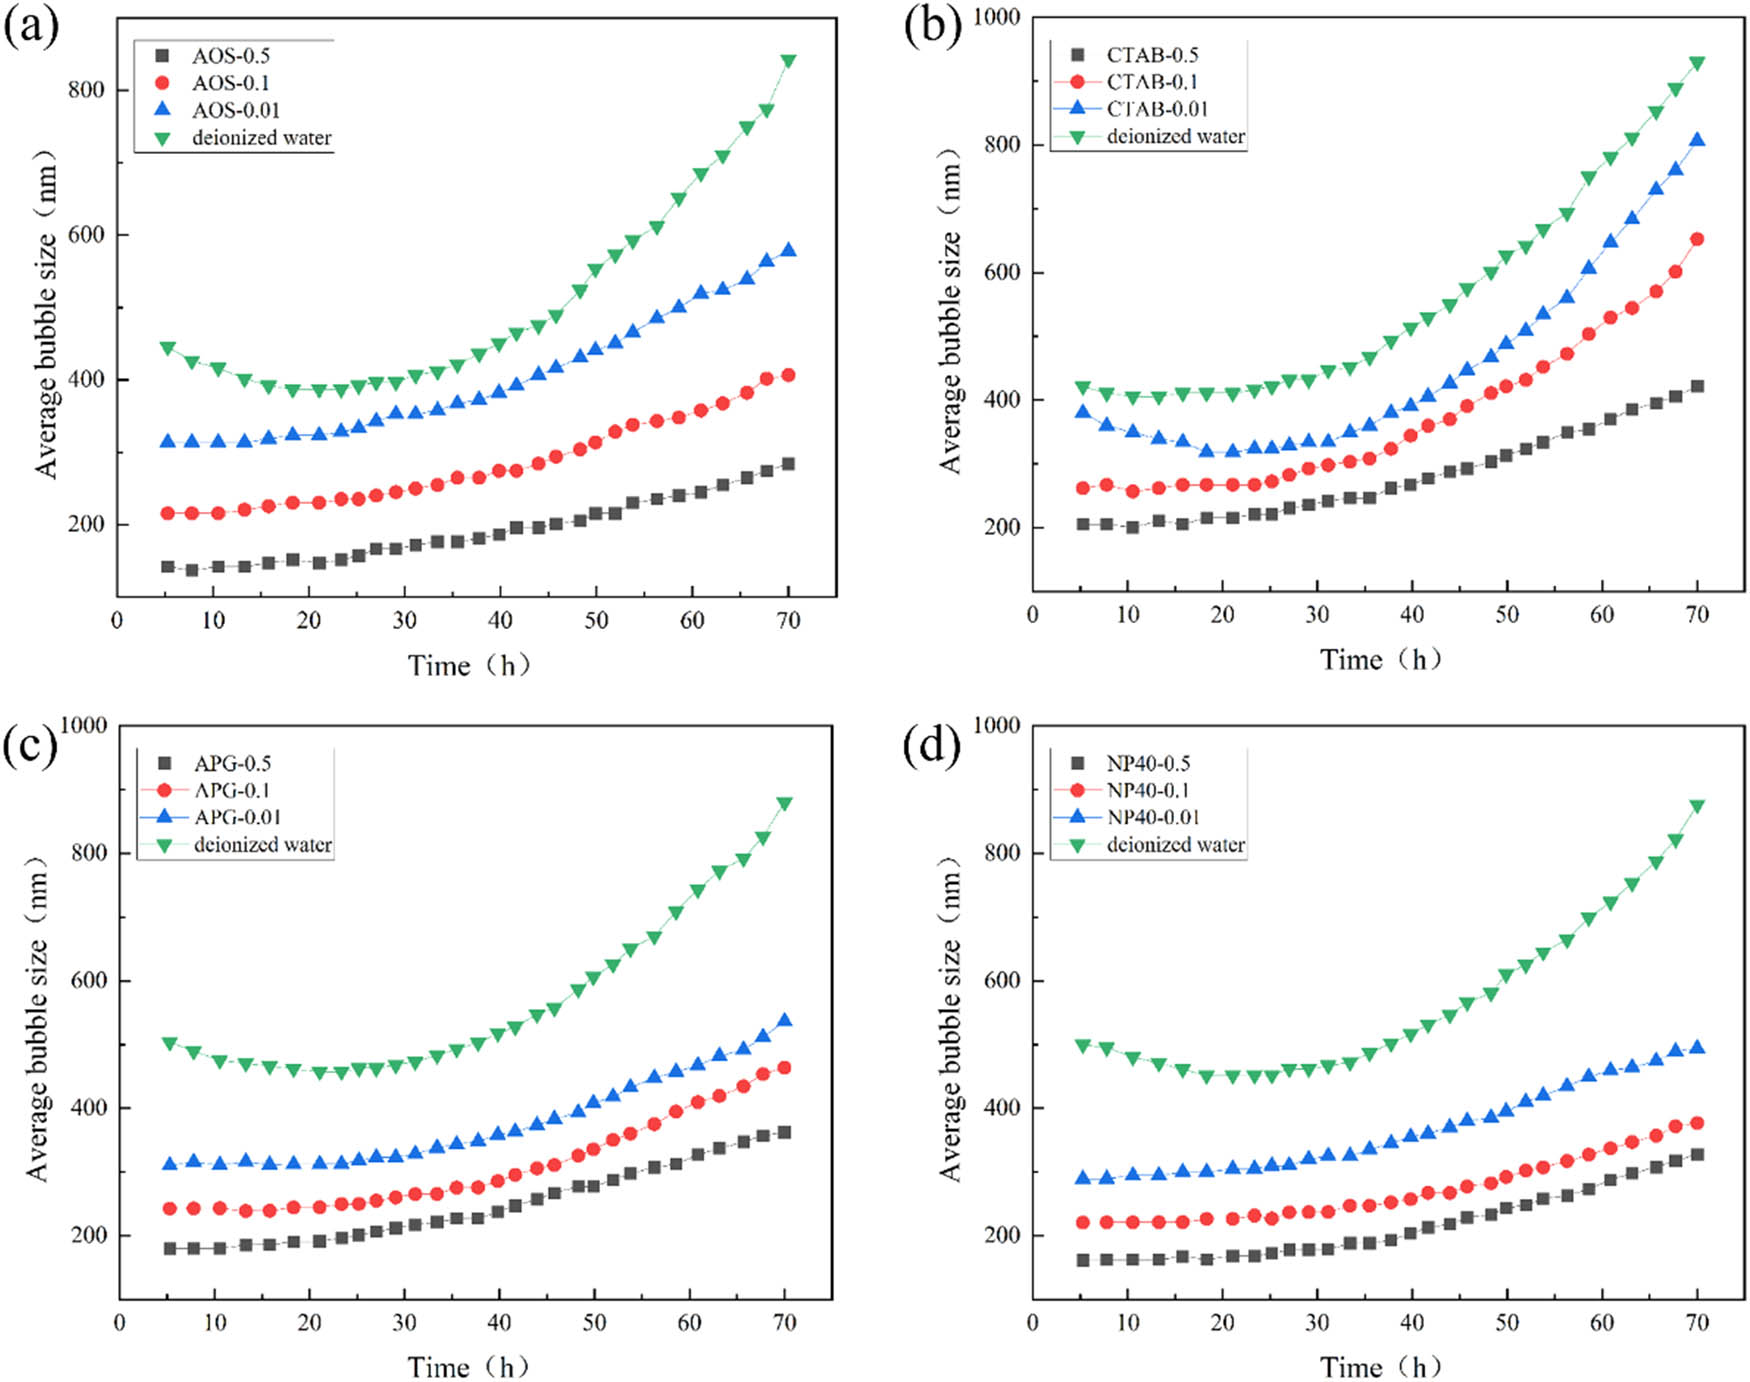
Figure 11
Changes in CO2 nano bubbles formed by surfactant solutions of different types and concentrations over time. (a) Effect of AOS concentration; (b) effect of CATB concentration; (c) effect of APG concentration; (d) Effect of NP40 concentration.
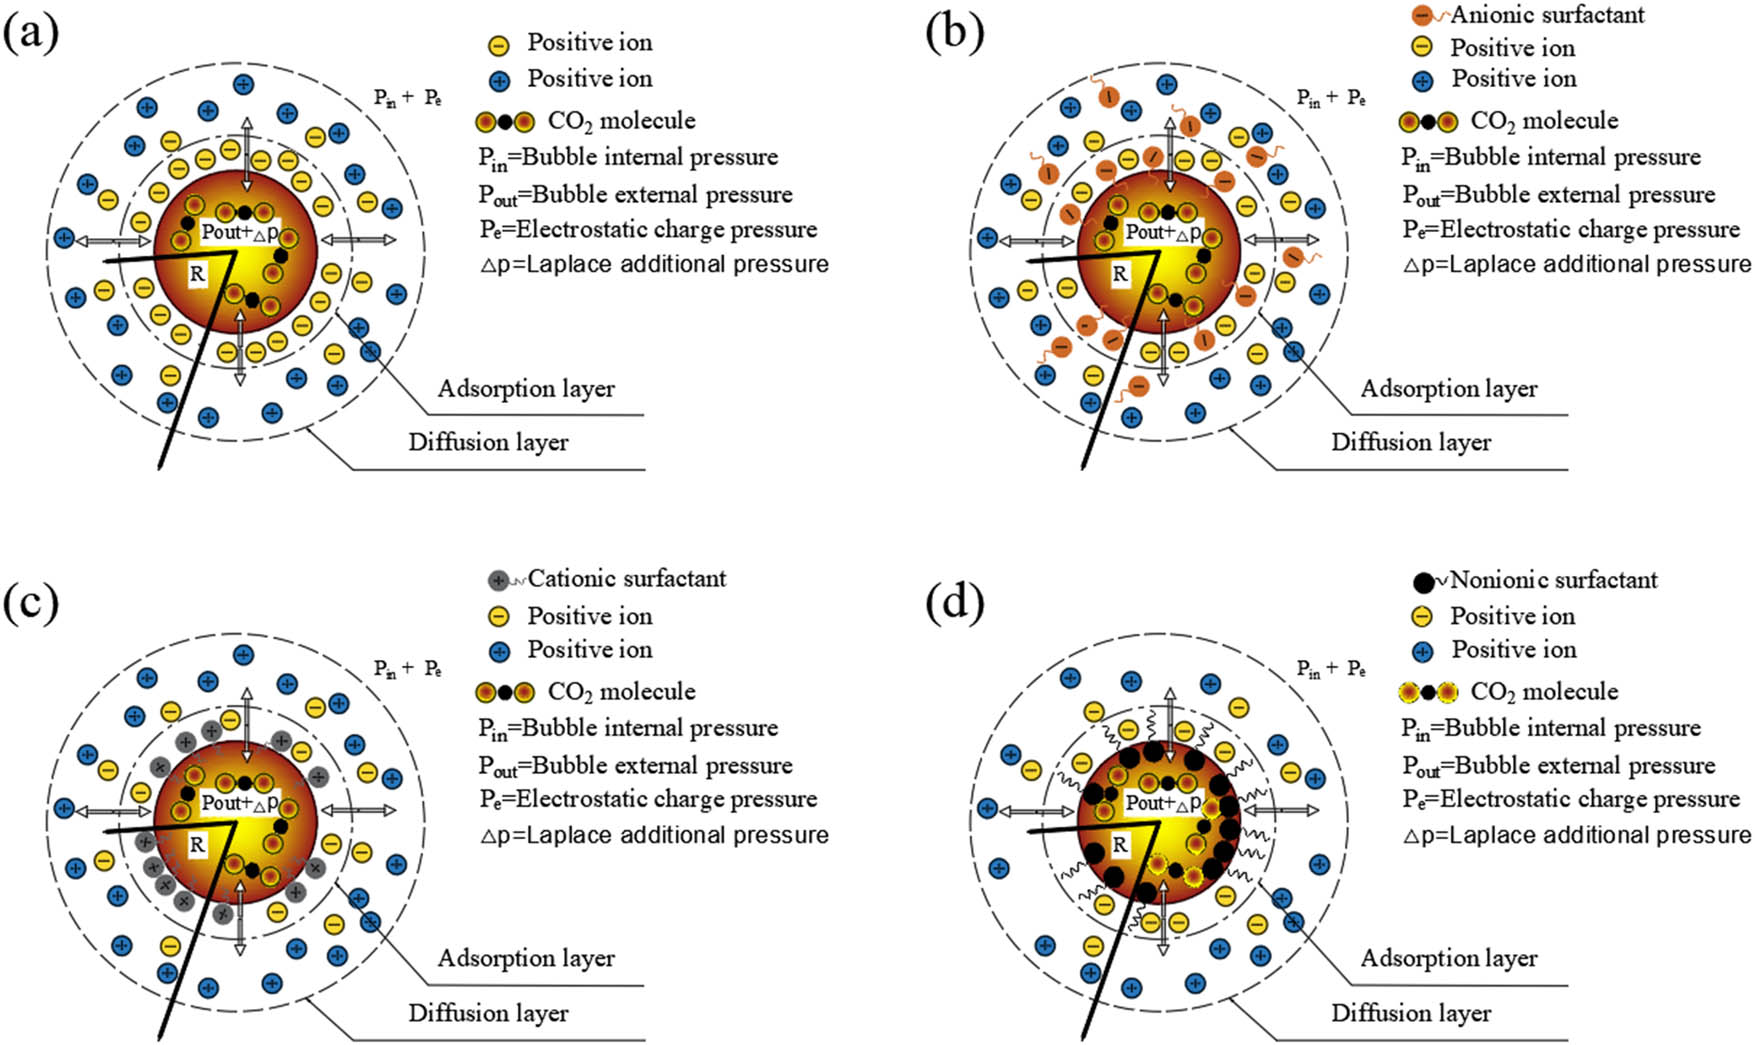
Figure 12
Schematic diagram of the mechanism by which ionic and nonionic surfactants stabilize CO2 nano bubbles. (a) Effect of AOS concentration; (b) effect of CATB concentration; (c) Effect of APG concentration; (d) effect of NP40 concentration.
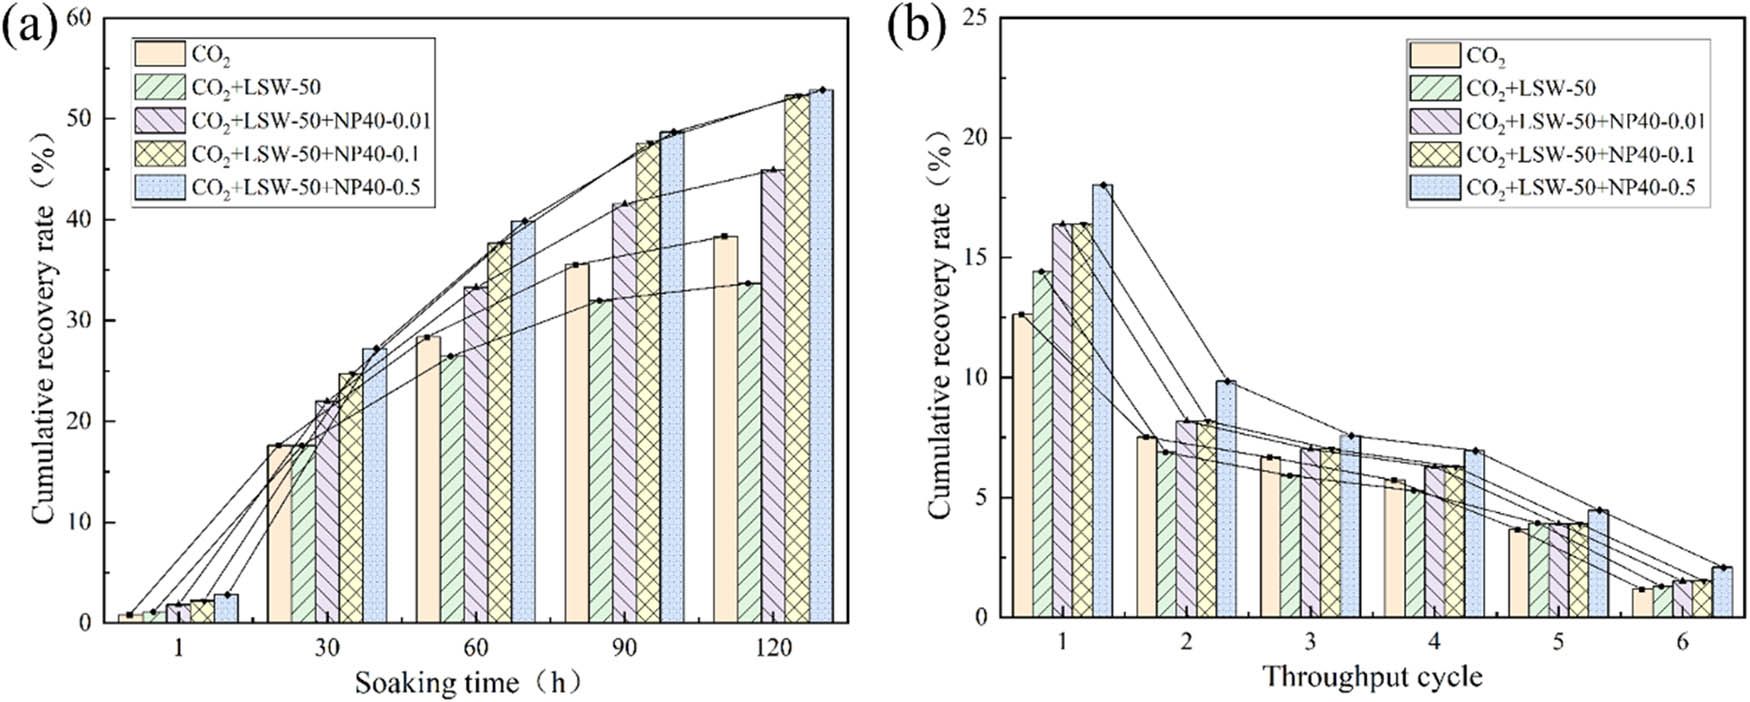
Figure 13
Oil recovery effect using CO2 and different CO2 micro-nano dispersion systems for huff and puff. (a) Effect of soaking time; (b) effect of throughput cycle.
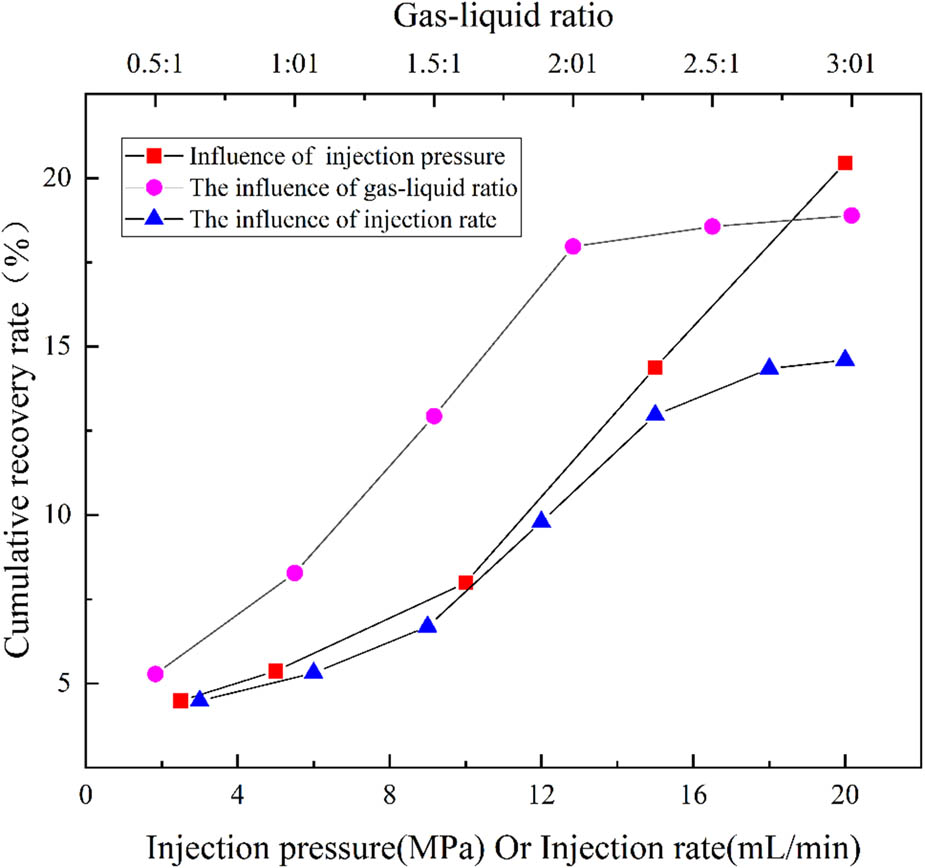
Figure 14
The influence of injection pressure, gas–liquid ratio, and injection rate on the effectiveness of huff and puff oil recovery.
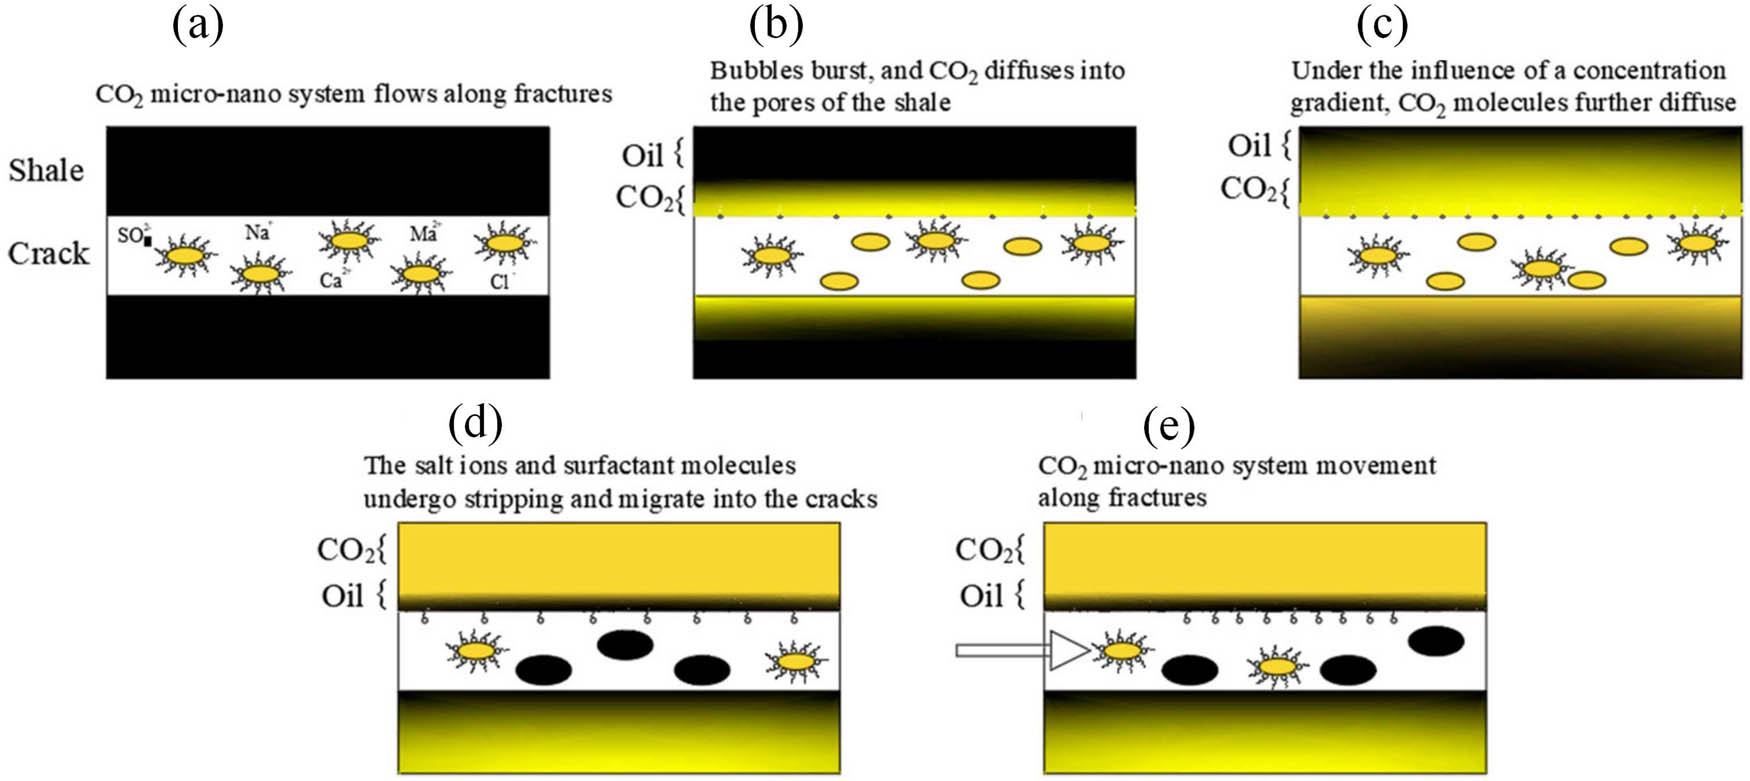
Figure 15
Schematic diagram of the CO2 micro-nano dispersed system stimulation process. (a) Dispersion injection; (b) soaking; (c) diffusion; (d) ion migration; (e) oil displacement.