
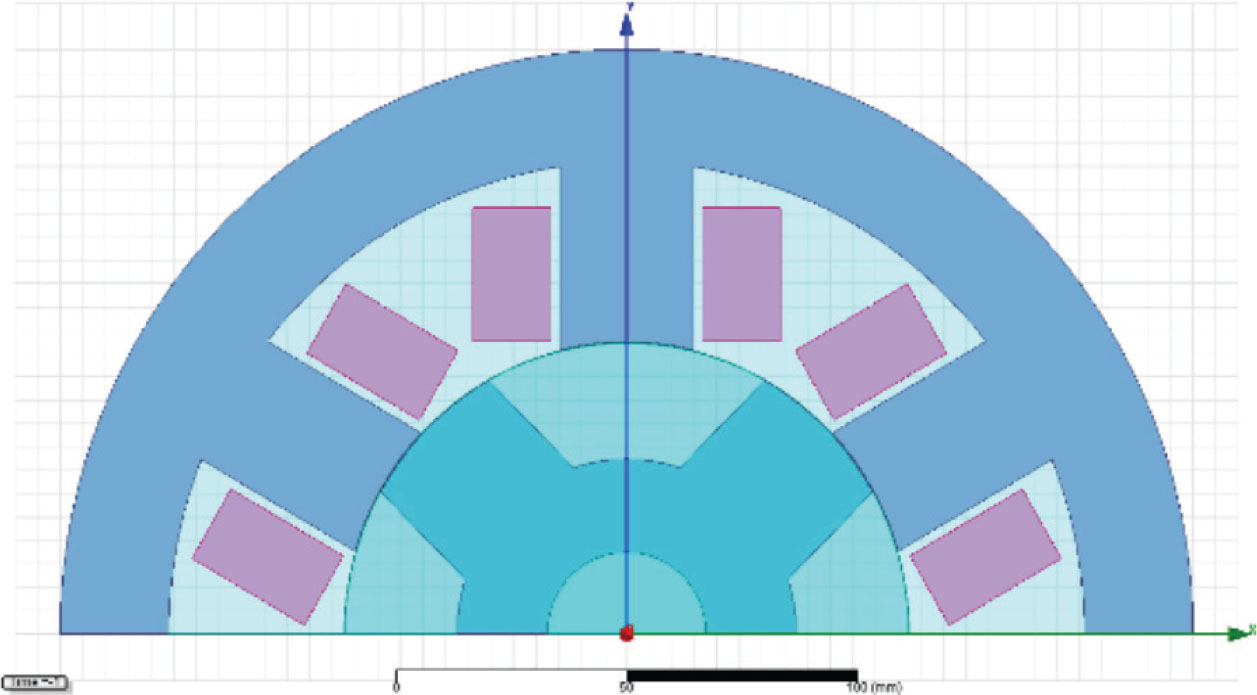
Figure 1.
The motor cross-section.
Table 1.
Ranges of parameter variation in optometric analysis.
| Parameter | Range of variation | Step |
|---|---|---|
| ML (mm) | 220–240 | 1 |
| WT (/) | 16–22 | 1 |
| EMBS (/) | 0.45–0.52 | 0.1 |
| EMBR (/) | 0.35–0.42 | 0.1 |
Table 2.
Comparison of M1 and SRKM-10T-15N.
| Parameter | M1 | SRKM-10T-15N |
|---|---|---|
| Power supply (V) | 400 | 400 |
| Rated current (A) | 22.7 | 16 |
| Rated speed (rpm) | 10,000 | 10,000 |
| Nominal torque (Nm) | 9.5 | 9.6 |
| Nominal power (kW) | 10 | 10 |
| Efficiency (%) | 93.09 | / |
Table 3.
Comparison of models M1, M2 and M3.
| Parameter | M1 | M2 | M3 |
|---|---|---|---|
| ML (mm) | 233 | 240 | 232 |
| WT (/) | 22 | 22 | 16 |
| EMBS (/) | 0.45 | 0.49 | 0.51 |
| EMBR (/) | 0.35 | 0.35 | 0.41 |
| Power supply (V) | 400 | 400 | 400 |
| Rated current (A) | 22.7 | 22.9 | 24.1 |
| Rated speed (rpm) | 10,000 | 8,303 | 10,000 |
| Nominal torque (Nm) | 9.5 | 11.49 | 9.5 |
| Nominal power (kW) | 9.95 | 9.99 | 10 |
| Winding resistance per phase (Ω) | 0.031 | 0.032 | 0.018 |
| Frictional and windage losses (W) | 12 | 9.94 | 12 |
| Iron core loss (W) | 611 | 592 | 1,104 |
| Winding copper loss (W) | 48 | 50 | 31 |
| Diode loss (W) | 7.4 | 8 | 9.5 |
| Transistor loss (W) | 60.8 | 61.6 | 65.3 |
| Total loss (W) | 739.5 | 721.1 | 1,222.2 |
| Input power (kW) | 10.7 | 10.7 | 11.2 |
| Efficiency (%) | 93.09 | 93.3 | 89.05 |
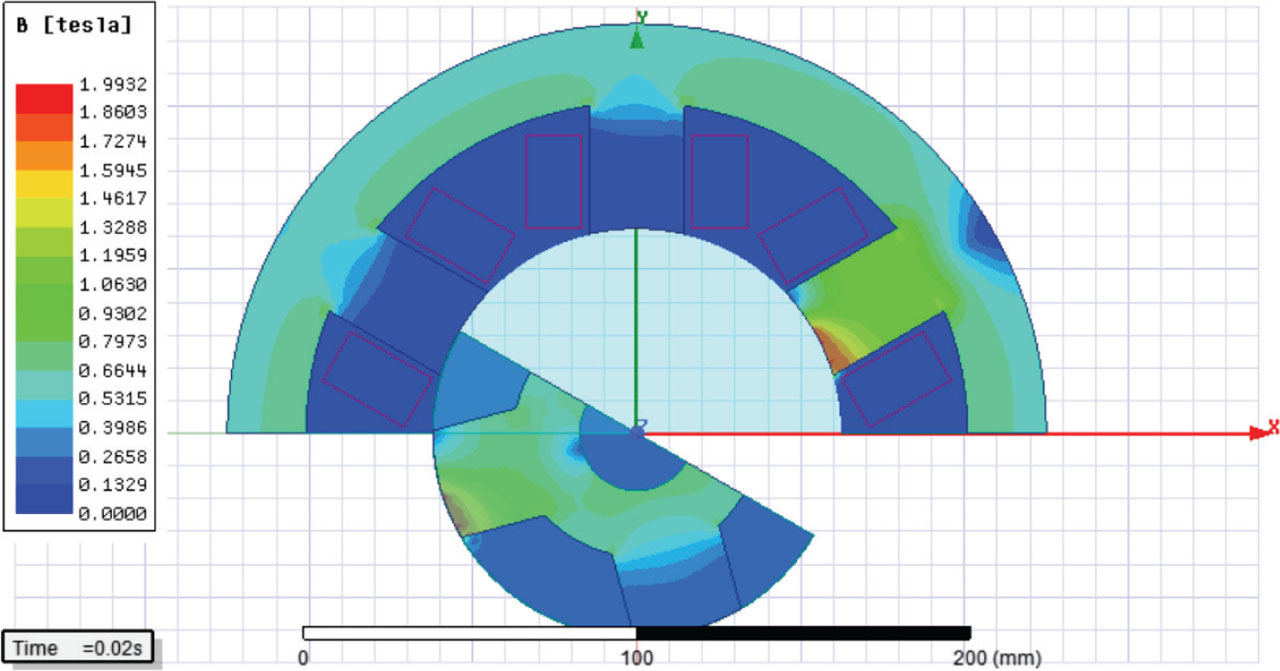
Figure 2.
The flux density distribution of model M1.
Table 4.
Ranges of parameter variation in GA analysis.
| Parameter | Range of variation |
|---|---|
| ML (mm) | 115–346 |
| WT (/) | 9–26 |
| EMBS (/) | 0.25–0.75 |
| EMBR (/) | 0.2–0.55 |
Table 5.
Model GA-M from GA optimisation.
| Parameter | GA-M |
|---|---|
| ML (mm) | 328.7 |
| WT (/) | 24.6 |
| EMBS (/) | 0.395 |
| EMBR (/) | 0.358 |
| Power supply (V) | 400 |
| Rated current (A) | 22.4 |
| Rated speed (rpm) | 7,134 |
| Nominal torque (Nm) | 13.35 |
| Nominal power (kW) | 10 |
| Efficiency (%) | 94.9 |
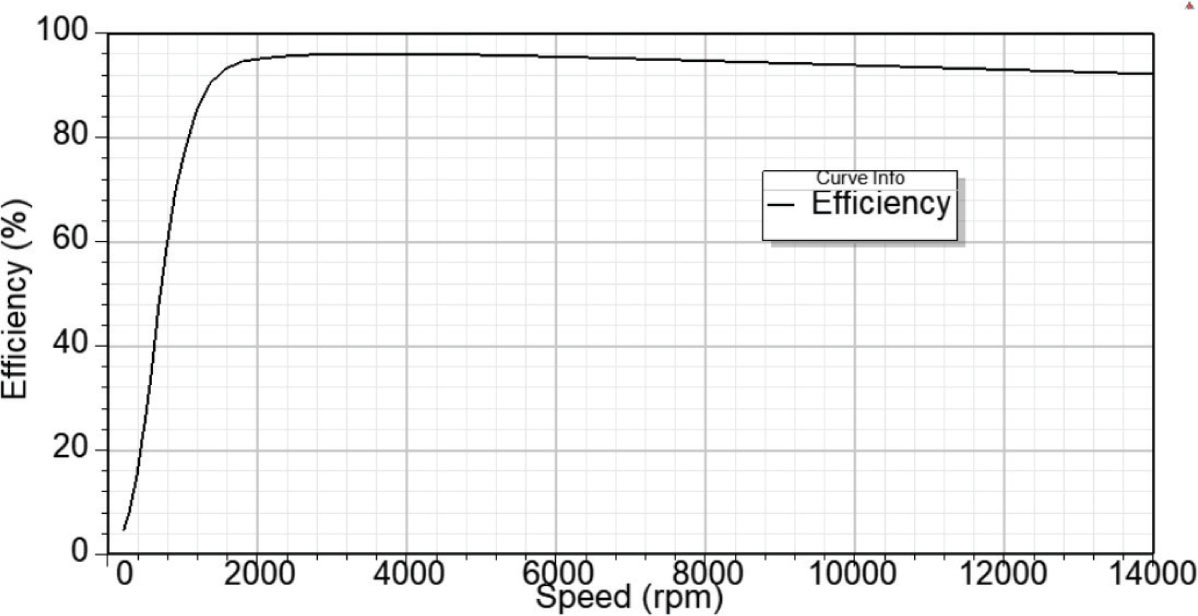
Figure 3.
Efficiency of model GA-M.
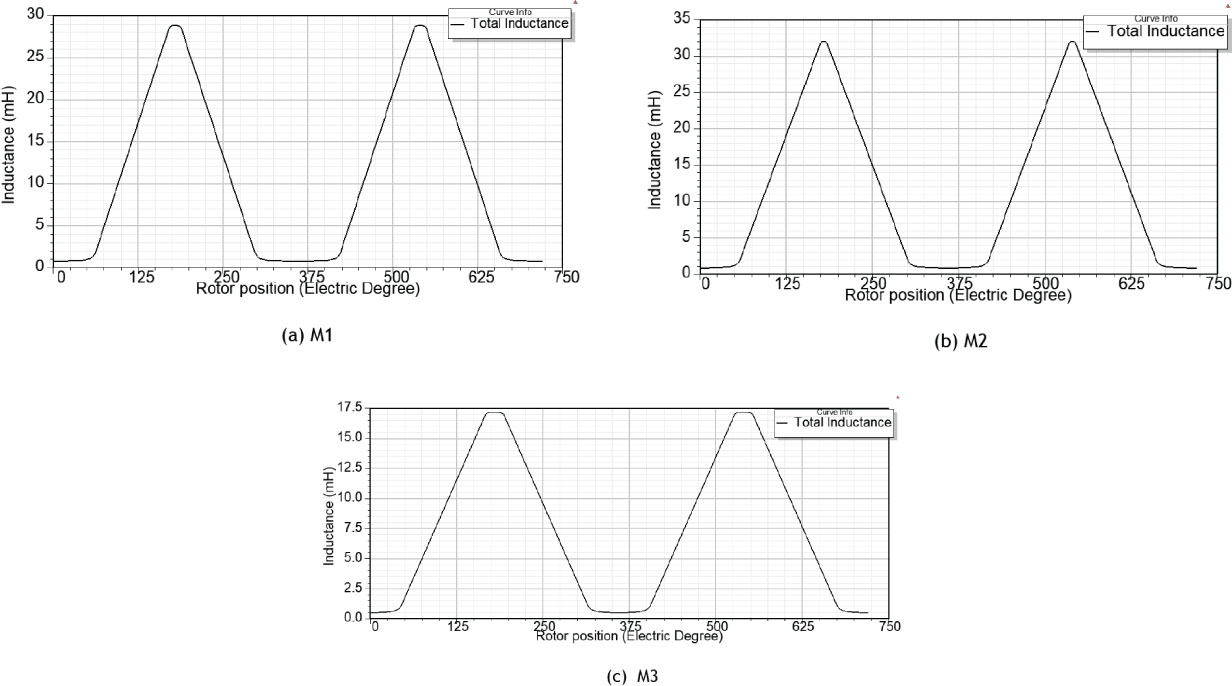
Figure 4.
Inductance profiles of models M1 to M3.
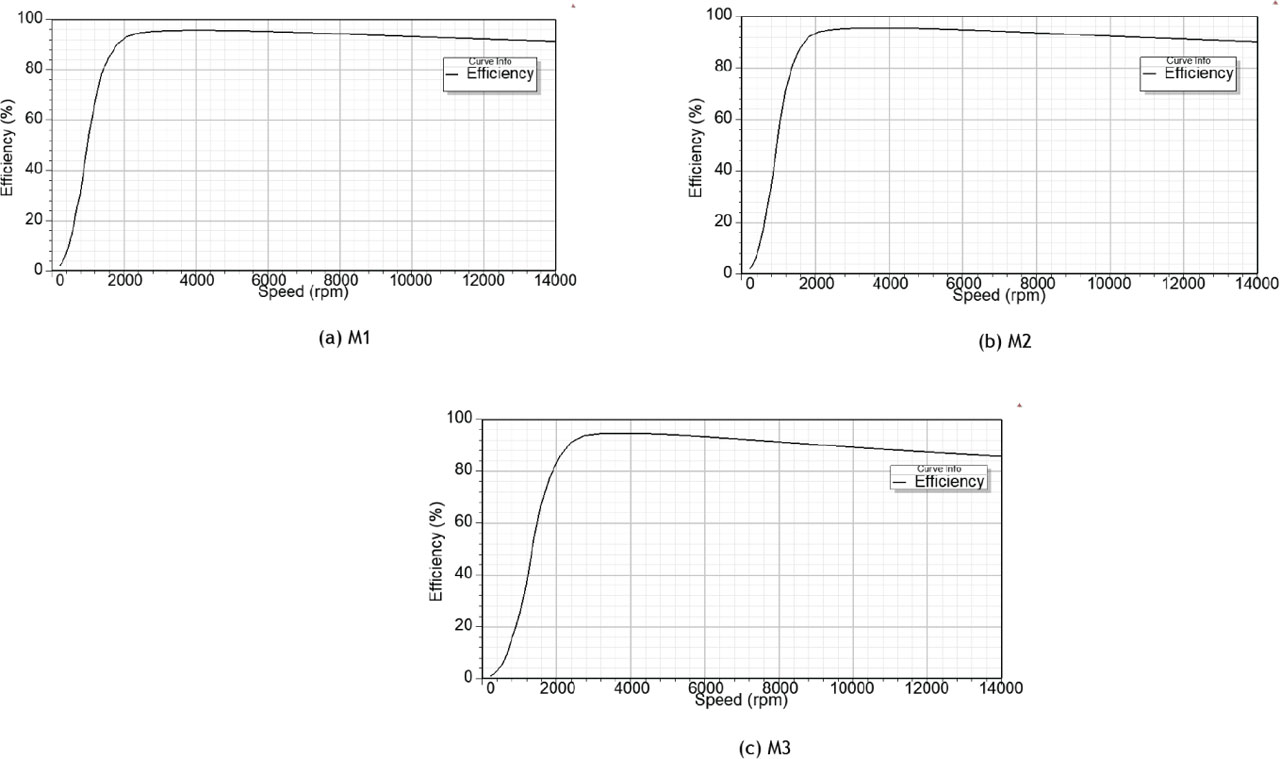
Figure 5.
Efficiency of models M1 to M3.
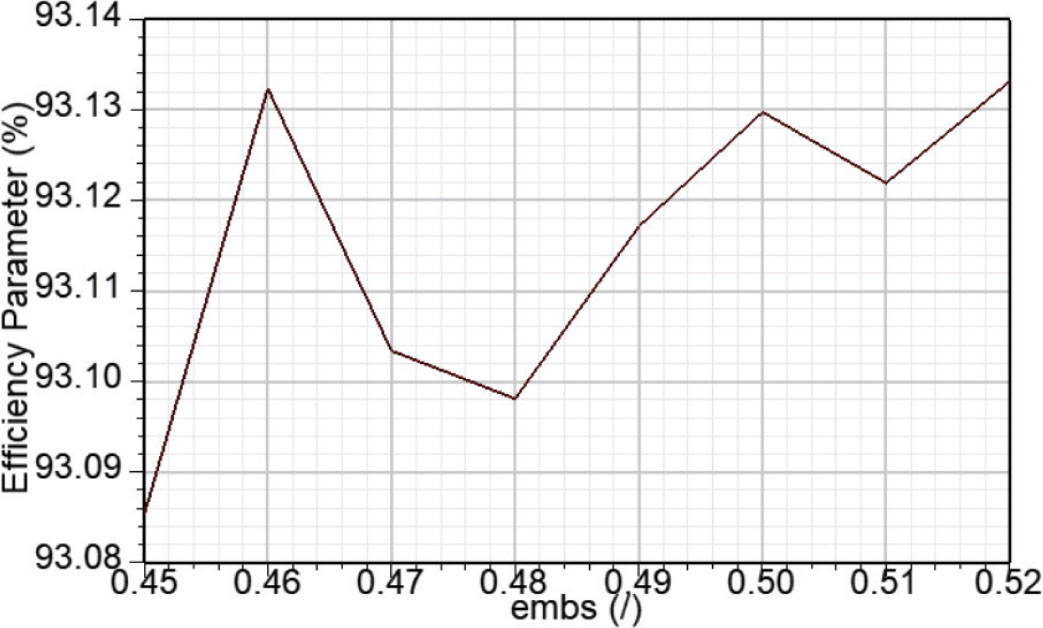
Figure 6.
Impact of EMBS on efficiency. EMBS, stator pole embrace.
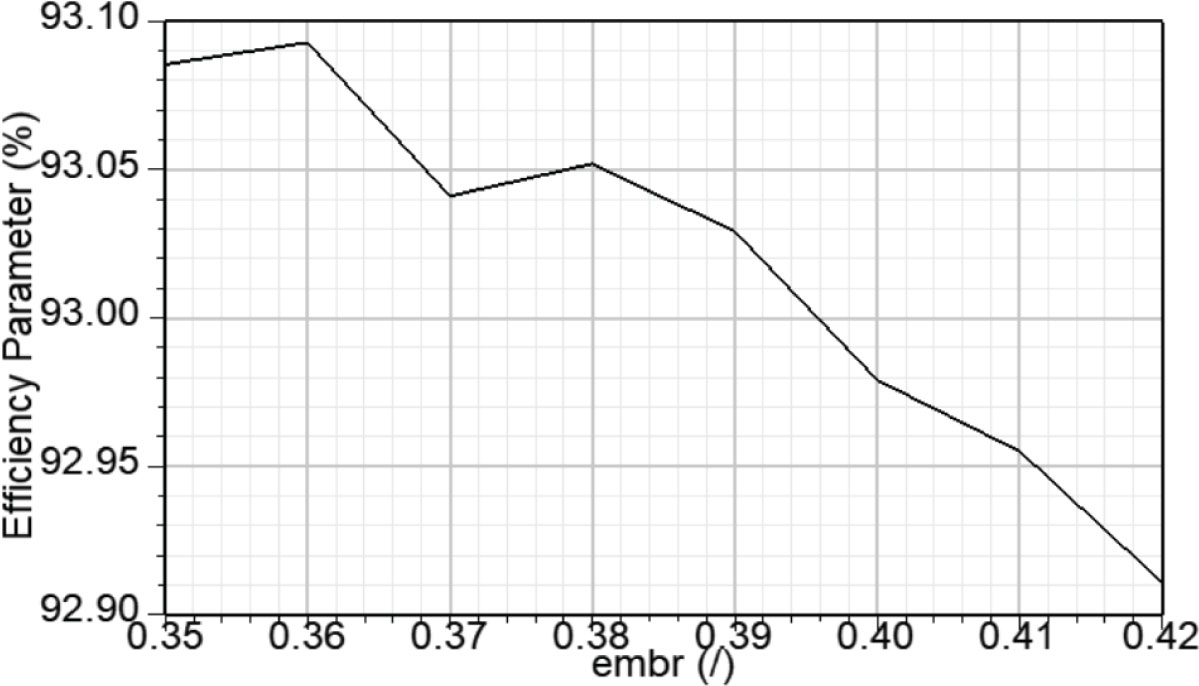
Figure 7.
Impact of EMBR on efficiency. EMBR, rotor pole embrace.
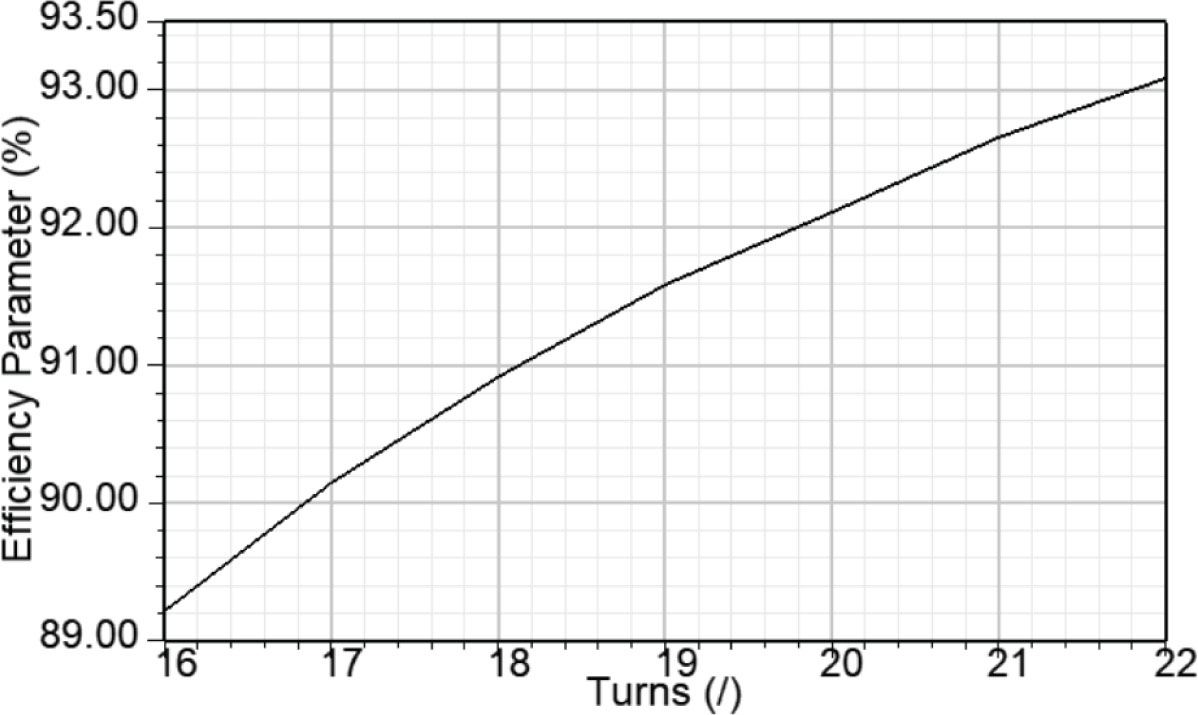
Figure 8.
Impact of winding turns on efficiency.
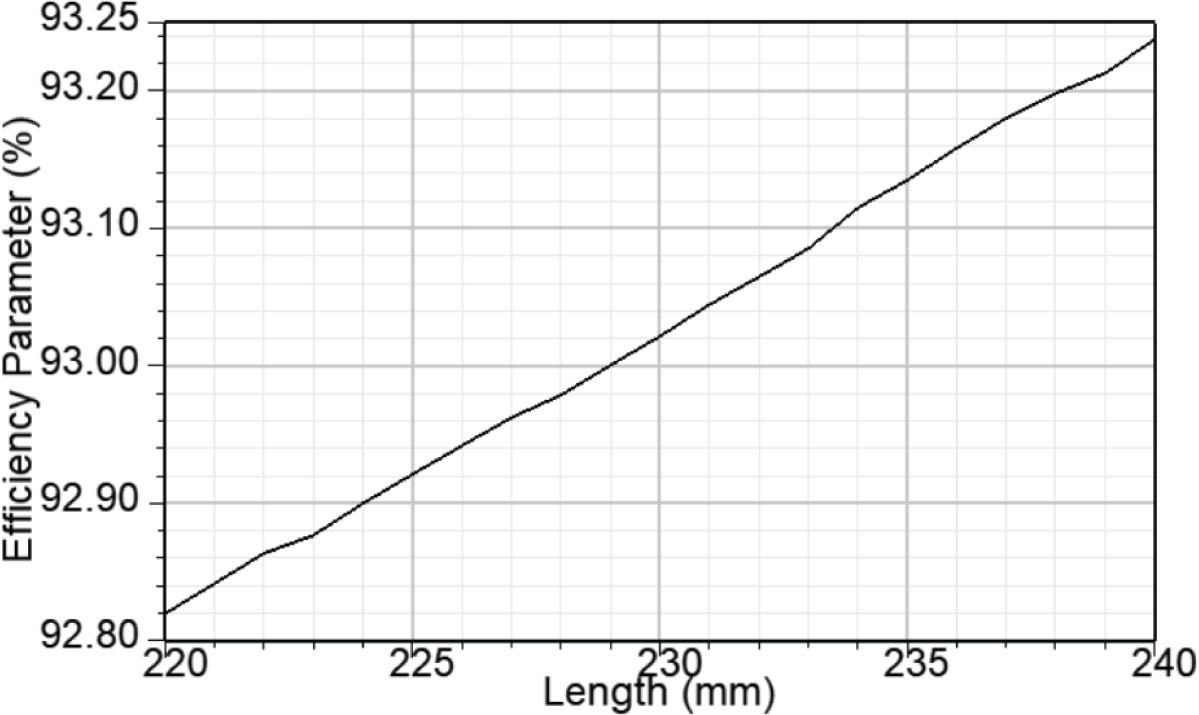
Figure 9.
Impact of ML on efficiency. ML, machine length.
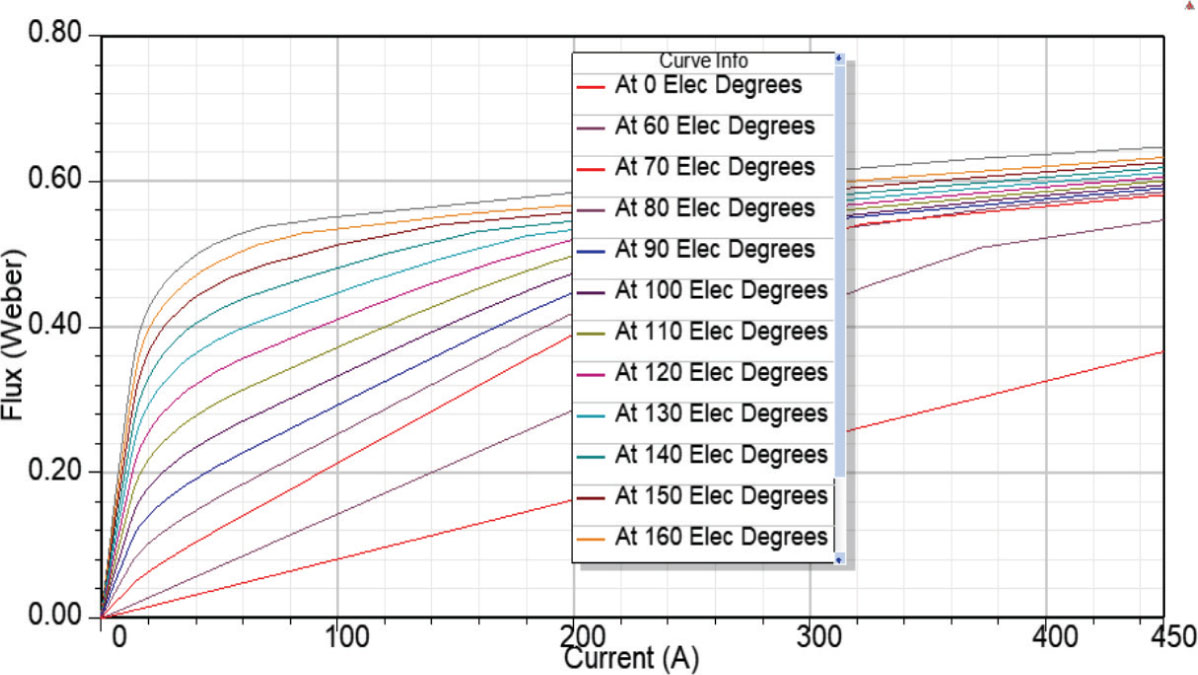
Figure 10.
Magnetisation characteristics of M1.
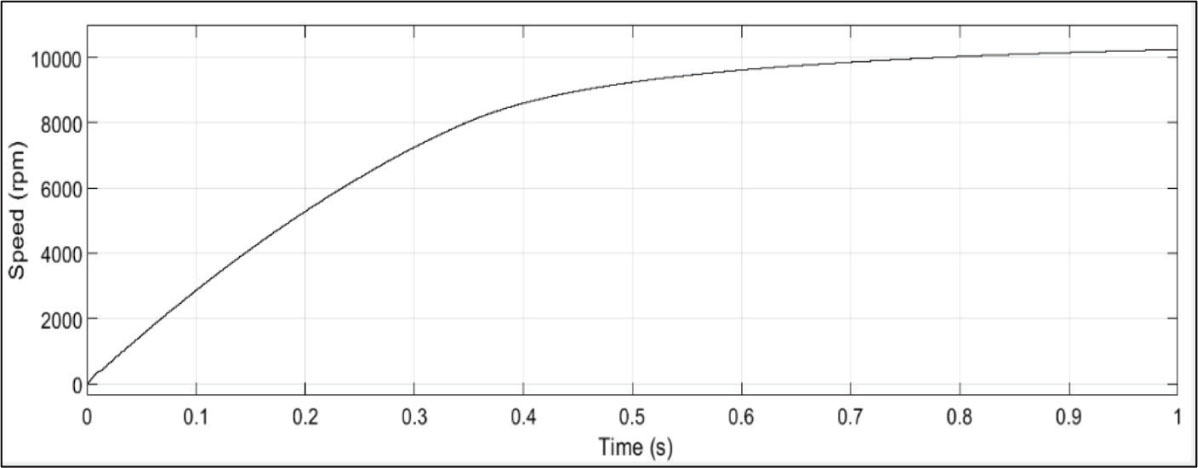
Figure 11.
Transient characteristic of speed.
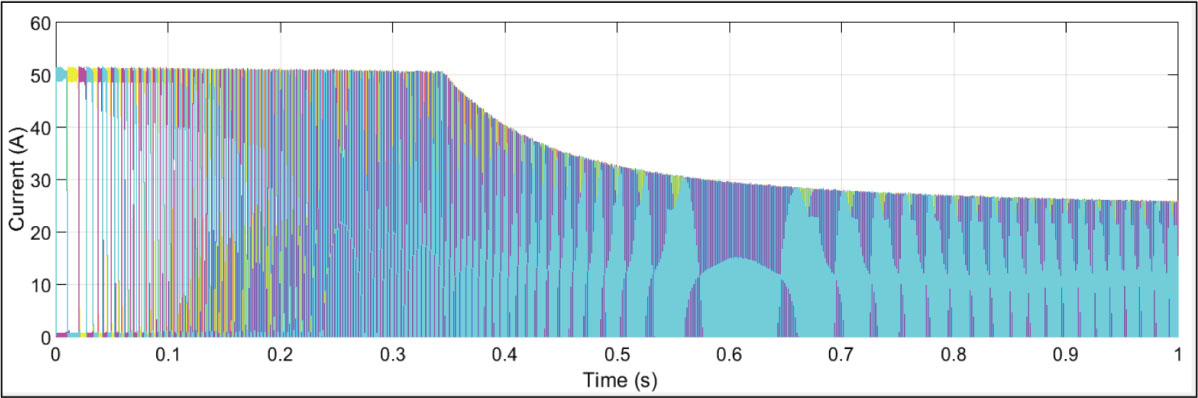
Figure 12.
Transient characteristic of currents.
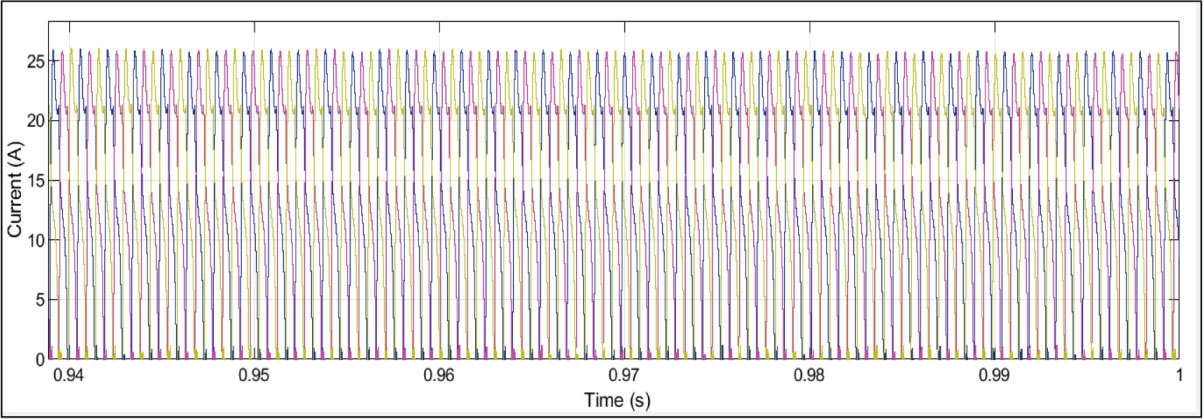
Figure 13.
Enlarged detail of currents.
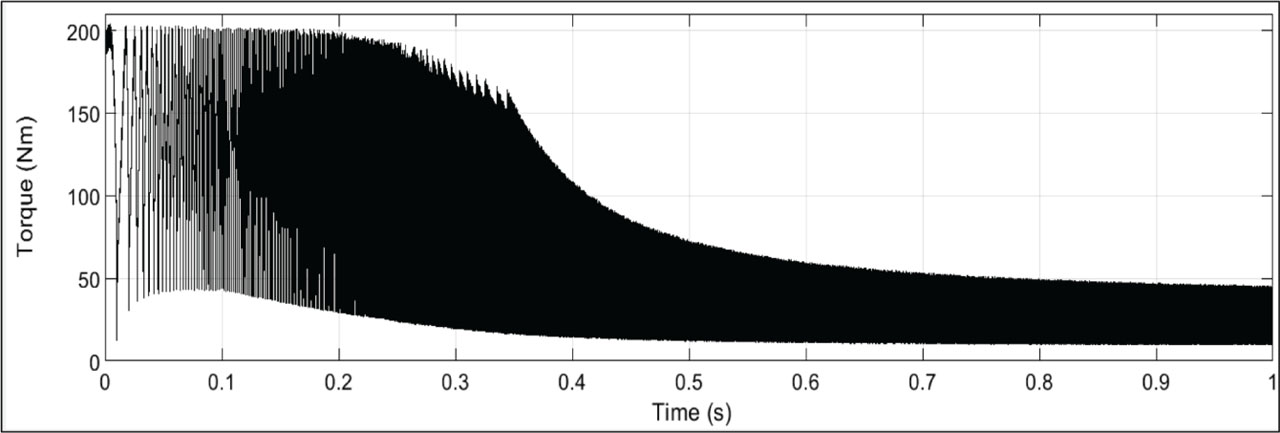
Figure 14.
Transient characteristic of torque.
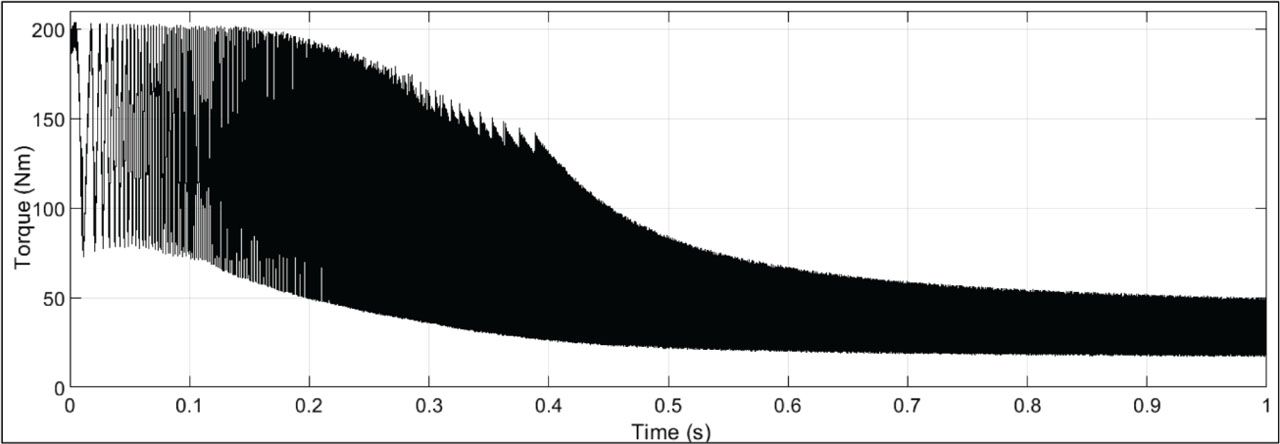
Figure 15.
Transient characteristic of torque with increased dwell angle of control circuit.
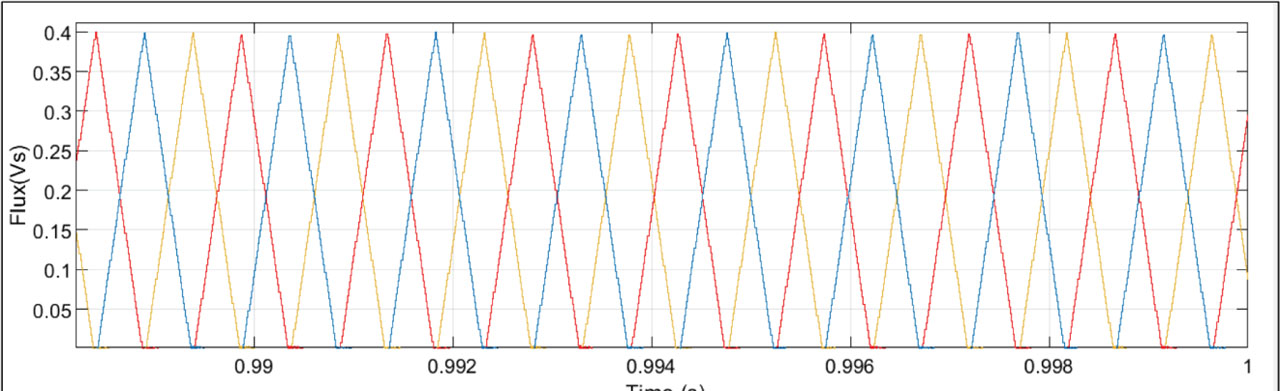
Figure 16.
Enlarged detail view of flux in phase windings.