
Table 1.
Literature review.
| Reference | Microgrid energy sources | Method | Objective | Real-world data | Comparative study | Economic analysis |
|---|---|---|---|---|---|---|
| Soliman et al. (2021) | PV + wind + tidal sources + battery | FSHSMC is a combined FLC and HSMC | Energy management control technique for a smart DC-microgrid | × | ✓ | × |
| Albarakati et al. (2021) | PV + wind + battery | MPPT + multi-agent system MAS | Maintain the power balance in the microgrid | × | ✓ | × |
| Lami et al. (2025) | PV + wind + battery | DRL and neural networks | Real-time energy optimisation, demand forecasting, and P2P trading optimise energy consumption, predict demand, and facilitate P2P energy trading. | ✓ | ✓ | ✓ |
| Moazzen and Hossain (2024) | PV + wind + battery + grid | LSTMs | Optimise distribution, reduce grid dependence, and maximise renewables | ✓ | ✓ | ✓ |
| Sun et al. (2025) | Wind + heat + gas + hydrogen | BiTCN | Minimise the overall operational cost, including transaction costs, fuel costs, and maintenance expenses. Improving renewable energy utilisation and system reliability | ✓ | × | ✓ |
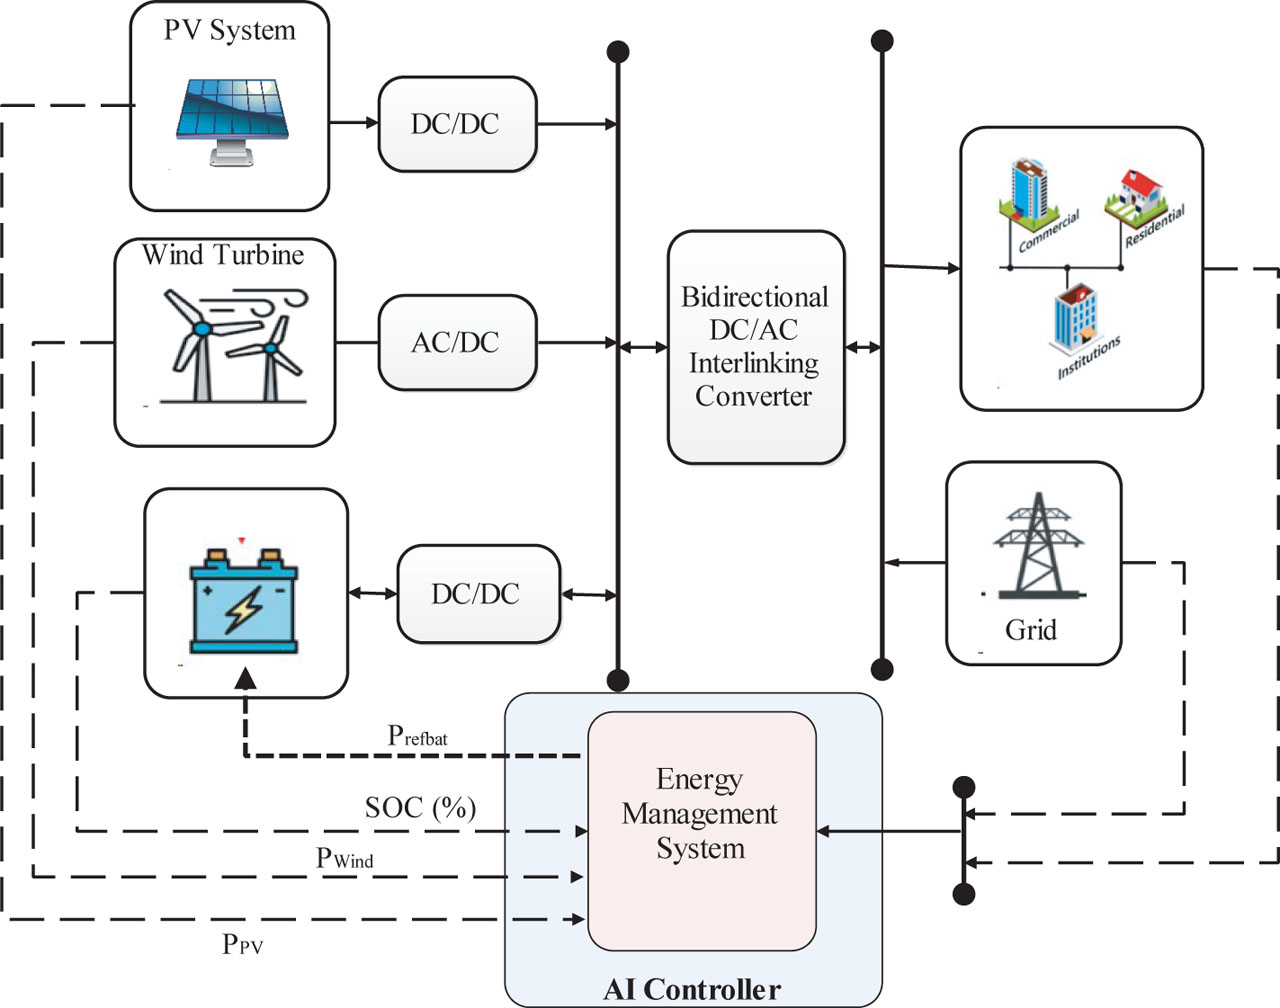
Figure 1.
Smart microgrid system with AI-based controller. AI, artificial intelligence; SOC, state of charge.
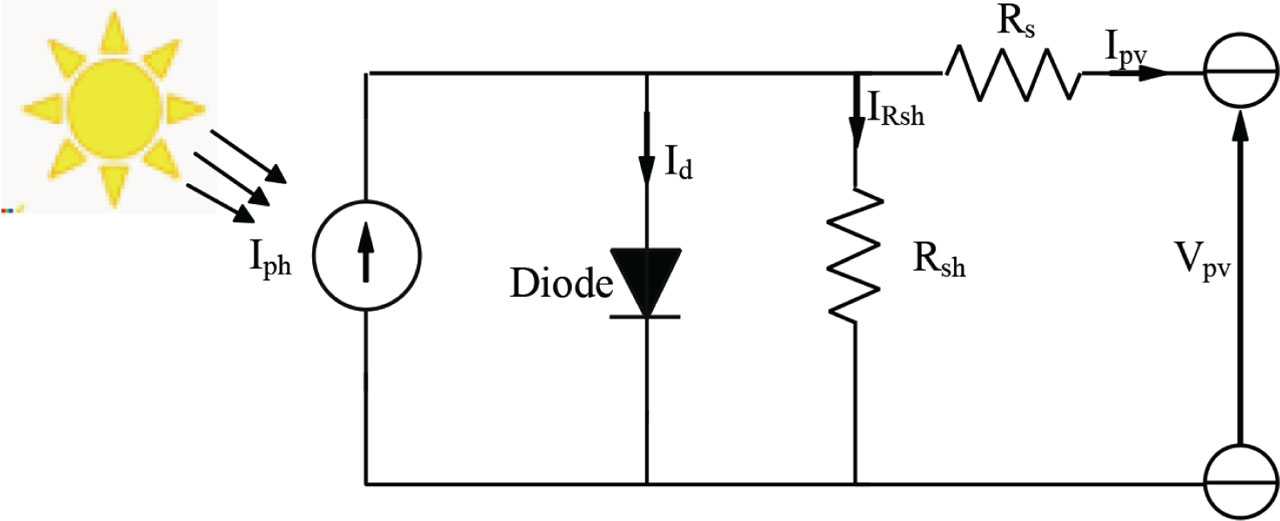
Figure 2.
The equivalent electrical circuit of photovoltaic (PV).
Table 2.
PV module parameters.
| Parameter | Value |
|---|---|
| Light-generated current | 10.0926 A |
| Diode saturation current | 3.323 × 10⁻¹¹ A |
| Shunt resistance | 212.8143 Ω |
| Series resistances | 0.31448 Ω |
| Maximum power | 302.2 W |
| Cell per module | 60 |
| Short-circuit current | 10.05 A |
| Open circuit voltage | 32.5V |
Table 3.
PMSG and wind turbine electrical and mechanical parameters.
| Parameter | Value |
|---|---|
| Number of pole pairs | 4 pairs |
| Permanent magnet flux linkage | 0.1688 Wb |
| Stator Resistance Rs | 0.0918 Ω |
| Rotor Inertia J | 0.003945 Kg m2 |
| Viscous damping coefficient B | 0.0004924 N m s |
| Back-EMF waveform | Sinusoidal |
| Rotor type | Round |
| Rated mechanical power | 10 KW |
| Rated wind speed | 12 m/s |
| Maximum power coefficient | 0.48 |
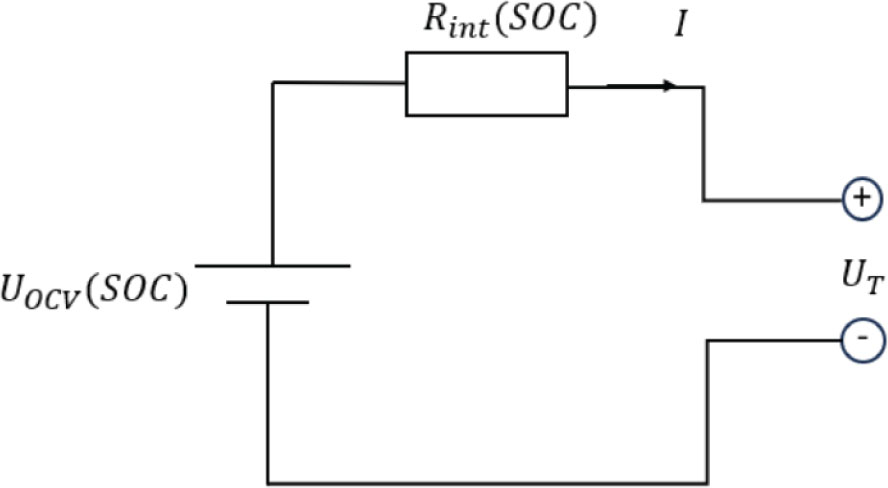
Figure 3.
Lithium-ion equivalent circuit model. SOC, state of charge.
Table 4.
Battery electrical parameters.
| Parameter | Value |
|---|---|
| Battery type | Lithium-ion |
| Nominal voltage | 200V |
| Rated capacity | 50 Ah |
| Internal resistance | 0.04 Ω |
| Capacity at nominal voltage | 45.2174 Ah |
| Fully charged voltage | 232.7974V |
| Cut-off voltage | 150V |
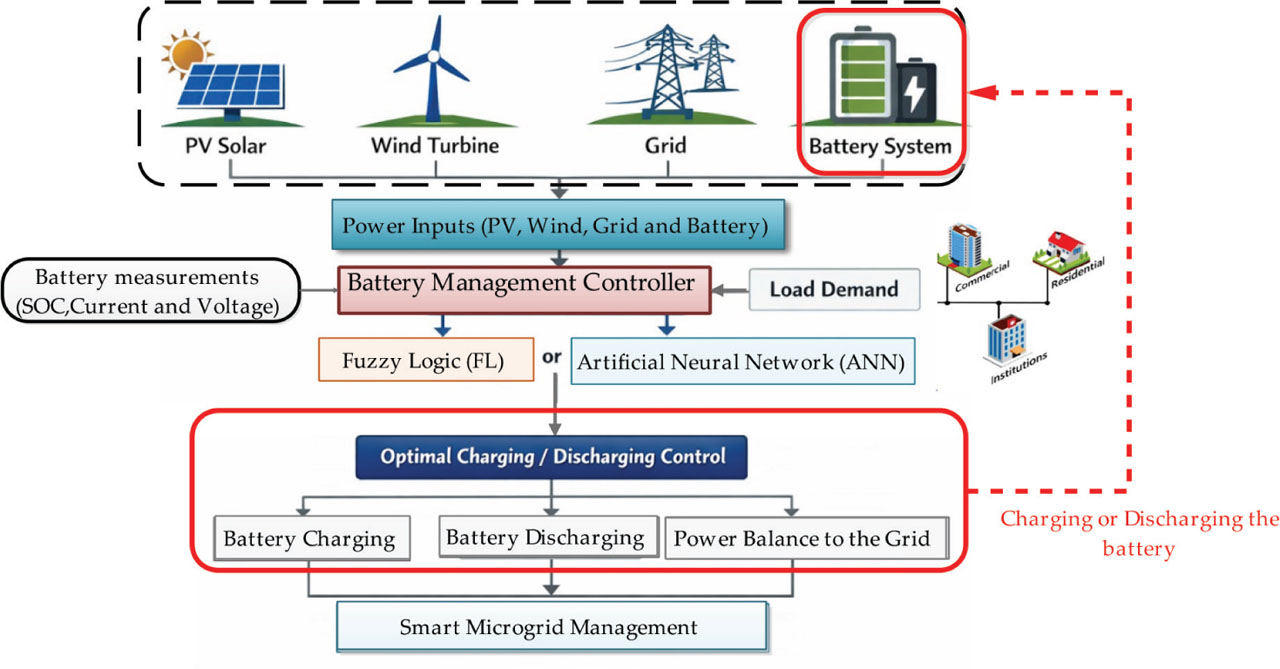
Figure 4.
Block diagram of the AI-based BMS. AI, artificial intelligence; ANN, artificial neural network; BMS, battery management system; FL, fuzzy logic; SOC, state of charge.
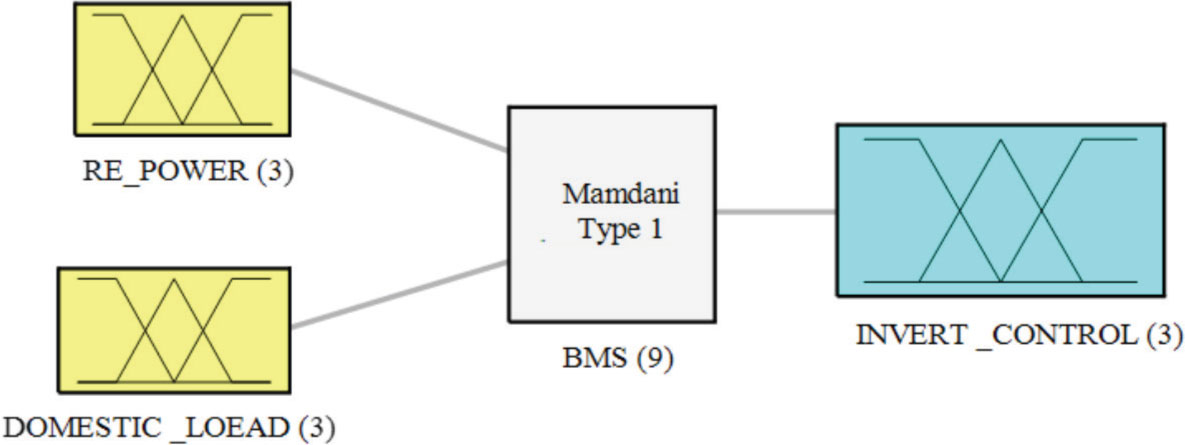
Figure 5.
FL control design. BMS, battery management system; FL, fuzzy logic.
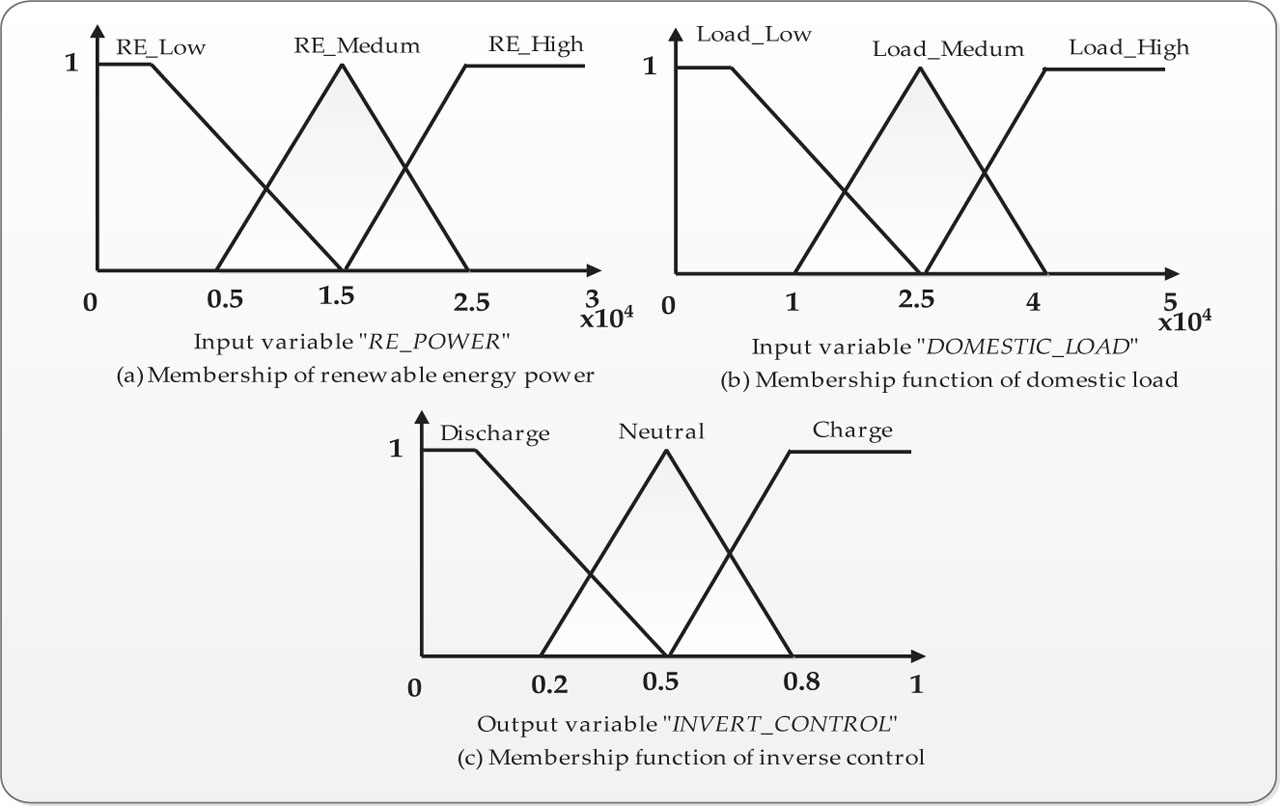
Figure 6.
Distribution of membership functions defined for both the input and output parameters. (a) Membership of renewable energy power. (b) Membership function of domestic load. (c) Membership function of inverse control.
Table 5.
FL rules configuration.
| Rule | Input 1: Renewable energy power | Input 2: Domestic load demand | Output: Inverter control |
|---|---|---|---|
| 1 | Low | Low | Neutral |
| 2 | Low | Medium | Discharge |
| 3 | Low | High | Discharge |
| 4 | Medium | Low | Charge |
| 5 | Medium | Medium | Neutral |
| 6 | Medium | High | Discharge |
| 7 | High | Low | Charge |
| 8 | High | Medium | Charge |
| 9 | High | High | Neutral |
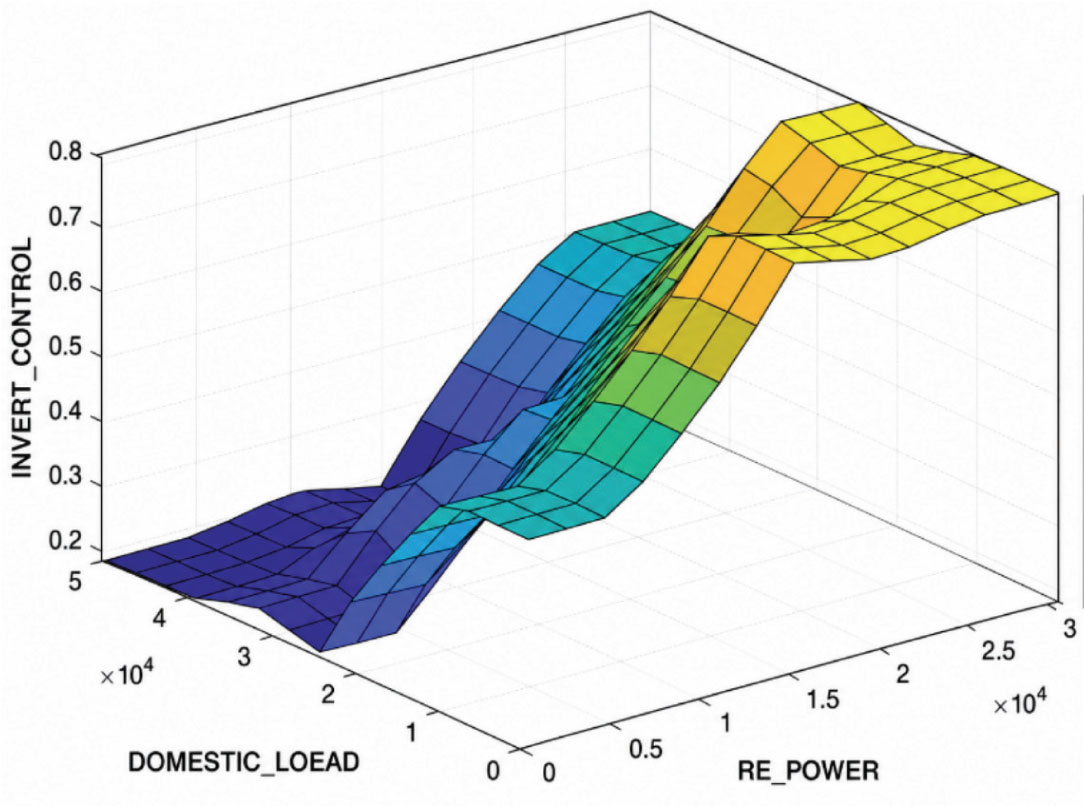
Figure 7.
3D FL surface. FL, fuzzy logic.
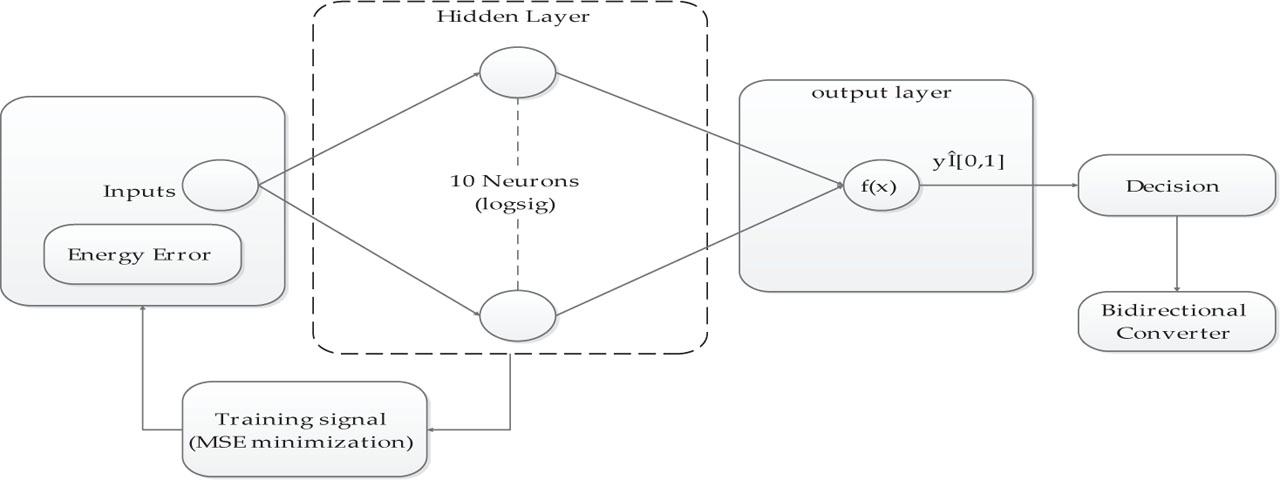
Figure 8.
Proposed ANN architecture. ANN, artificial neural network.
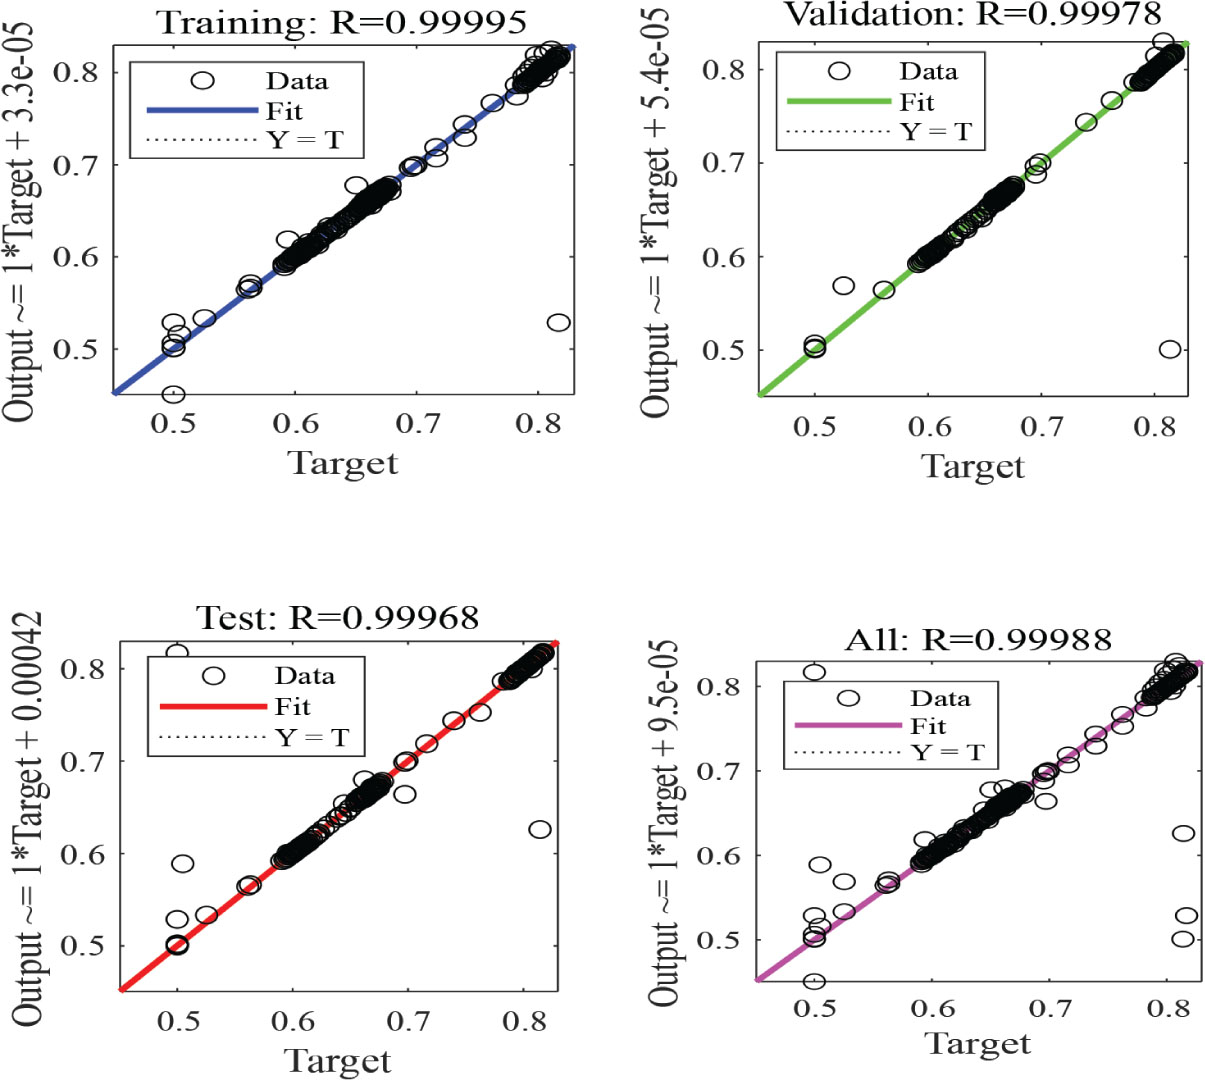
Figure 9.
ANN training regression. ANN, artificial neural network.
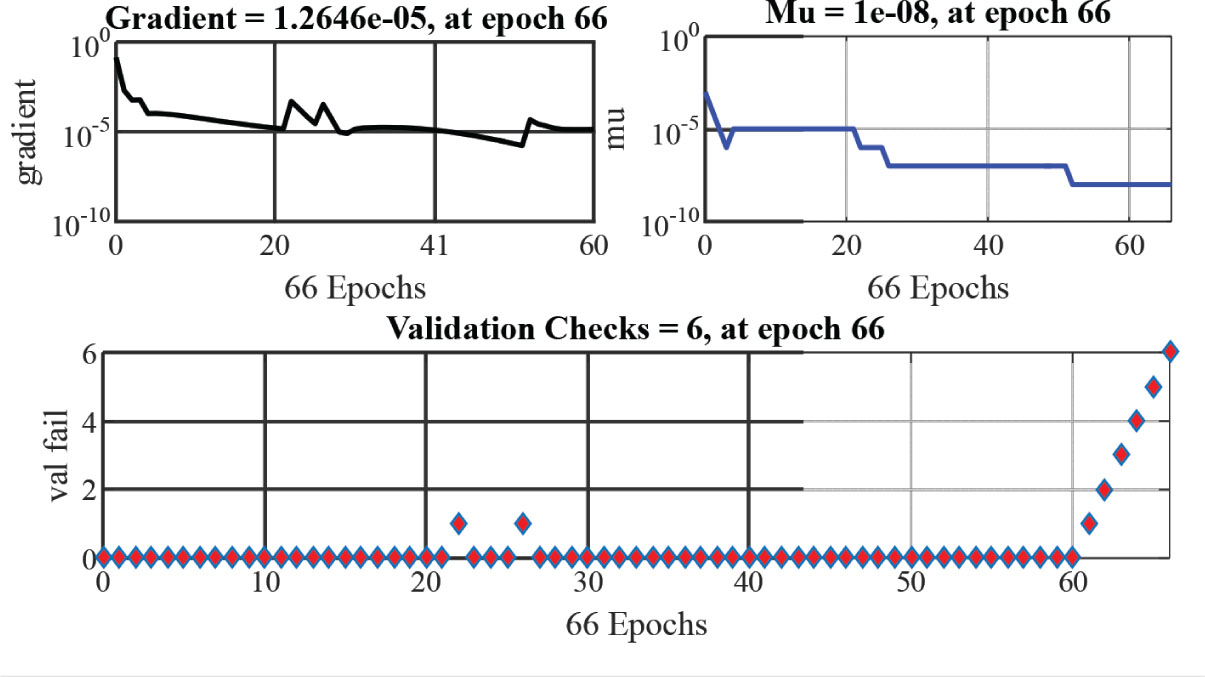
Figure 10.
ANN training state. ANN, artificial neural network.
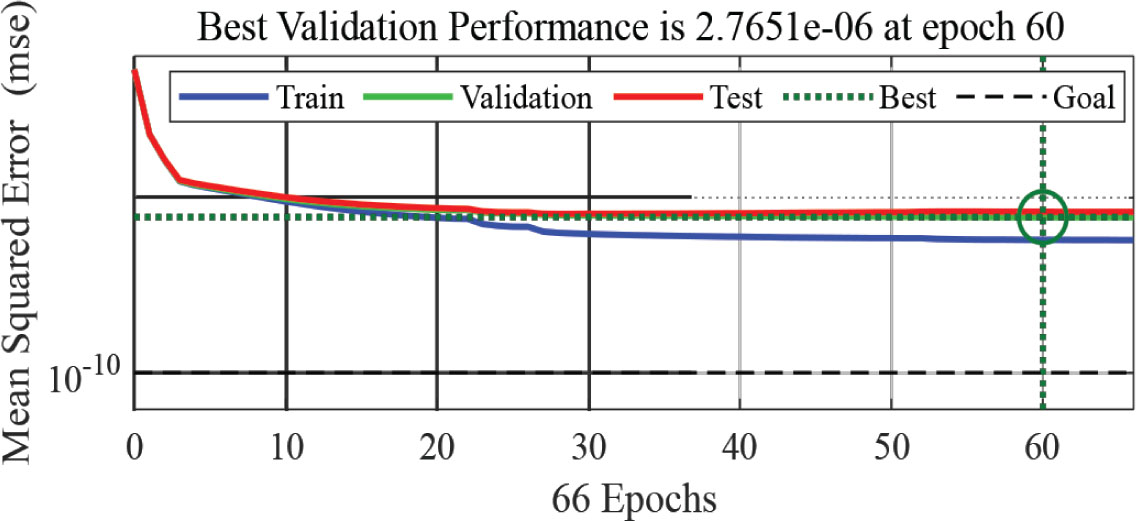
Figure 11.
ANN training performance. ANN, artificial neural network.
Table 6.
ANN parameters.
| Parameter | Value |
|---|---|
| Input | 1 (energy error) |
| Output | 1 (battery charge/discharge command) |
| Target generation method | Supervised learning based on the desired battery power management response derived from the microgrid energy balance conditions |
| Layer size | 10 |
| Dataset | 2,000 |
| Training algorithm | Backpropagation |
| Training | 70% |
| validation | 15% |
| Test split | 15% |
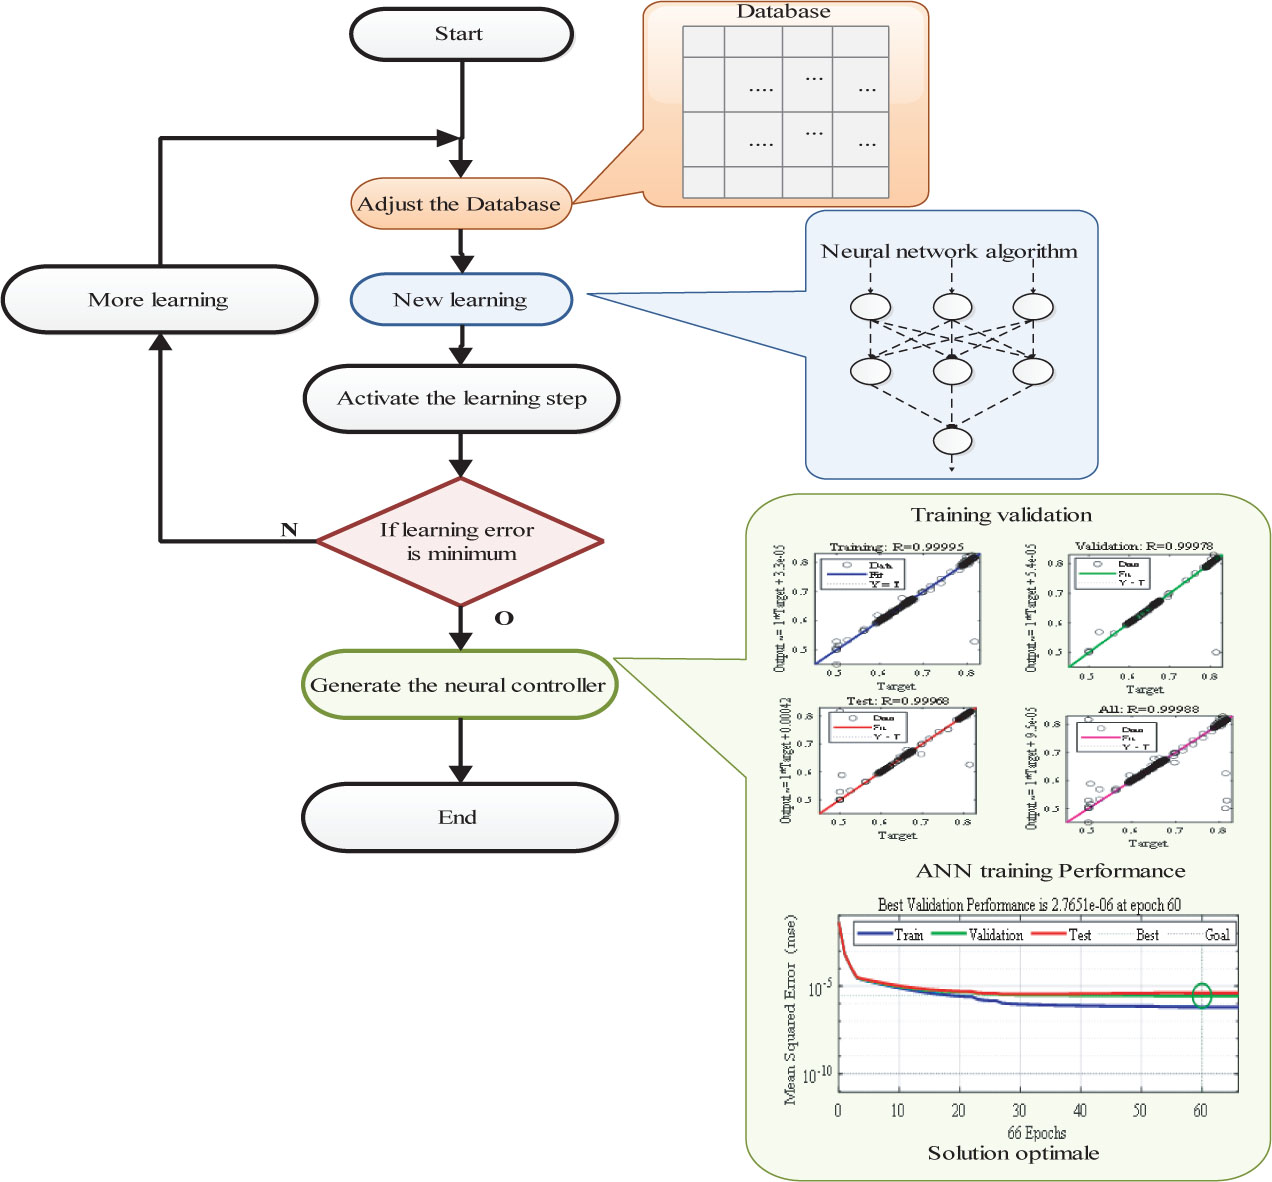
Figure 12.
Key stages involved in developing and deploying a neural network controller.
Table 7.
Global system parameters.
| Component | Parameter | Value |
|---|---|---|
| PV system | Power | 40 KW |
| Voltage | 192V | |
| Current | 198.66 A | |
| Number of modules | 222 | |
| Wind system | Power | 10 KW |
| Battery | Voltage | 155V |
| Nominal capacity | 130 Ah | |
| Load | Nominal power | 20 KW |
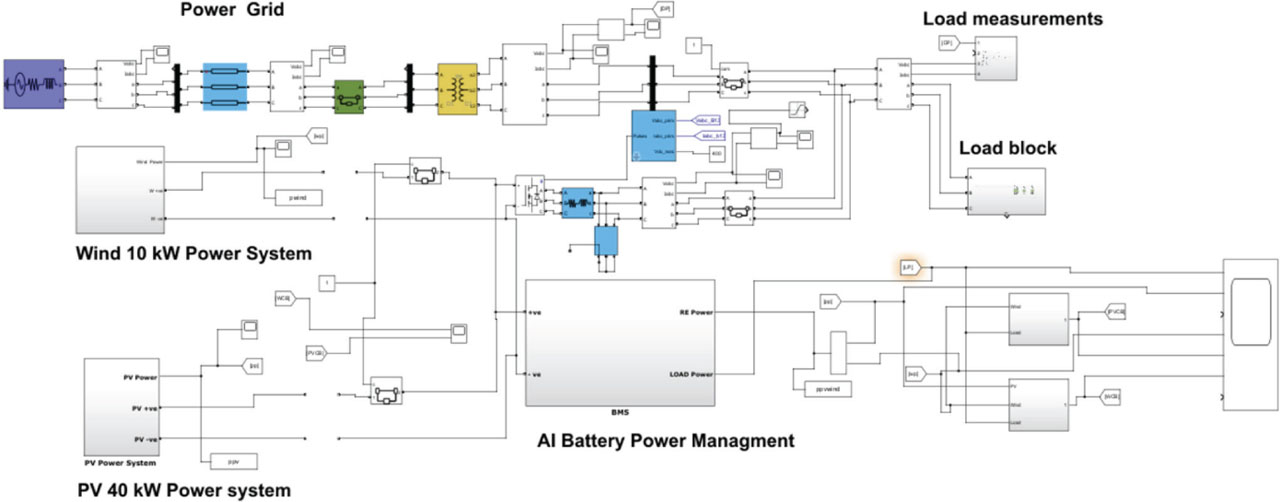
Figure 13.
Global proposed microgrid MATLAB/Simulink model.
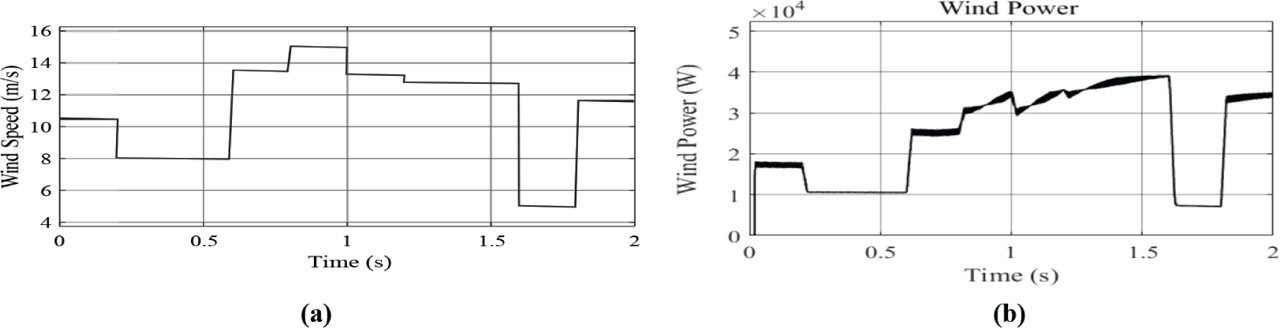
Figure 14.
Wind power for different wind speeds. (a) Wind speed. (b) Wind power.
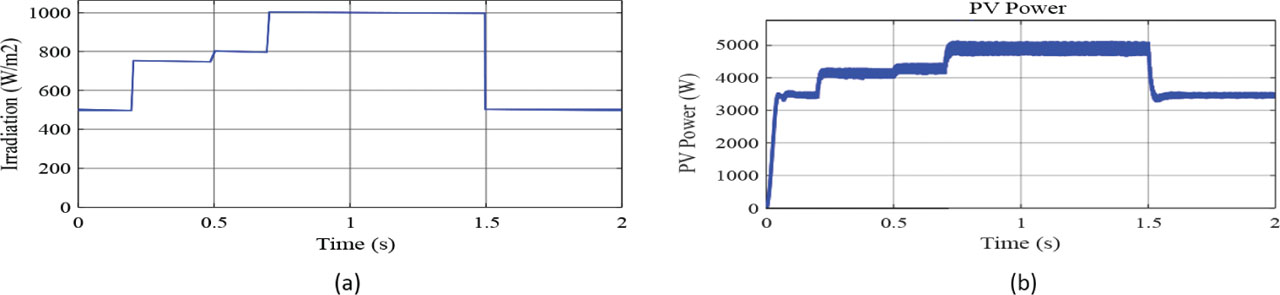
Figure 15.
PV power for different solar irradiance. (a) Solar irradiance. (b) PV power.
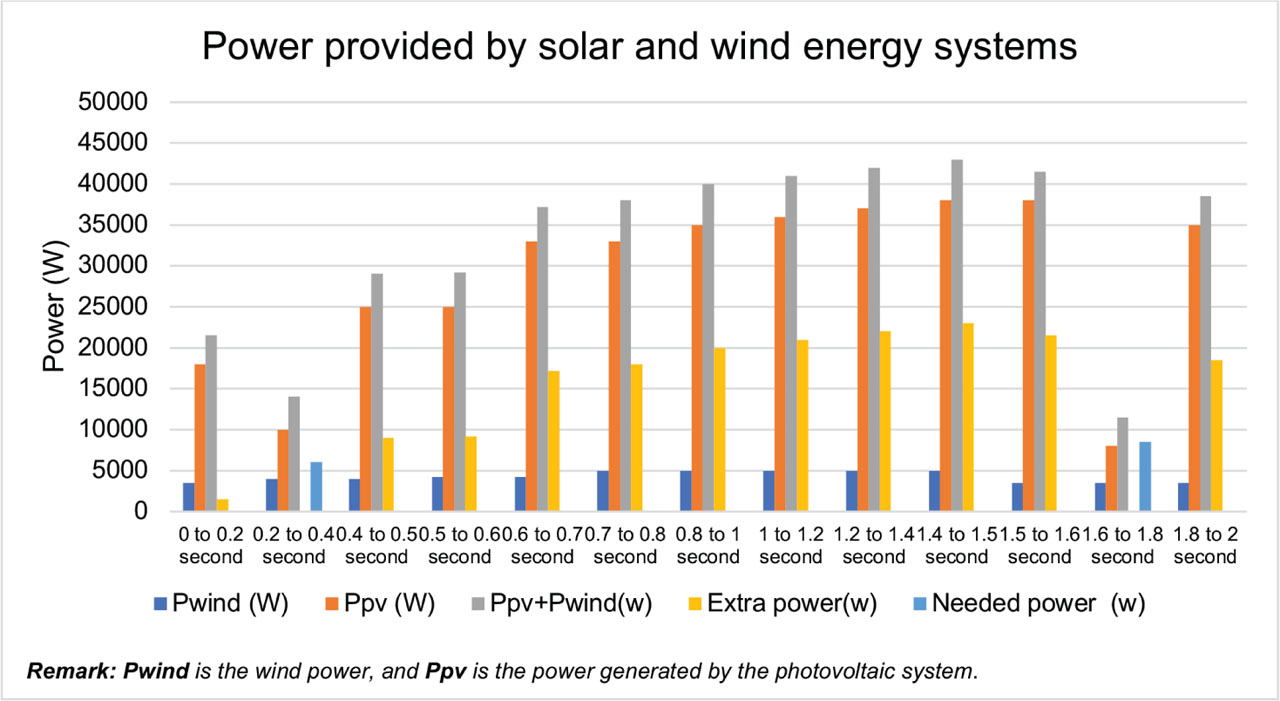
Figure 16.
Power supplied by the PV and wind systems.
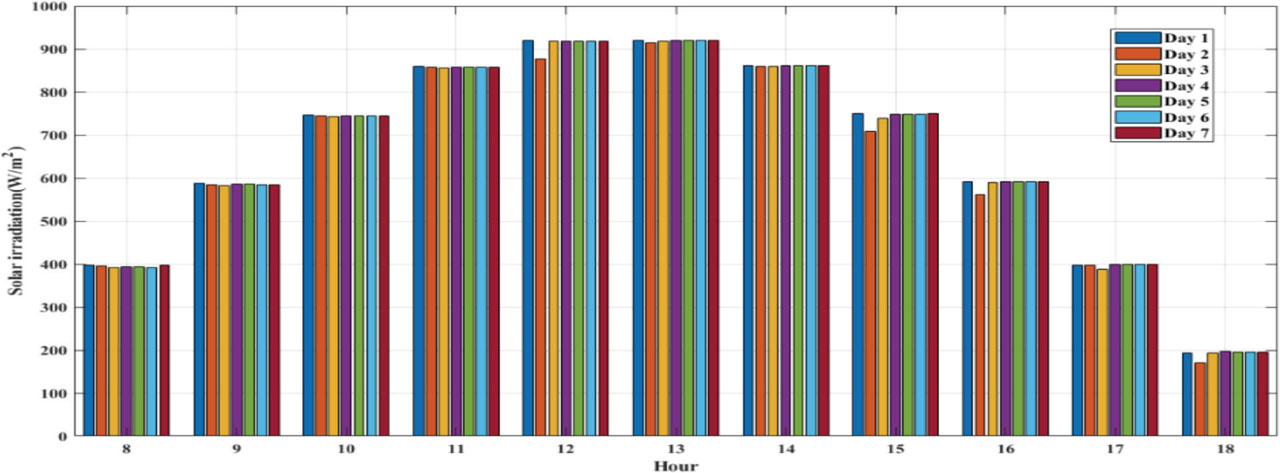
Figure 17.
Real hourly solar irradiance profiles of 7 days record.
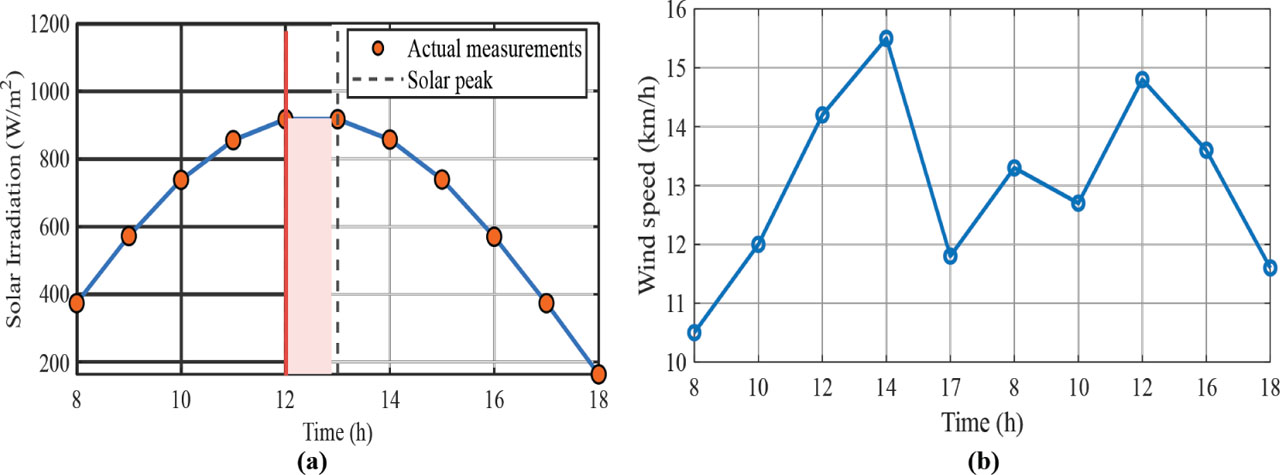
Figure 18.
Profile for solar irradiance and wind. (a) Solar irradiance. (b) Wind profile.
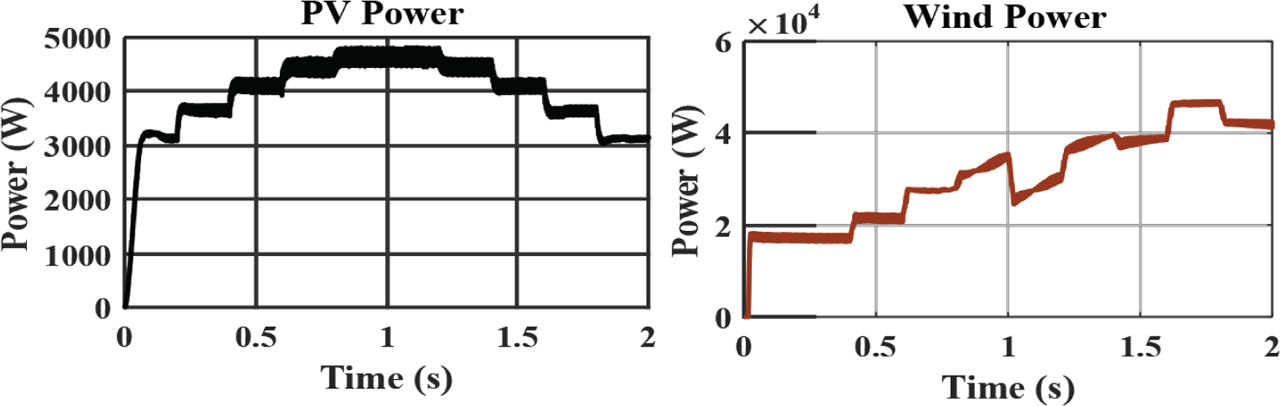
Figure 19.
Realistic renewable power generation.
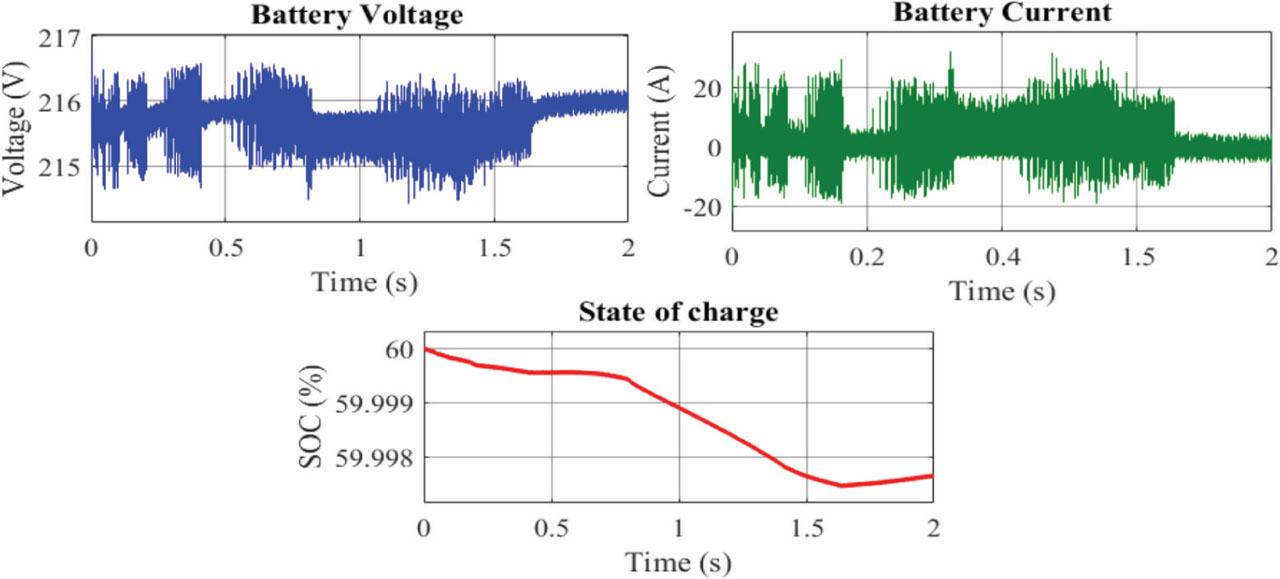
Figure 20.
FL battery state. SOC, state of charge.
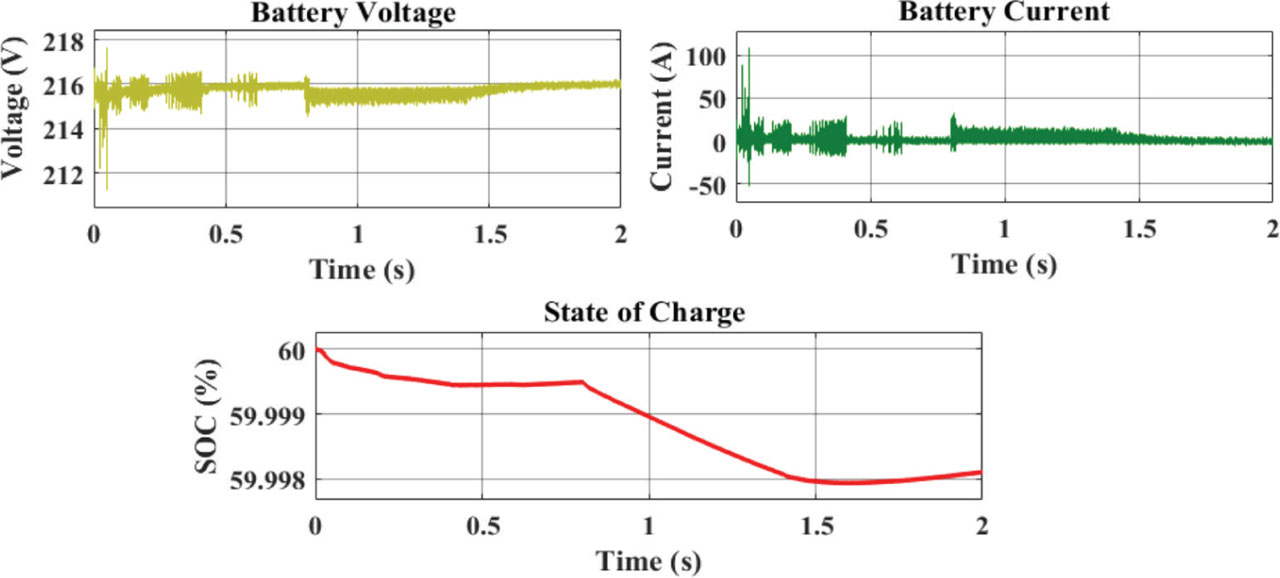
Figure 21.
ANN battery state. ANN, artificial neural network; SOC, state of charge.
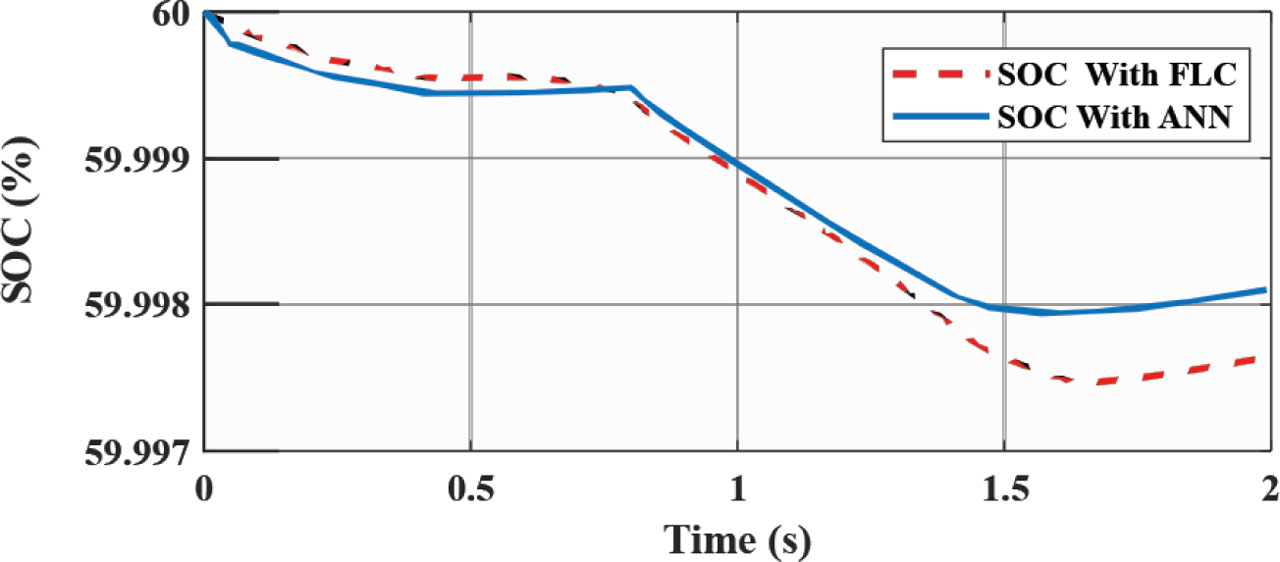
Figure 22.
SOC comparison: FL vs ANN. ANN, artificial neural network; FL, fuzzy logic; SOC, state of charge.
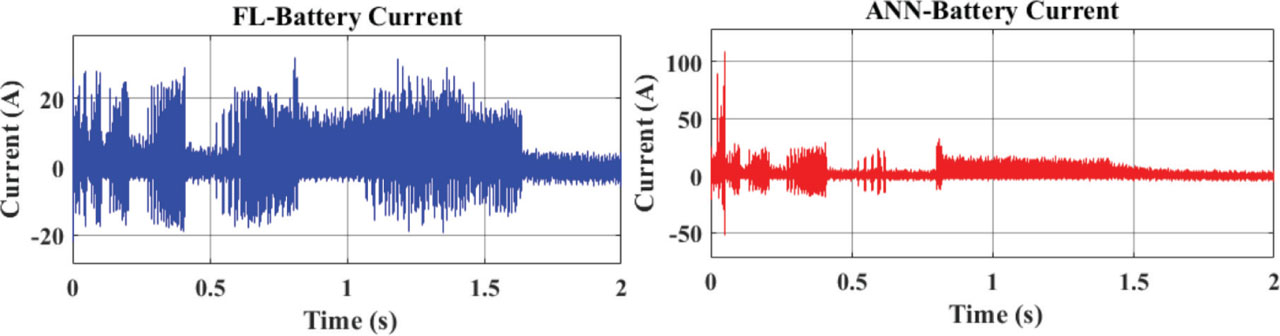
Figure 23.
Current comparison: FL vs ANN.ANN, artificial neural network; FL, fuzzy logic.
Table 8.
Comparative performance.
| Case | Metric | FLC | ANN | ANN improvement vs. FLC |
|---|---|---|---|---|
| Case 1 | Discharge energy (Wh) | 0.3646 | 0.3001 | 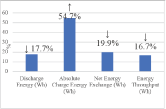 |
| Absolute charge energy (Wh) | 0.1270 | 0.1965 | ||
| Net energy exchange (Wh) | 0.2376 | 0.1905 | ||
| Energy throughput (Wh) | 0.4916 | 0.4098 | ||
| Case 2 | Discharge energy (Wh) | 0.3846 | 0.3159 | 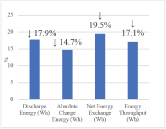 |
| Absolute charge energy (Wh) | 0.1285 | 0.1096 | ||
| Net energy exchange (Wh) | 0.2561 | 0.2062 | ||
| Energy throughput (Wh) | 0.5130 | 0.4255 | ||
| Overall | SOC RMS fluctuations | - | - | 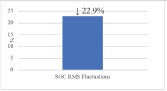 |