
Table 1.
Comparative summary of related studies.
| Study | Control strategy | Main focus | Limitation/gap identified |
|---|---|---|---|
| Alaa and Temurtaş (2024) | SMC and FLC | Improve speed and torque performance | A sufficient analysis regarding the effect of changes in rotor resistance was not provided. |
| It was not demonstrated that good flux regulation can be achieved even with a PIC. | |||
| The control system is relatively complex. | |||
| The effect of saturation on reactive power draw was not discussed. | |||
| Shaija and Daniel (2021) | SMC | Improve the robustness of torque and speed control | Accurate q-axis flux regulation is not addressed. |
| The effect of saturation on reactive power draw was not discussed. | |||
| Do et al. (2022) | PI controllers | Improve the dynamic response of speed and torque | Accurate q-axis flux regulation is not addressed. |
| The system’s performance was not discussed in light of changes in the rotor resistance value. | |||
| Ali et al. (2023) | Non-linear controllers (SMC, super-twisting, backstepping) | Increase robustness under disturbances | The effect of rotor resistance variation has not been deeply analysed. |
| The control system is relatively complex. | |||
| Sultan and Al-Badrani (2024) | PI and SMC controllers | Compare controller performance under limited conditions | Limited robustness and adaptability in non-linear operating conditions. |
| The system’s performance was not discussed in light of changes in the rotor resistance value. | |||
| The effect of saturation on reactive power draw was not discussed. |
Table 2.
Listing all symbols, abbreviations and constants.
| Symbol | Description | Unit |
|---|---|---|
| ωs | Synchronous speed (electrical frequency) | rad · s−1 |
| ω | Electric speed | rad · s−1 |
| vsq, vsd | Stator voltage vector on q and d-axis | V |
| isq, isd | Stator current vector on q and d-axis | A |
| Φrq, Φrd | Rotor flux vector on q and d-axis | Wb |
| P | Number of pole pairs | - |
| Ls | Stator inductance | H |
| Lr | Rotor inductance | H |
| Lm | Magnetizing inductance | H |
| RS | Stator resistance | Ω |
| Rr | Rotor resistance | Ω |
| F | Friction coefficient | N · m−1 · s−1 |
| J | Rotor inertia | kg · m−2 |
| TL | Load torque | N · m−1 |
| Te | Electromagnetic torque | N · m−1 |
| Vdc | DC link voltage | V |
| Ω | Mechanical speed | rad · s−1 |
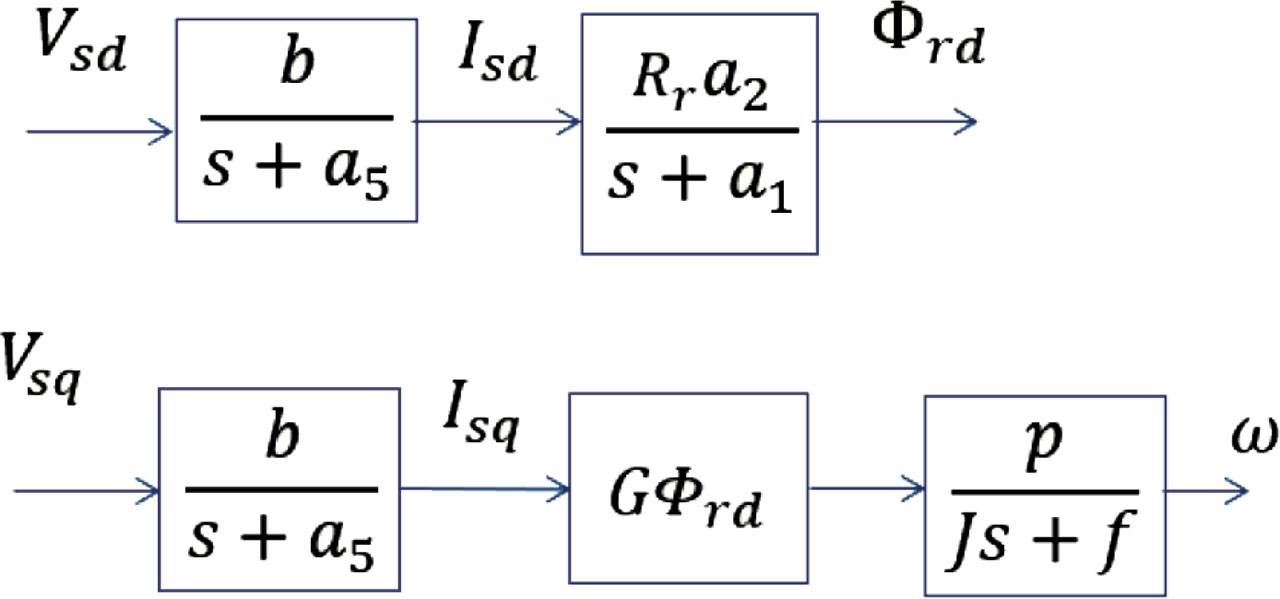
Figure 1.
The block diagram of an induction motor in the dq frame.

Figure 2.
Conceptual block diagram of the proposed EFOC system. EFOC, enhanced field-oriented control.

Figure 3.
The illustration of TFOC using PI controllers. PI, proportional-integral; SPWM, sinusoidal pulse-width modulation; TFOC, traditional field-oriented control.

Figure 4.
The map between frequency and magnetic flux.

Figure 5.
The illustration of EFOC using PI controllers. EFOC, enhanced field-oriented control; PI, proportional-integral; SPWM, sinusoidal pulse-width modulation.

Figure 6.
The illustration of TFOC using SM controllers. SPWM, sinusoidal pulse-width modulation; TFOC, traditional field-oriented control.

Figure 7.
The illustration of EFOC using SM controllers. EFOC, enhanced field-oriented control; SPWM, sinusoidal pulse-width modulation.
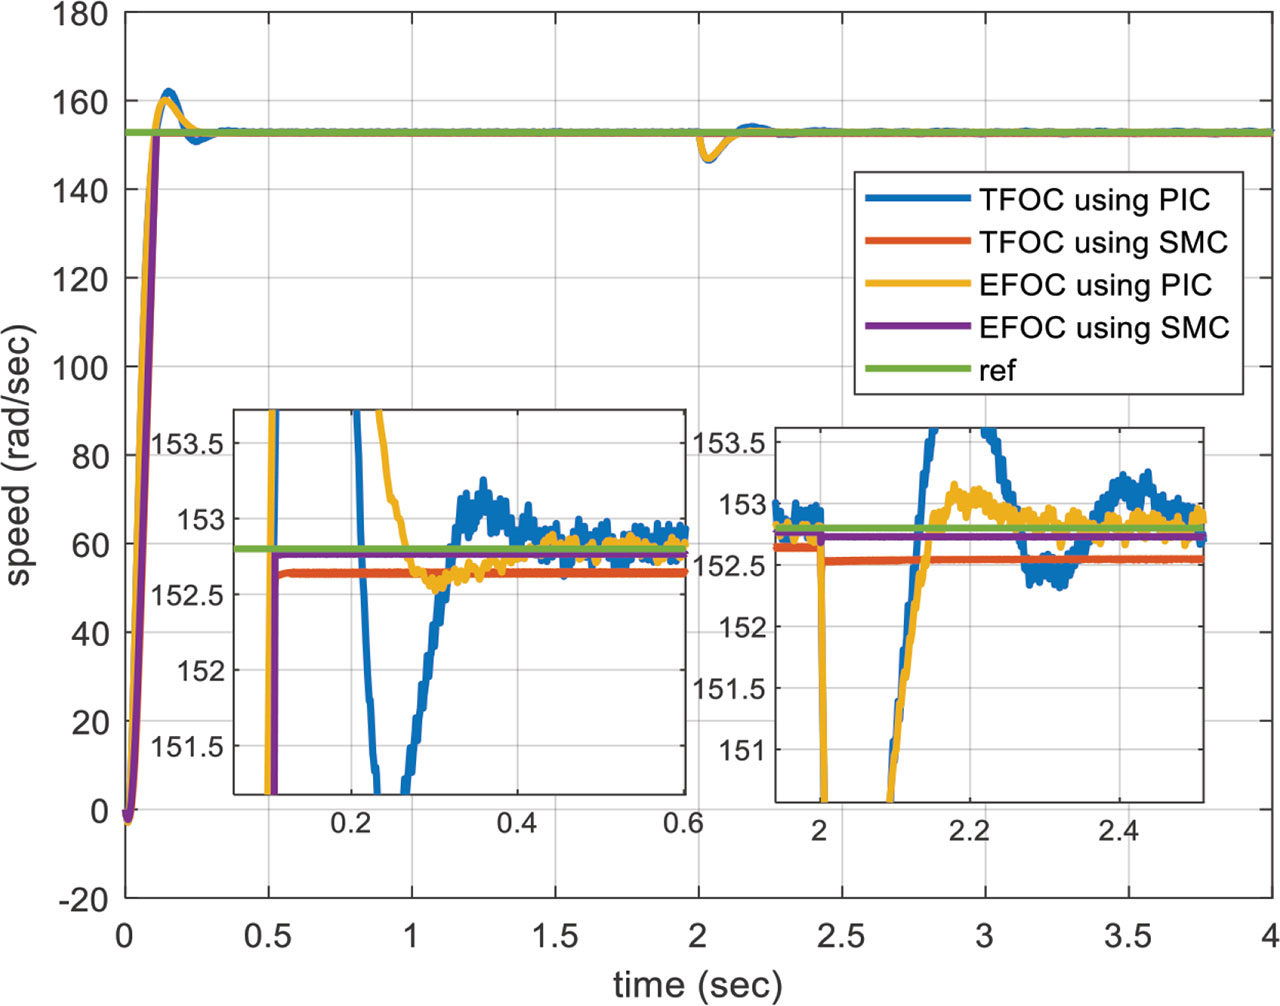
Figure 8.
The response of the studied control systems for speed regulation. EFOC, enhanced field-oriented control; PIC, proportional-integral controller; SMC, sliding mode control; TFOC, traditional field-oriented control.
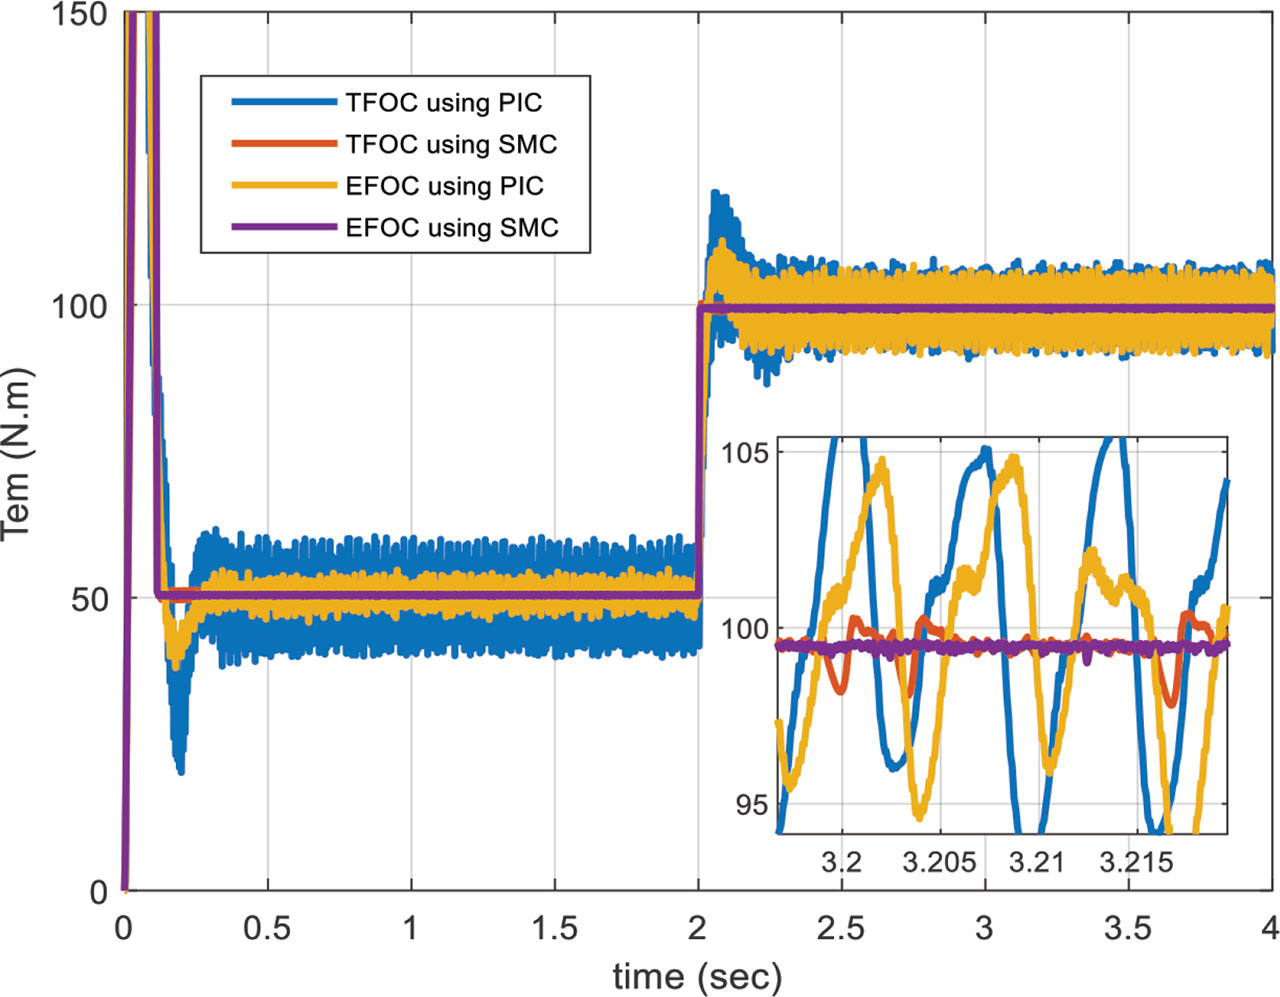
Figure 9.
The torque response of the studied control systems. EFOC, enhanced field-oriented control; PIC, proportional-integral controller; SMC, sliding mode control; TFOC, traditional field-oriented control.
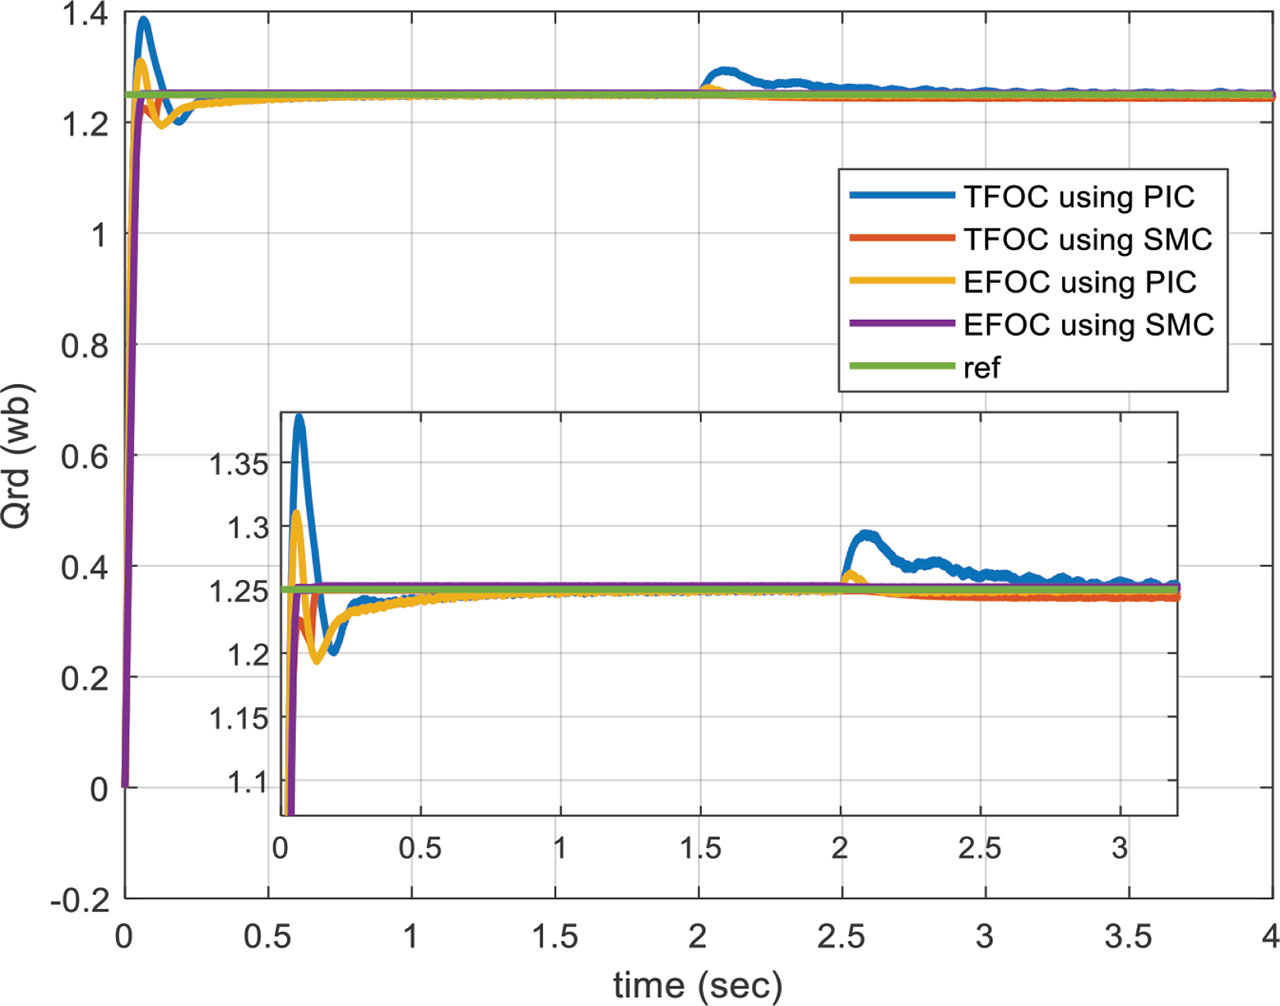
Figure 10.
The flux on d-axis response of the studied control systems. EFOC, enhanced field-oriented control; PIC, proportional-integral controller; SMC, sliding mode control; TFOC, traditional field-oriented control.
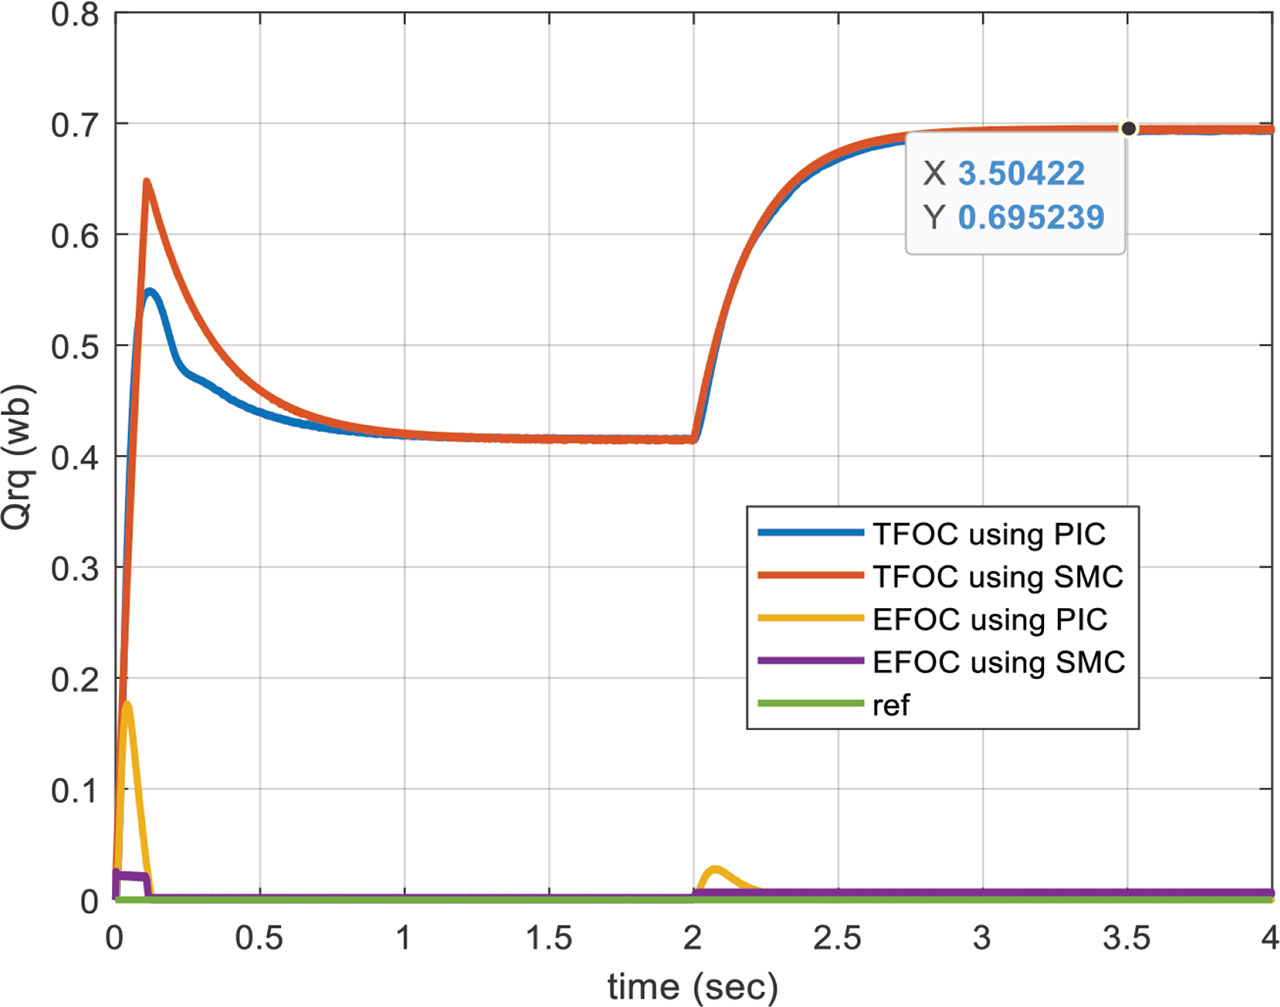
Figure 11.
The flux on the q-axis response of the studied control systems. EFOC, enhanced field-oriented control; PIC, proportional-integral controller; SMC, sliding mode control; TFOC, traditional field-oriented control.

Figure 12.
The voltage applied (Vmax) =Vph*√2 on the motor for the studied control systems. EFOC, enhanced field-oriented control; PIC, proportional-integral controller; SMC, sliding mode control; TFOC, traditional field-oriented control.
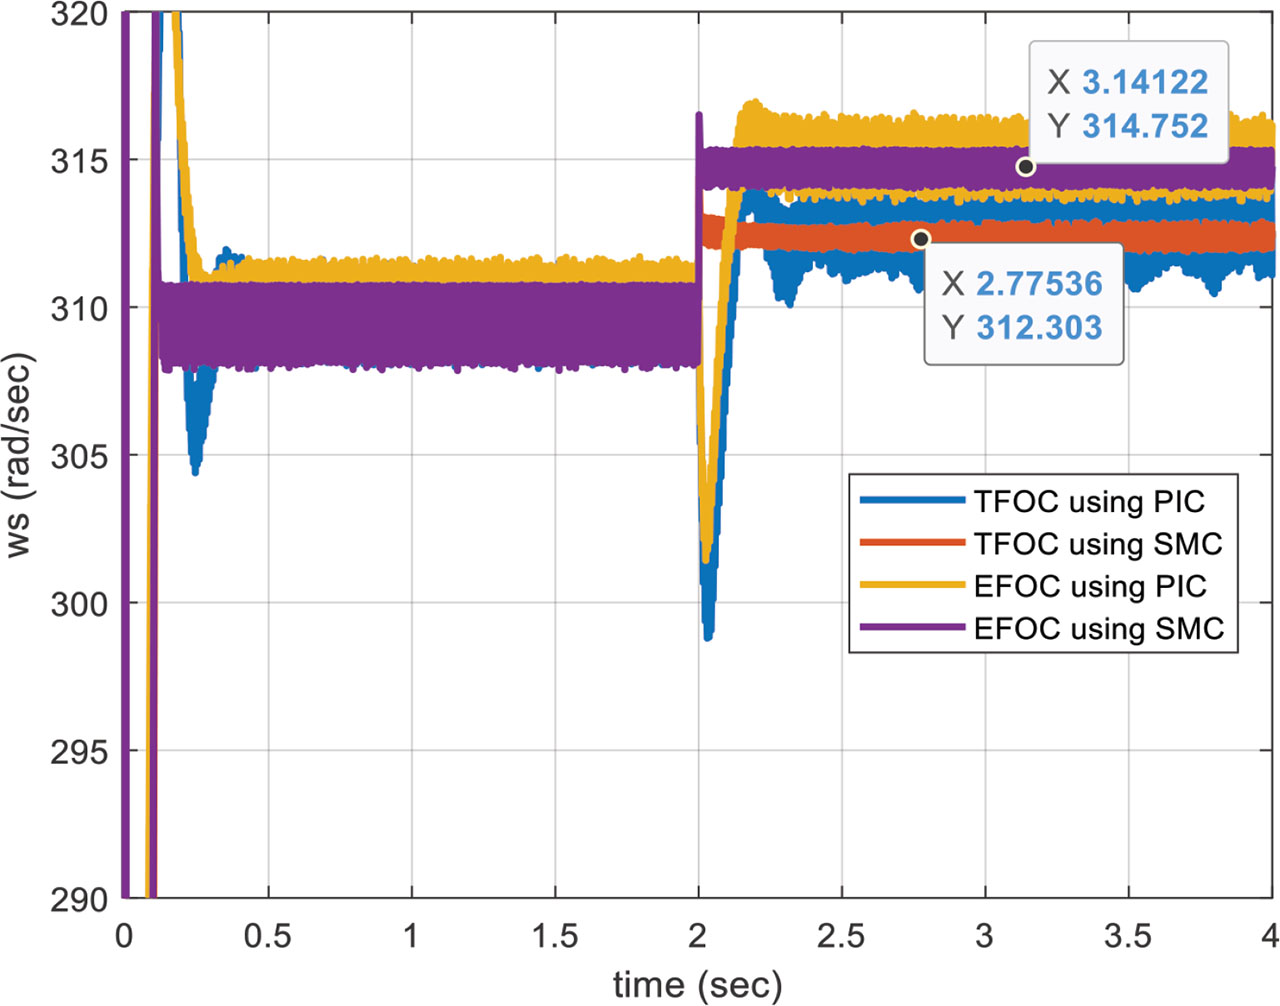
Figure 13.
The electrical frequency applied to the motor for the studied control systems. EFOC, enhanced field-oriented control; PIC, proportional-integral controller; SMC, sliding mode control; TFOC, traditional field-oriented control.

Figure 14.
The active power consumed using the studied control systems. EFOC, enhanced field-oriented control; PIC, proportional-integral controller; SMC, sliding mode control; TFOC, traditional field-oriented control.
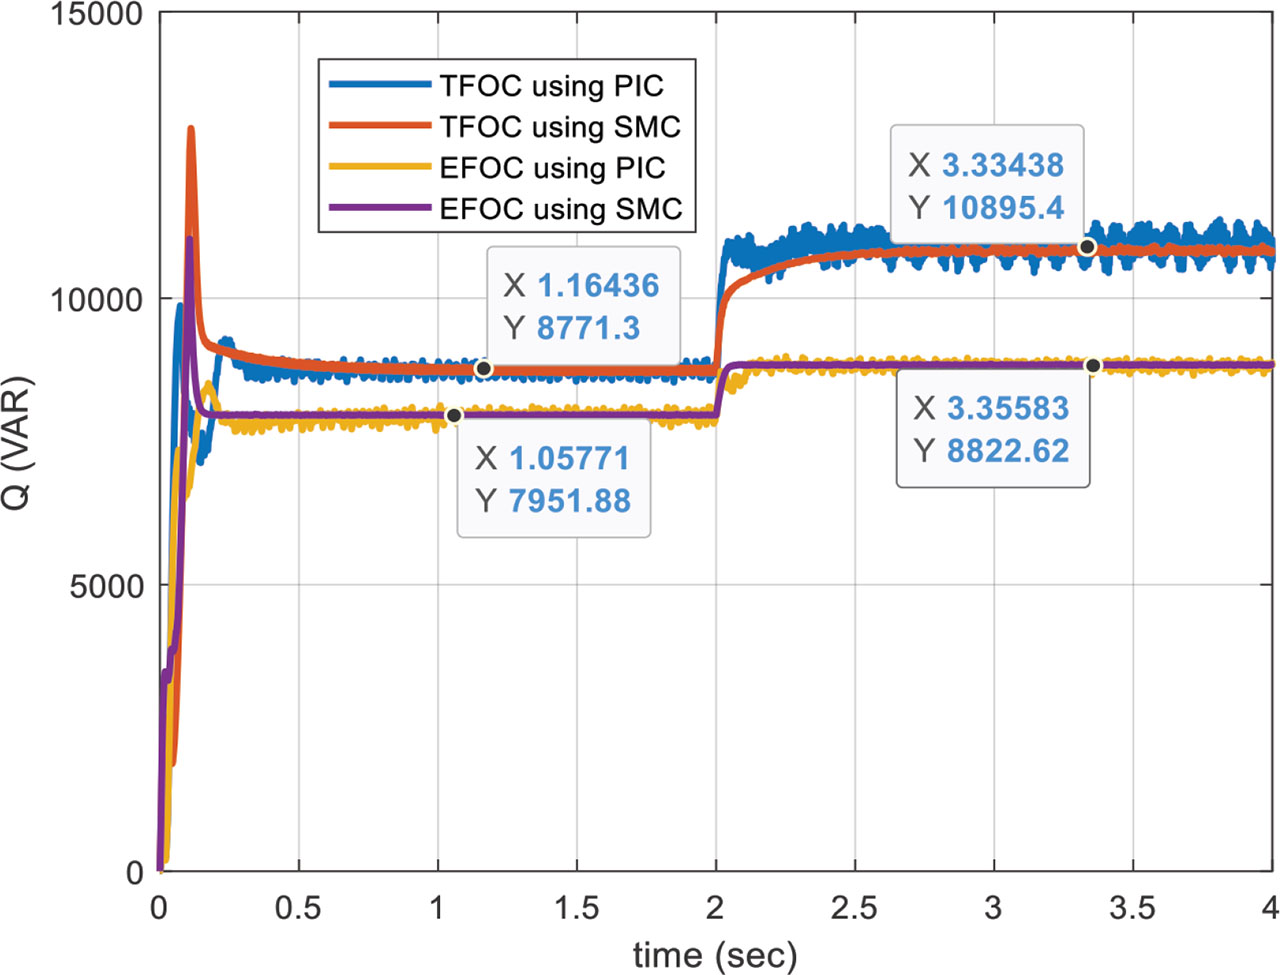
Figure 15.
The reactive power consumed using the studied control systems. EFOC, enhanced field-oriented control; PIC, proportional-integral controller; SMC, sliding mode control; TFOC, traditional field-oriented control.
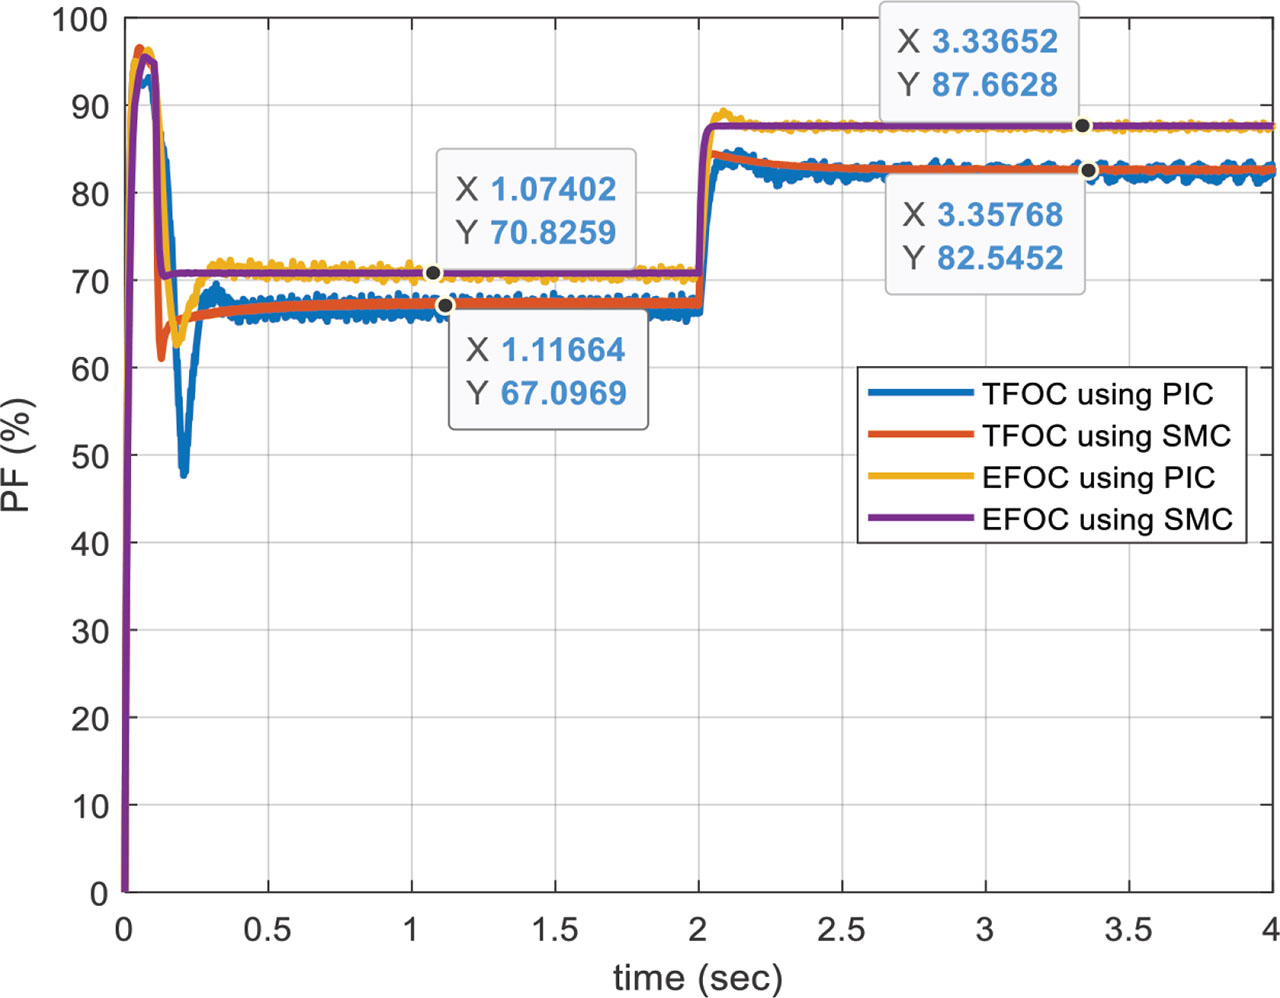
Figure 16.
The reactive power consumed using the studied control systems. EFOC, enhanced field-oriented control; PIC, proportional-integral controller; SMC, sliding mode control; TFOC, traditional field-oriented control.
Table 3.
Parameters of the studied motor.
| Rs | 0.2147 Ω |
| Rr | 0.2205 Ω |
| Ls | 0.065181 H |
| Lr | 0.065181 H |
| Lm | 0.06419 H |
| J | 0.1 kg · m−2 |
| F | 0.0095 kg · m−2 · s−1 |
| P | 2 |
| Nominal power | 15 kW |
| Nominal phase voltage | 230 V |
| Nominal synchronous speed | 314 rad · s−1 |
| Nominal mechanical speed | 152.8 rad · s−1 |
Table 4.
Combined performance overview of examined control systems.
| Control system | Settling time (s) | Overshoot (%) | Torque tipple (N · m−1) | Power factor improvement (%) | Remarks/observation |
|---|---|---|---|---|---|
| TFOC–PI | 0.4 | 6 | 13 | – | Conventional PI-based FOC shows slower response and higher ripple. |
| EFOC–PI | 0.3 | 4 | 13 | ~ 6 | Added q-axis flux regulation improves stability and PF slightly. |
| TFOC–SM | <0.1 | 0 | 3 | ~ 6 | Sliding mode enhances transient response and reduces ripple. |
| EFOC–SM | <0.1 | 0 | 0.3 | 7 | Proposed system achieves fastest response, lowest ripple, and best PF. |
Table 5.
Power and electrical parameters at rated load.
| Criterion | Traditional control system | Enhanced control system | Enhancement (%) |
|---|---|---|---|
| Voltage (V) | 375 | 333.4 | Reduce 11 |
| Frequency (Hz) | 312.3 | 315 | Increase 0.85 |
| Regulations Φ_rq | Indirect | Direct | - |
| Rotor flux (wb) | 1.43 | 1.25 | Reduce 12 |
| Active power (kW) | 16.2 | 16.2 | - |
| Reactive power (kVAR) | 10.9 | 8.8 | Reduce 20 |
| Power factor | 0.83 | 0.88 | Increase 6 |
Table 6.
Control performance comparison.
| Performance metric | EFOC-PI | TFOC-PI | EFOC-SM | TFOC-SM | |
|---|---|---|---|---|---|
| Speed regulation | Settling time (s) | 0.3 | 0.4 | <0.1 | <0.1 |
| Overshoot (%) | 4 | 6 | 0 | 0 | |
| Speed value at the moment of applying torque (rad · s−1) | 147 | 147 | 152.5 | 152.5 | |
| Torque ripple | (Peak-to-peak) (N · m−1) | 13 | 13 | 0.3 | 3 |
| Flux—d axis | Settling time (s) | 0.5 | 0.5 | <0.1 | 0.15 |
| Overshoot (flux—d axis) (%) | 0.05 | 1 | 0 | 0 | |
| Flux value at the moment of applying the torque (Wb) | 1.27 | 1.29 | 1.25 | 1.24 | |
| Flux—q axis | (Steady state) (Wb) | ≈0 | 0.42 → 0.7 | ≈0 | 0.42 → 0.7 |