
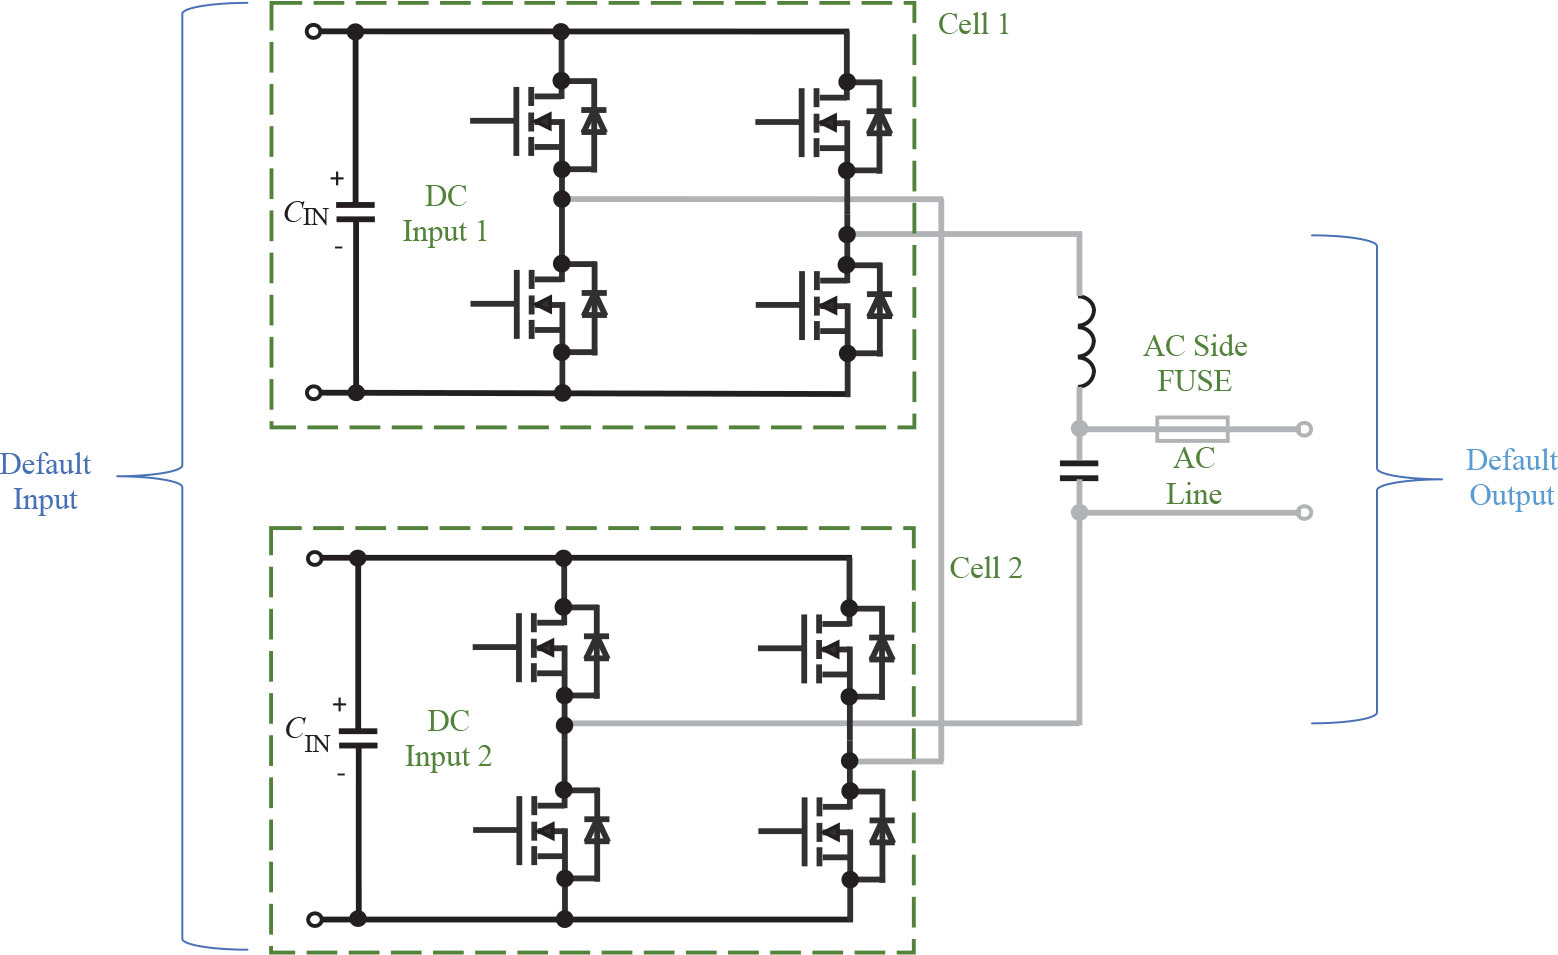
Figure 1.
Cascaded H-bridge cells concept.
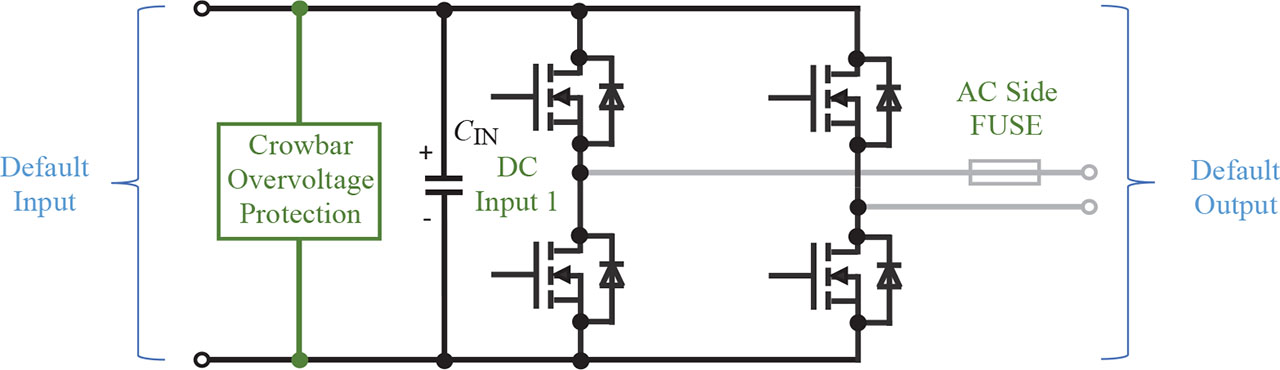
Figure 2.
H-bridge cell overvoltage protection implementation (Strossa et al., 2024).
Table 1.
H-bridge cell required overvoltage protection parameters (Strossa et al., 2024).
| Symbol | Parameter | Value |
|---|---|---|
| CIN | H-bridge single cell input capacity | 4.7 mF |
| VBR | Protection breakdown voltage | 300 V |
| IBRMAX | Maximum peak of the break clamping current | 100 A |
| ΔVSWRIP | Maximum ripple of the CIN capacity voltage on the CIN equivalent series inductivity, originated by the pulse width modulation of the H-bridge transistors | 50 V |
| fSW | H-bridge cell switching frequency | 100 kHz |
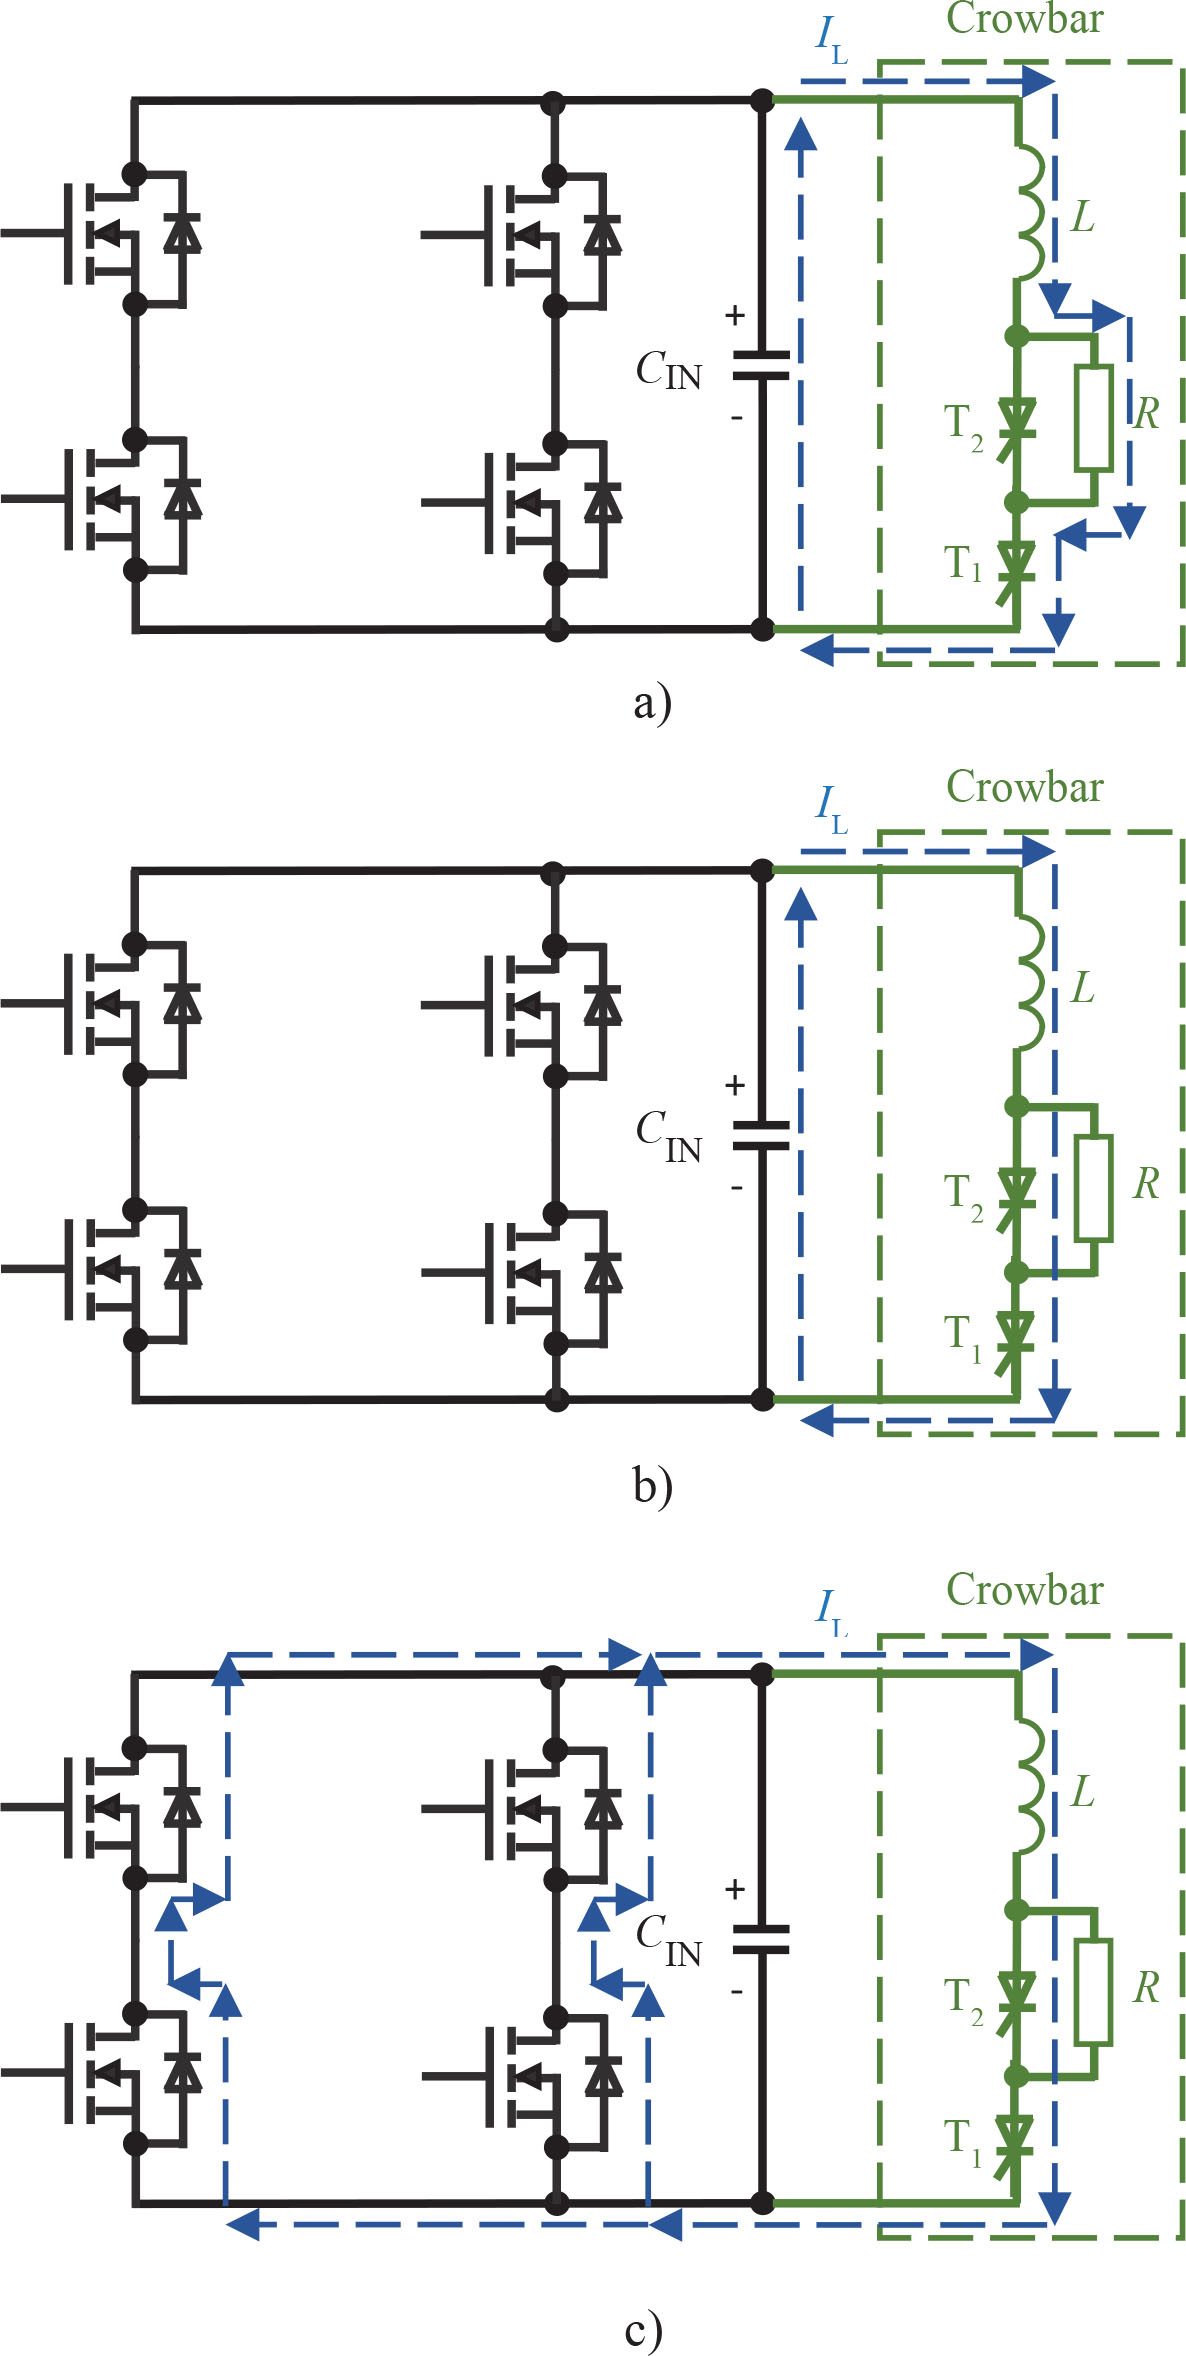
Figure 3.
Proposed overvoltage protection power circuit, link capacity discharging current loop of the first stage thyristor T1 activated (a), link capacity discharging current loop of the second stage thyristor T2 activated (b), crowbar excited inductor current after link capacity discharged (c).
Table 2.
Crowbar power devices requirements.
| Symbol | Parameter | Value |
|---|---|---|
| di/dt | Thyristor switching current slope | 150 A/µs |
| IMAX | Maximum thyristor anode current | 100 A/20 ms |
| i2t | Thyristor thermal energy integral | 88 ASs |
| L | Crowbar Inductivity | 170 µH |
| ILMAX | Maximum inductor non-saturating current | 115 A |
| R | Crowbar resistivity | 2,6 Ω |
| PRPEAK | Crowbar resistor peak power | 26 kW |
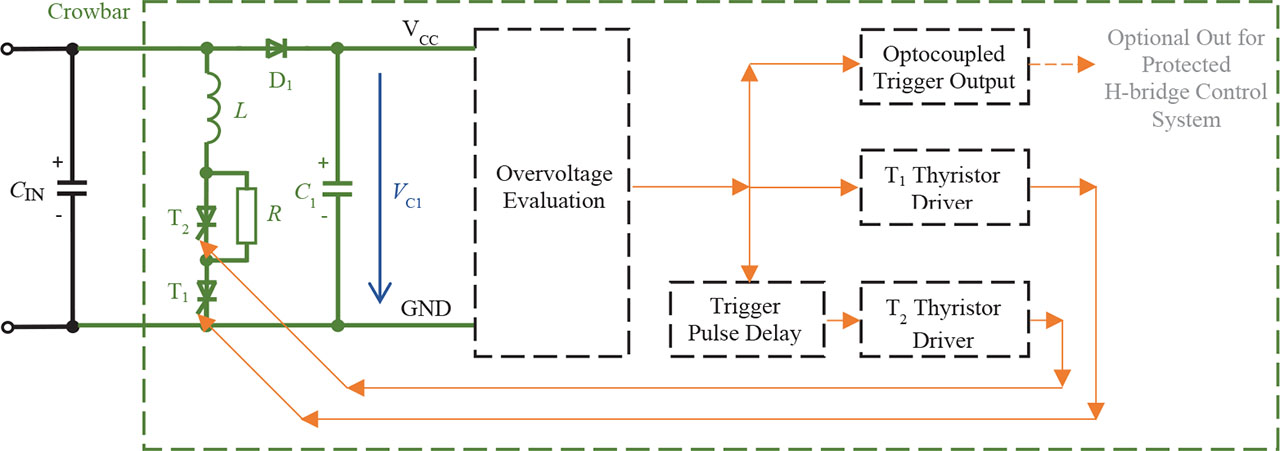
Figure 4.
Block diagram of the proposed crowbar overvoltage protection.
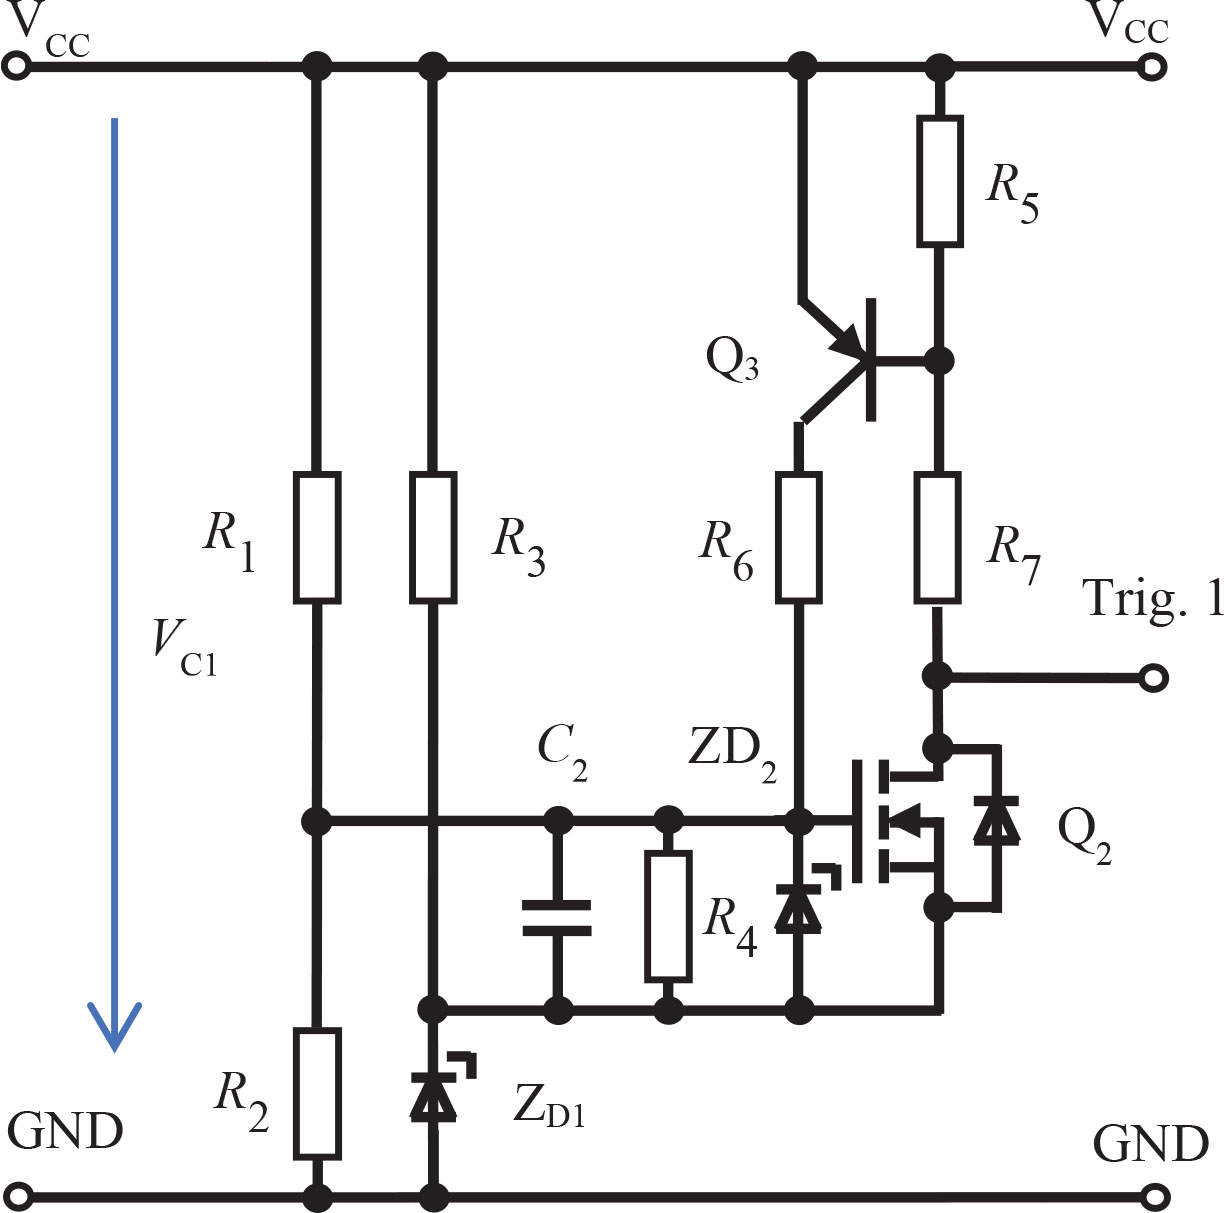
Figure 5.
Simplified proposed crowbar overvoltage evaluation control circuit (Strossa et al., 2024).
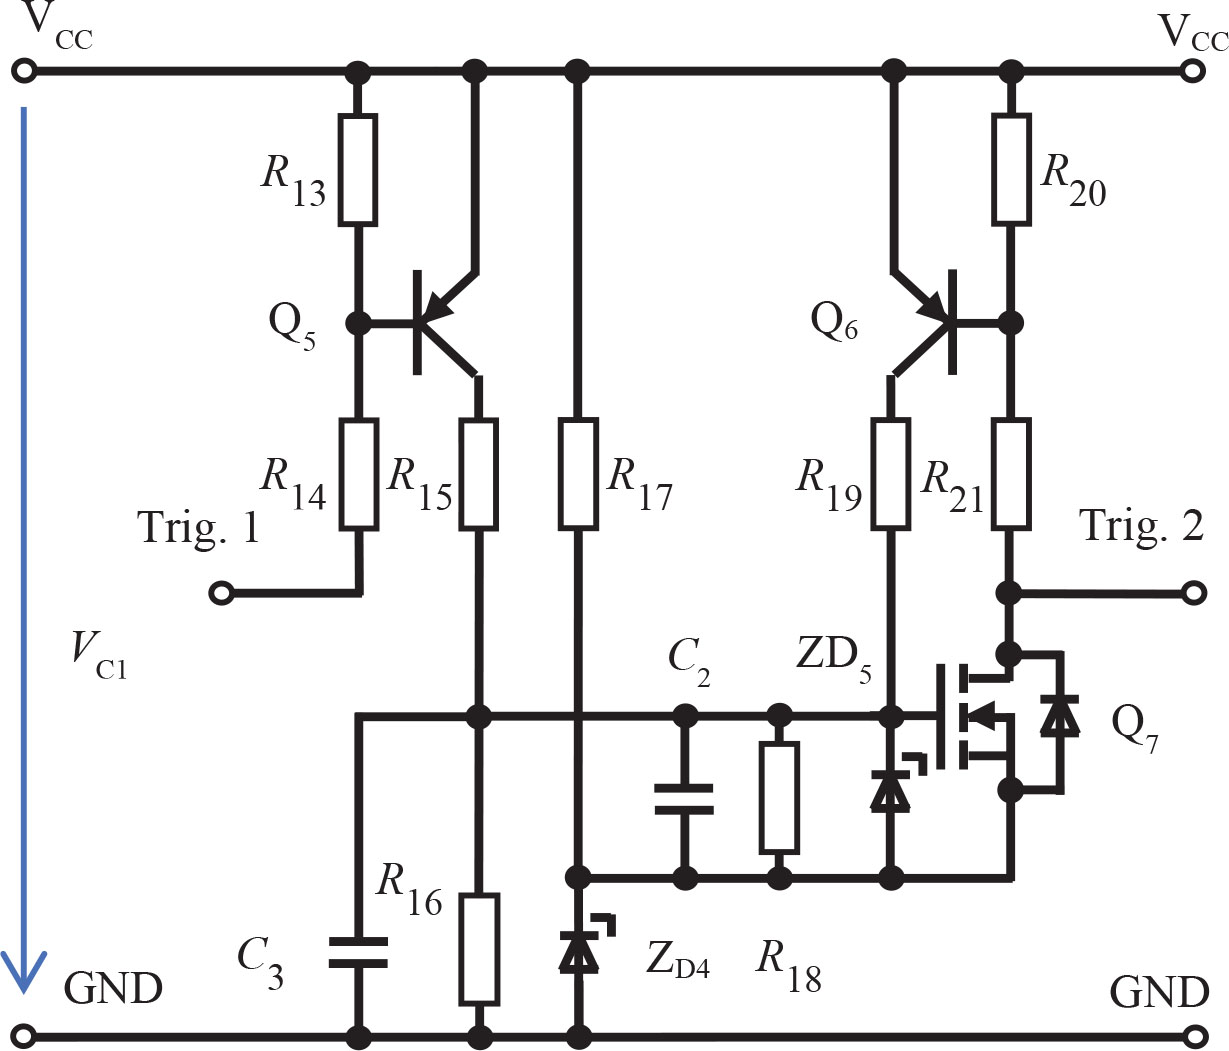
Figure 6.
Simplified proposed crowbar second-stage triggering control circuit.
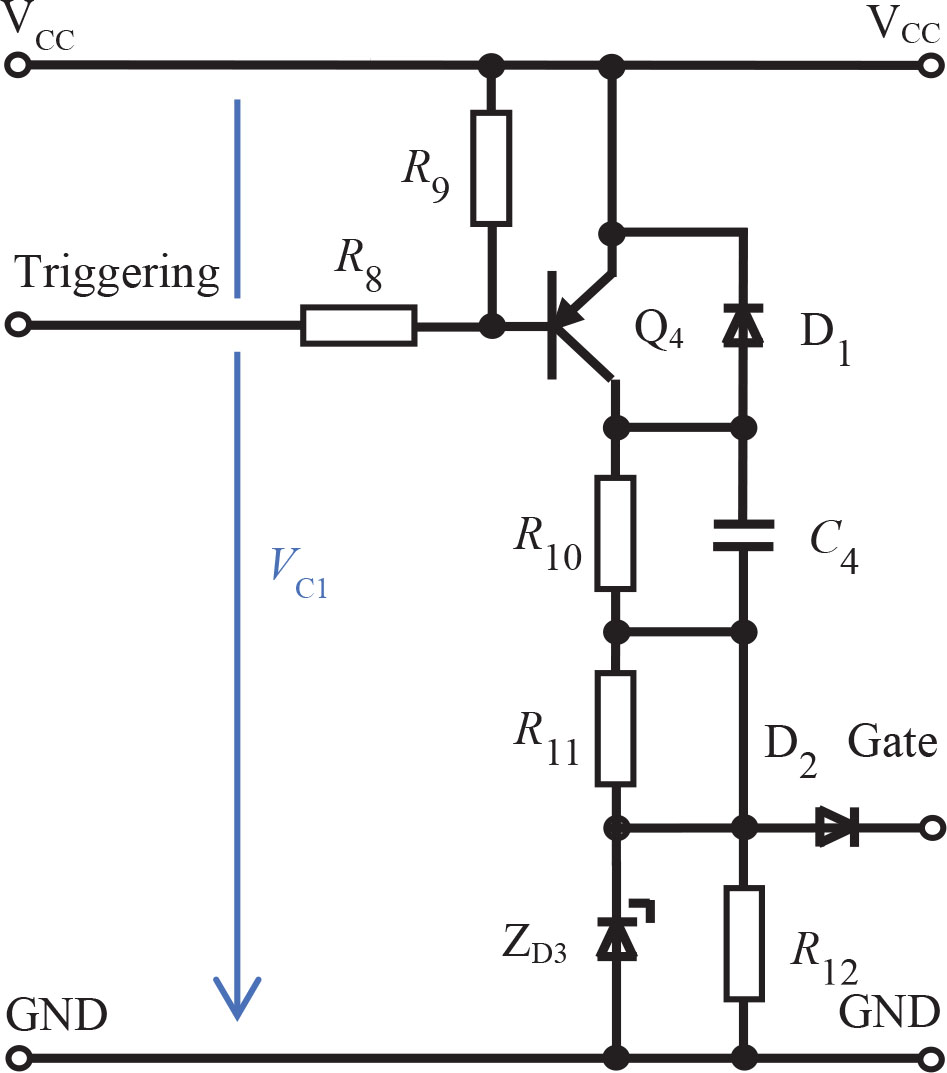
Figure 7.
Simplified crowbar thyristor driver (Strossa et al., 2024).
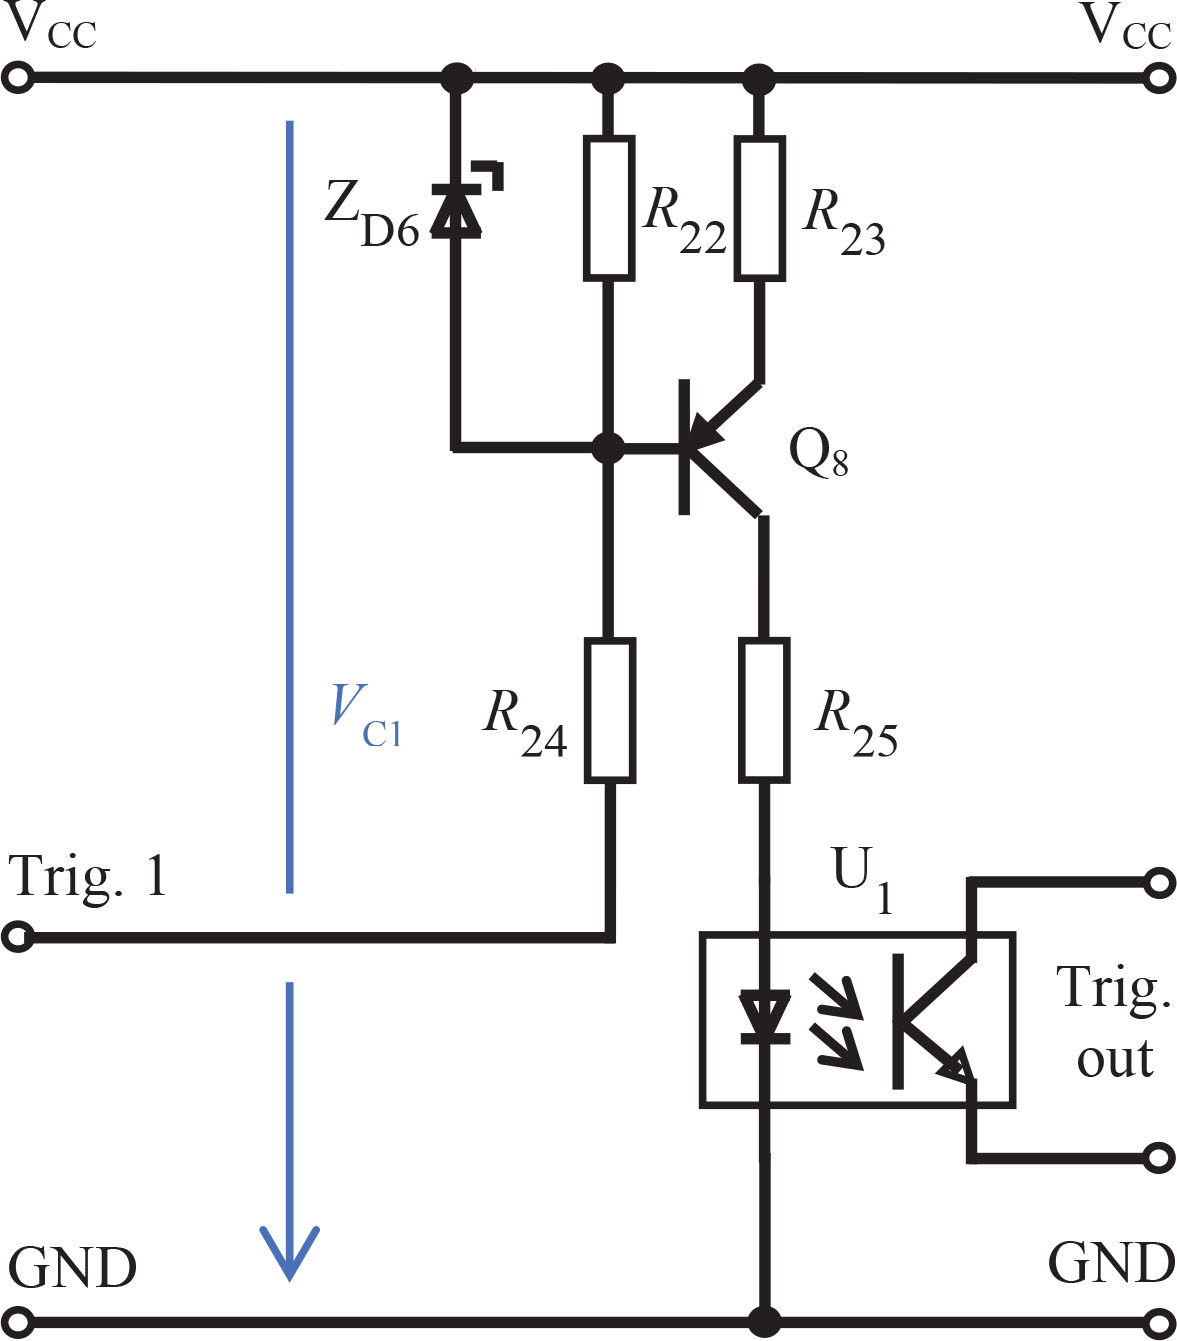
Figure 8.
Simplified optocoupled trigger output.
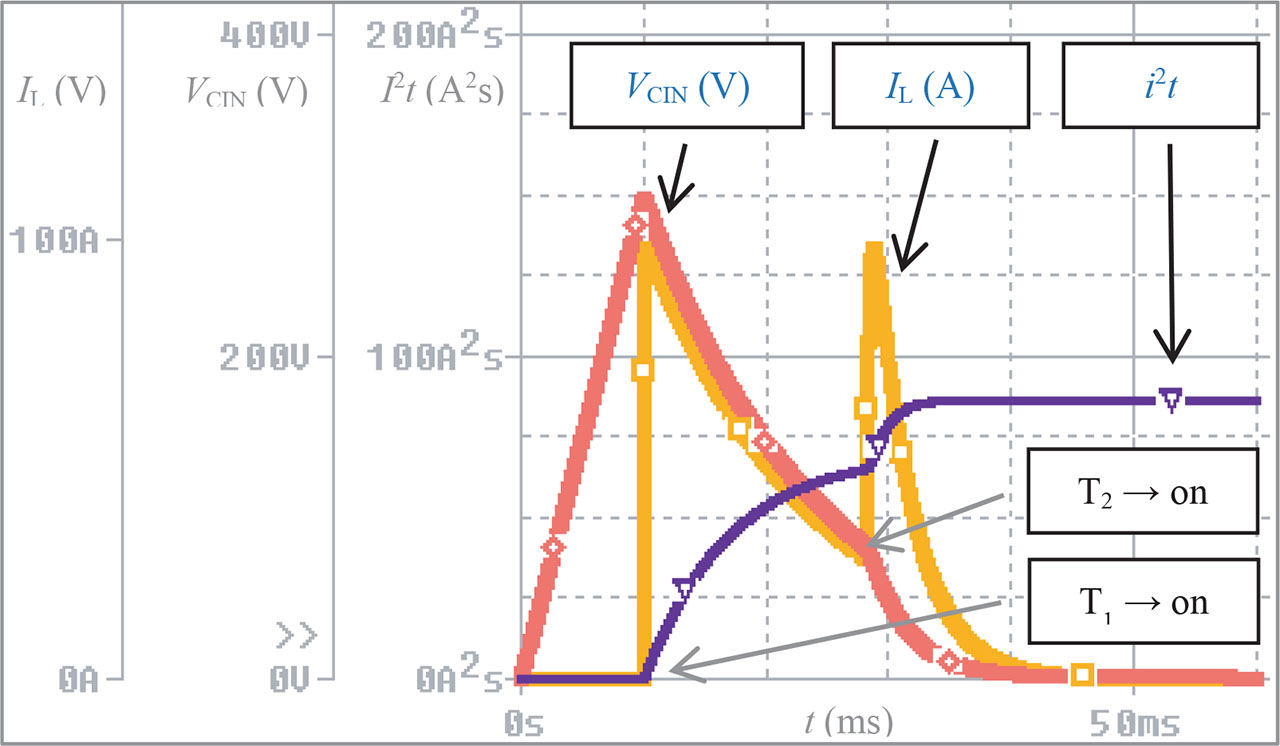
Figure 9.
Spice simulation of proposed crowbar intervention, H-bridge cell input capacity voltage VCIN (V), 50 V/div, clamping input capacity discharging current IL (A), 18 A/div and thermal integral i2t (A2s), 25 A2s/div, timebase 50 ms/div.
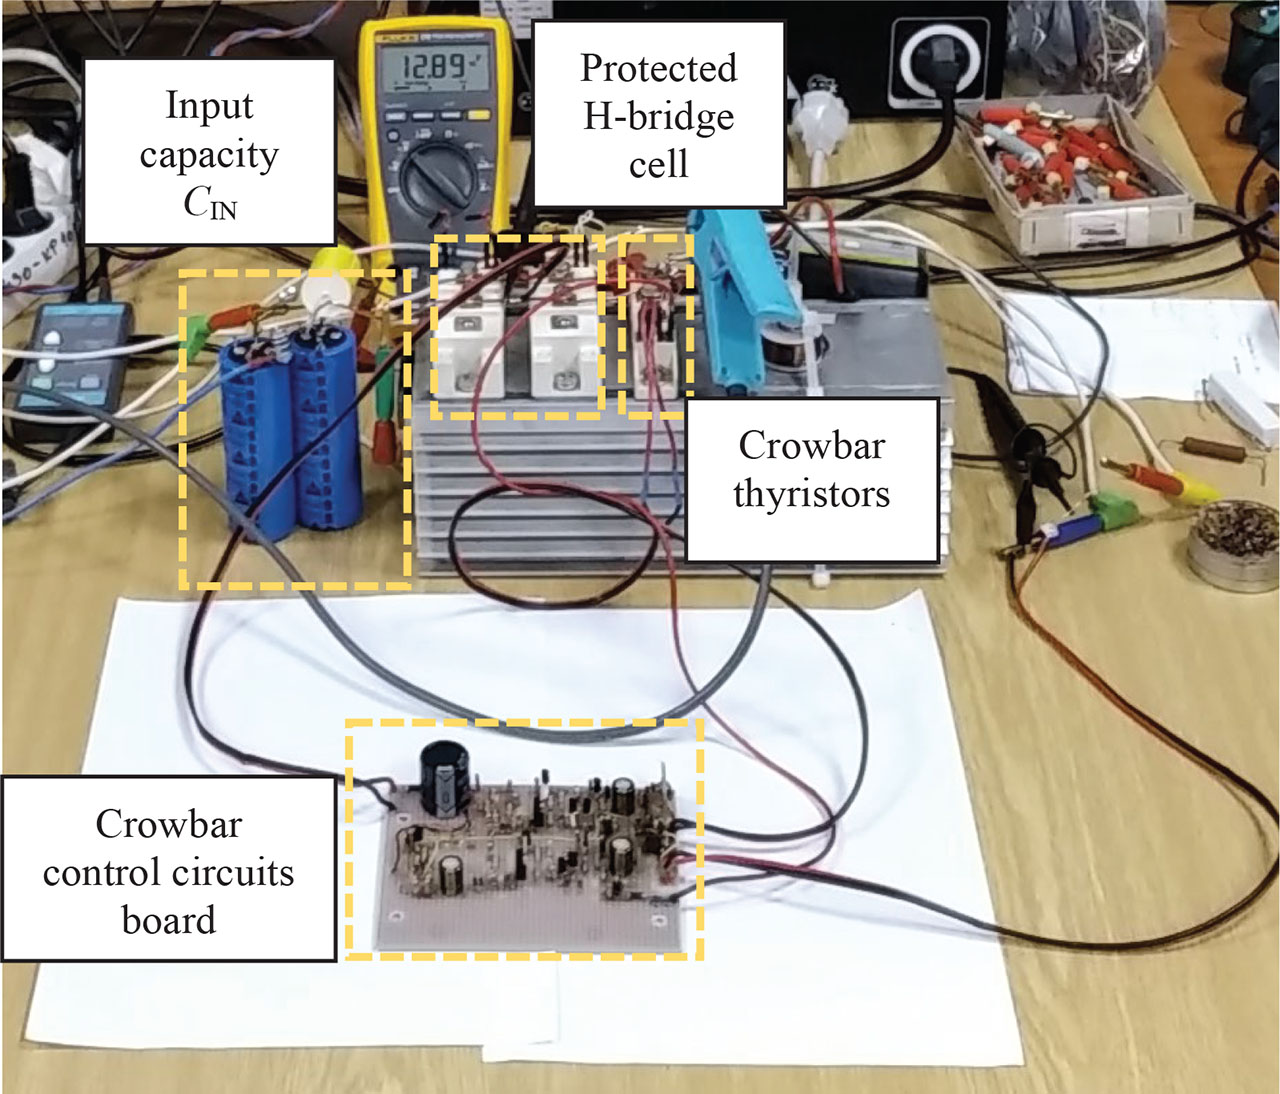
Figure 10.
Experimental set-up (Strossa et al., 2024).
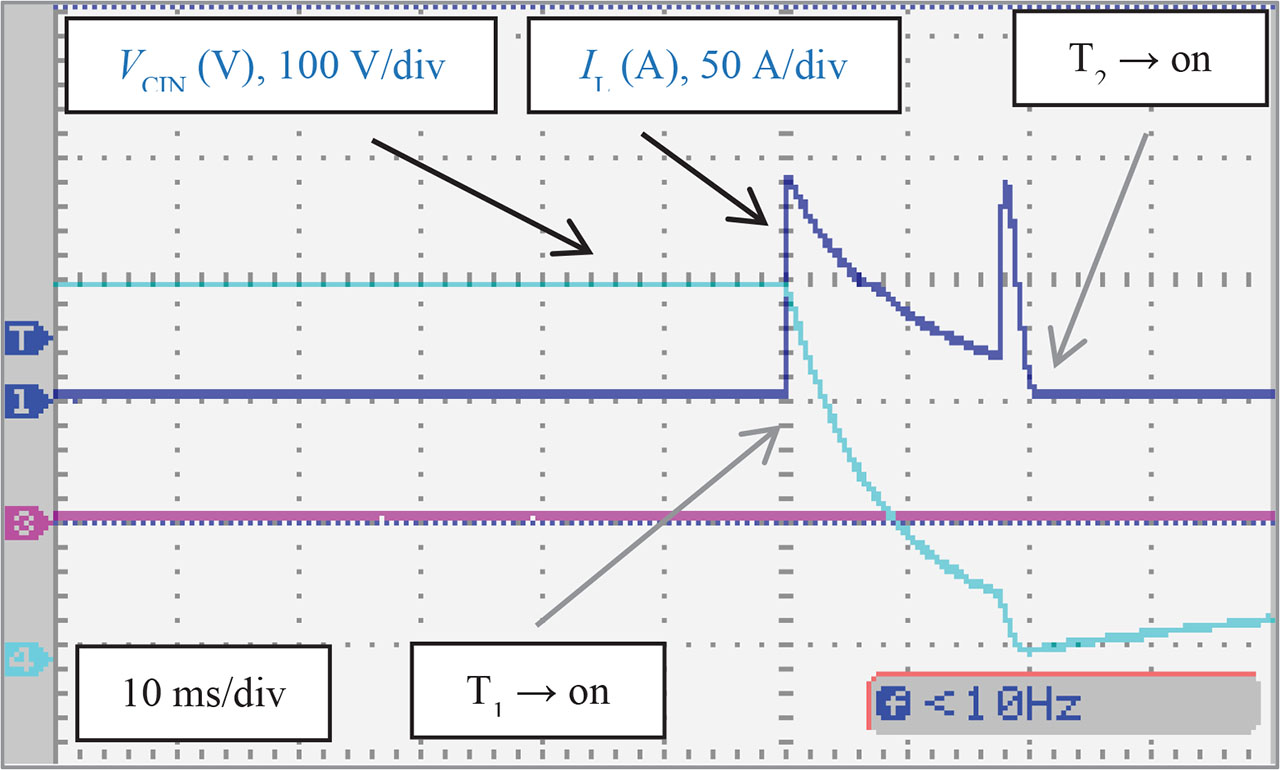
Figure 11.
Experimental waveforms after crowbar intervention of H-bridge (Strossa et al., 2024), input capacity voltage VCIN (V), 100 V/div and crowbar clamping current IL (A), 50 A/div, time base 10 ms/div.
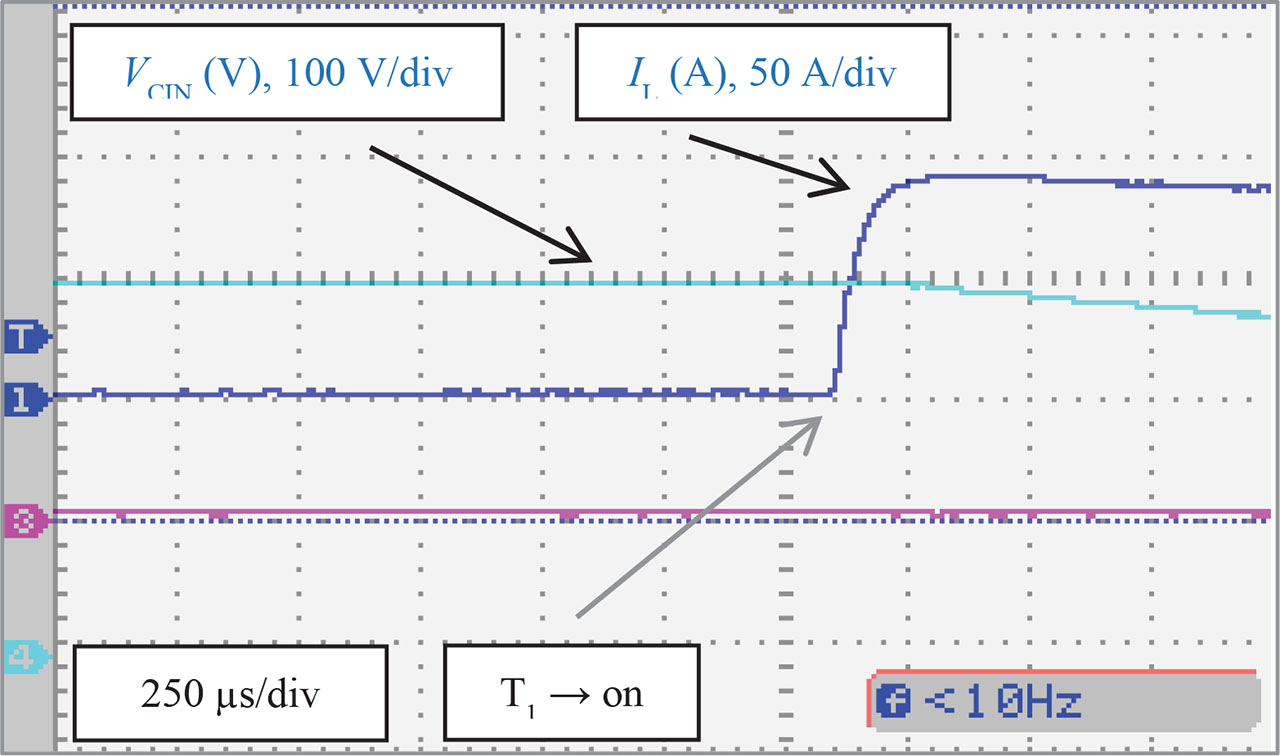
Figure 12.
Experimental waveforms after crowbar intervention of H-bridge (Strossa et al., 2024), input capacity voltage VCIN (V), 100 V/div and crowbar clamping current IL (A), 50 A/div, time base 250 μs/div, detailed current rising is scoped.
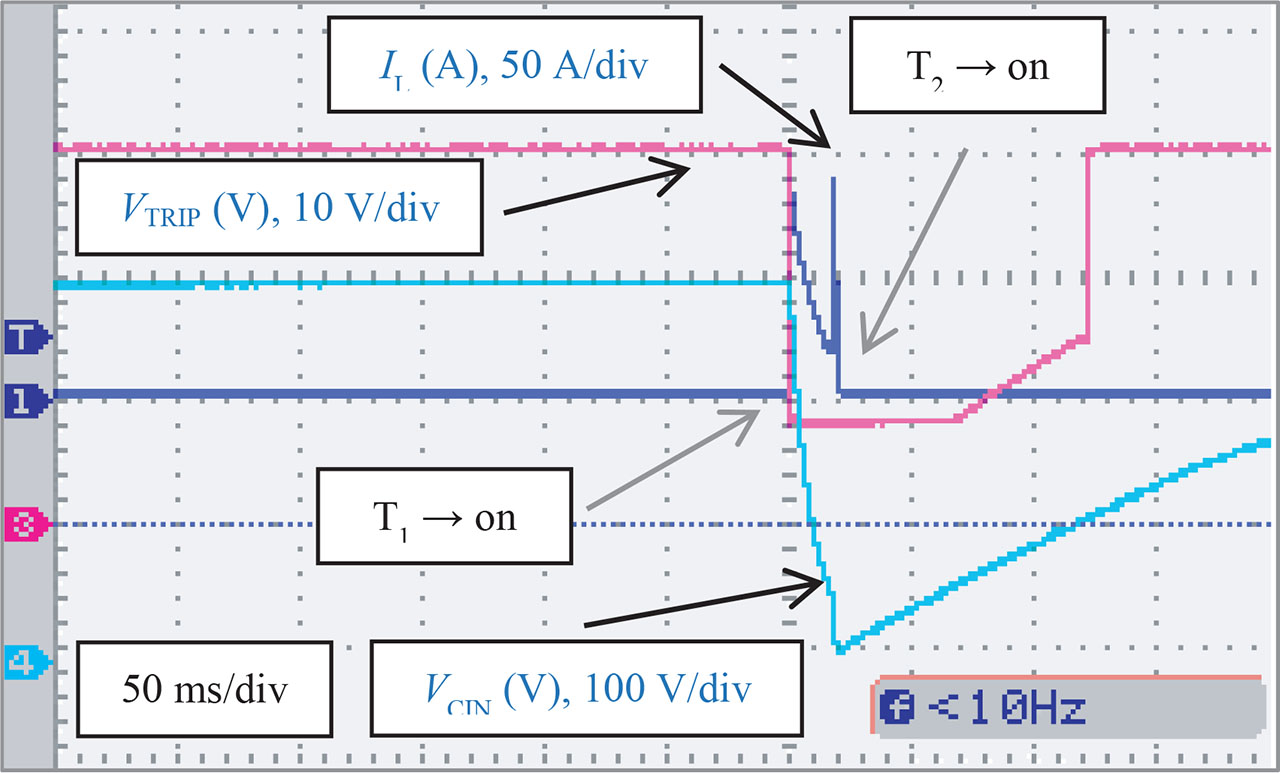
Figure 13.
Experimental waveforms after crowbar intervention of H-bridge (Strossa et al., 2024), input capacity voltage VCIN (V), 100 V/div, crowbar clamping current IL (A), 50 A/div and trip voltage on the secondary side of optocoupler VTRIP (V), 10 V/div, time base 50 ms/div, trip signal observed.