
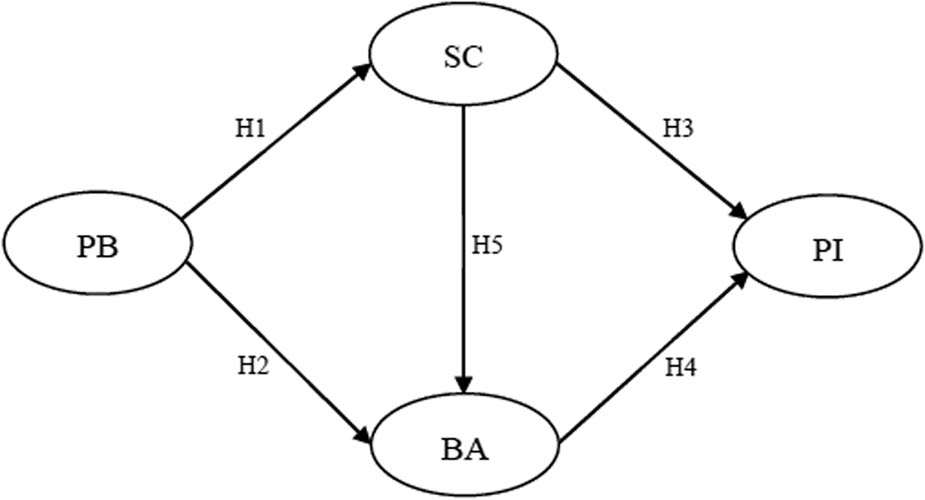
Figure 1
Research framework diagram. Note: PB = personal brand; SC = self-congruity; BA = brand attachment; PI = purchase intention.
Source: Authors’ contribution.
Table 1
Summary of reliability and validity analysis for all constructs.
| Construct | Number of items | Range of factor loadings | Cronbach’s α | CR | AVE |
|---|---|---|---|---|---|
| PB | 30 | 0.750–0.924 | 0.987 | 0.957 | 0.600 |
| SC | 8 | 0.708–0.898 | 0.937 | 0.931 | 0.629 |
| BA | 6 | 0.780–0.891 | 0.912 | 0.915 | 0.642 |
| PI | 4 | 0.806–0.891 | 0.909 | 0.904 | 0.702 |
Note: PB, personal brand; SC, self-congruity; BA, brand attachment; PI, purchase intention.
Source: Authors’ contribution.
Table 2
Structural model fit indices.
| Index | Recommended criterion | Original value | Bootstrap-corrected value | Result |
|---|---|---|---|---|
| X² | The smaller, the better | 324.06 | 121.66 | Acceptable |
| df | — | 72 | 72 | — |
| X²/df (NC) | <3 | 4.50 | 1.69 | Satisfactory |
| RMSEA | <0.08 | 0.102 | 0.045 | Satisfactory |
| GFI | >0.90 | 0.89 | 0.99 | Satisfactory |
| AGFI | >0.80 | 0.84 | 0.96 | Satisfactory |
| NFI | >0.90 | 0.94 | 0.98 | Satisfactory |
| RFI | >0.90 | 0.92 | 0.97 | Satisfactory |
| IFI | >0.90 | 0.95 | 0.99 | Satisfactory |
| TLI | >0.90 | 0.93 | 0.99 | Satisfactory |
| CFI | >0.90 | 0.95 | 0.99 | Satisfactory |
Source: Authors’ contribution.
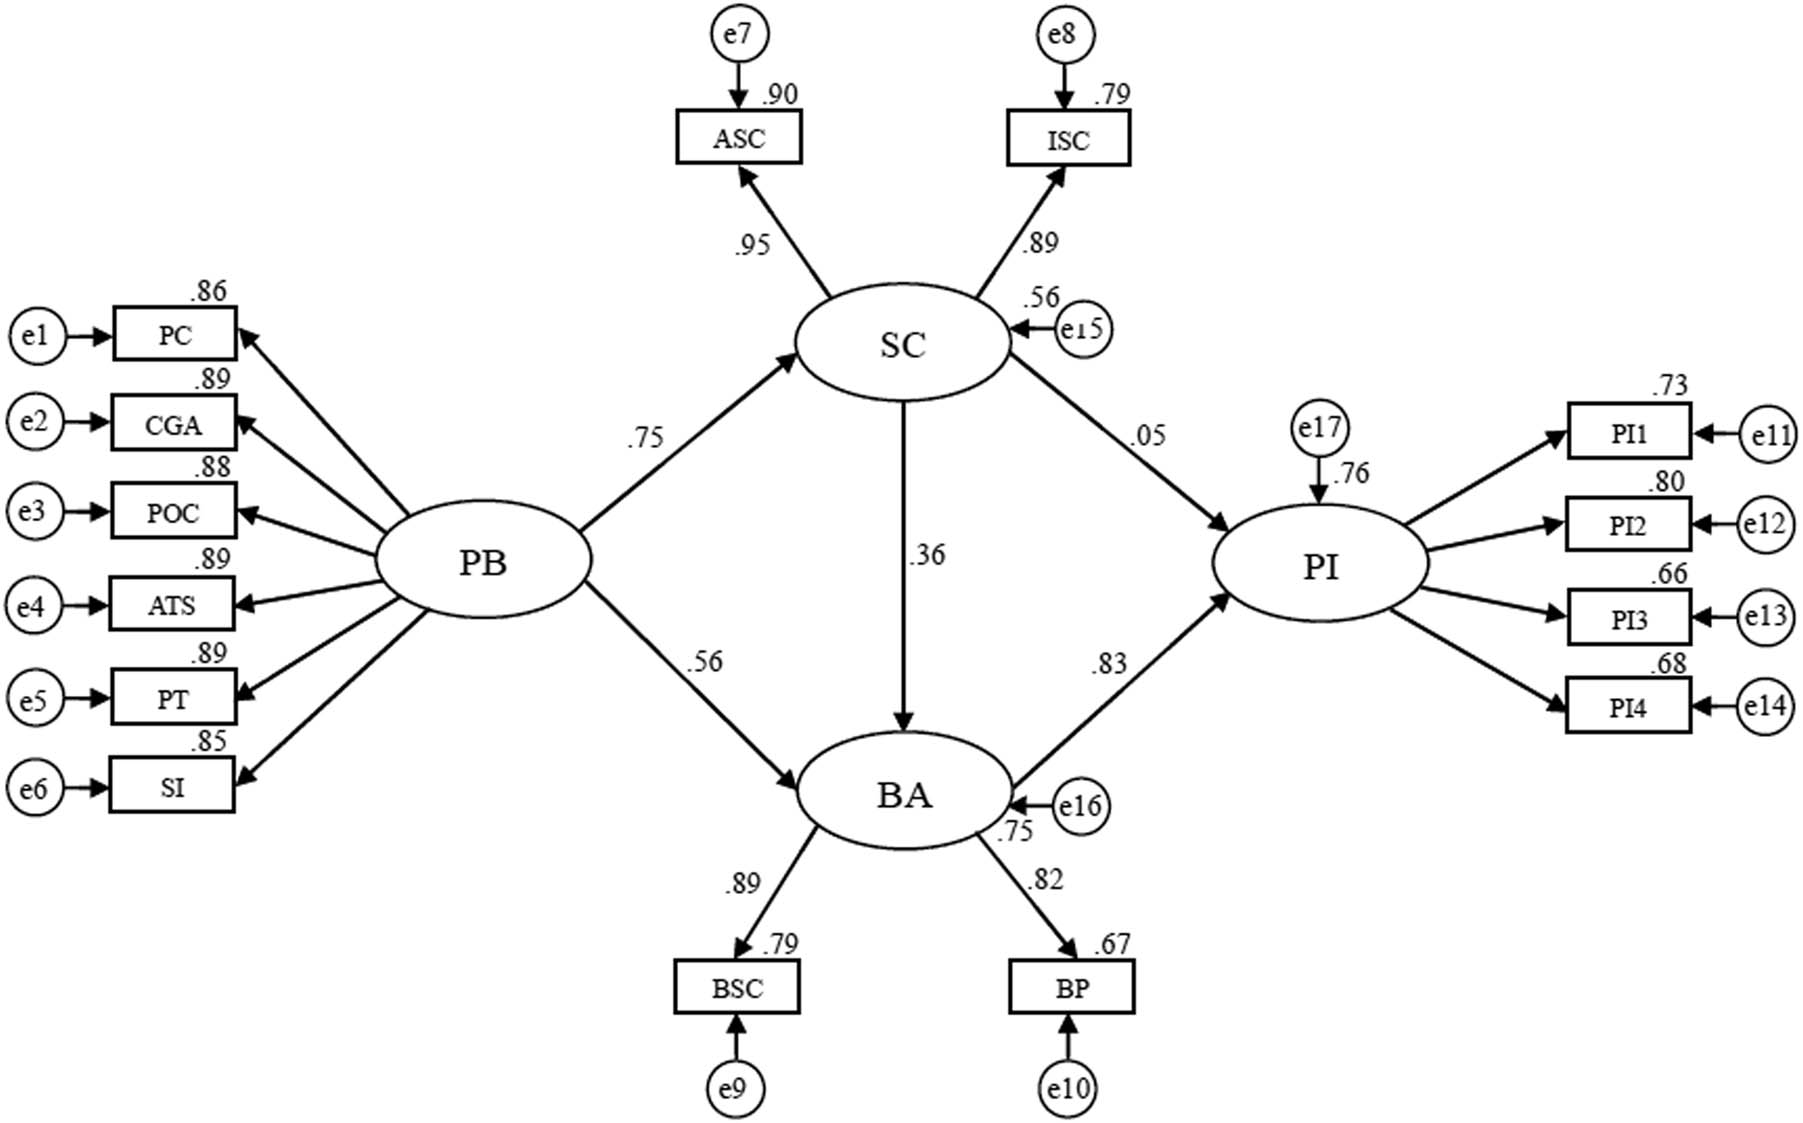
Figure 2
Structural path model. Note: PB, personal brand; SC, self-congruity; BA, brand attachment; PI, purchase intention.
Source: Authors’ contribution.
Table 3
Results of hypothesis testing.
| Hypothesis | Path | Standardized coefficient (β) | t-Value | p-Value | Result |
|---|---|---|---|---|---|
| H1 | PB → SC | 0.75 | 16.64* | <0.001 | Supported |
| H2 | PB → BA | 0.56 | 9.47* | <0.001 | Supported |
| H3 | SC → PI | 0.05 | 0.66 | 0.512 | Not Supported |
| H4 | BA → PI | 0.83 | 8.73* | <0.001 | Supported |
| H5 | SC → BA | 0.36 | 5.72* | <0.001 | Supported |
Note: PB, personal brand; SC, self-congruity; BA, brand attachment; PI, purchase intention. *p < 0.05.
Source: Authors’ contribution.
Table 4
Results of the split-sample robustness analysis.
| Path | Path coefficient difference (Δβ) | Two-Tailed p-value | Result |
|---|---|---|---|
| PB → SC | −0.008 | 0.923 | No significant difference |
| PB → BA | −0.001 | 0.554 | No significant difference |
| SC → PI | 0.057 | 0.660 | No significant difference |
| BA → PI | −0.055 | 0.654 | No significant difference |
| SC → BA | −0.001 | 0.594 | No significant difference |
Note: PB, personal brand; SC, self-congruity; BA, brand attachment; and PI, purchase intention.
Source: Authors’ contribution.