
1. Introduction
Attendance at sports events has been increasing in recent years, with rising participation rates in sports activities due to the globalization and diversification of sports events (Al-Buenain et al., 2024). Therefore, sports tourism has become a global social phenomenon that has experienced exponential growth in recent years (Jiang et al., 2025). Recently, UN Tourism (2025) indicated that the sports sector accounts for 10% of global tourism and has an annual growth rate of 17.5%. Sports events are integrated within sports services due to their heterogeneous and intangible characteristics; in addition, they are perishable, and consumption occurs simultaneously with their production (Bamford & Dehe, 2016). Each year, events of different scales take place, generating income in the localities; for example, in 2023, the Valencia Marathon generated a tourism expenditure of 31.3 million euros in the city of Valencia and the surrounding area (Benages & Maudos, 2024).
In recent years, a differentiation of the tourists is taking place that concerns the degree of support at sports events and their sense of community (Bouchet et al., 2011). Gibson (1998) distinguishes three categories in sports tourism: watching sporting events, visiting sports-related attractions, and active participation. In fact, sports event services have become one of the fastest-growing and most popular types of tourism in recent years (Malchrowicz-Mosko & Munsters, 2018), which can change the host destination, attracting visitors outside of the peak season (Rejón-Guardia et al., 2023), contributing to socioeconomic development and expanding and diversifying tourism services (Agorreta et al., 2020). Gkarane et al. (2025) analysed the factors that determine the growth in the organization of small-scale sporting events. They found that sports event managers think that this type of event has a positive economic impact and increases the social cohesion of the destinations.
Of the different definitions of sports events, Delpy (2003) states that they are those competitive sports activities that attract a large number of people to participate as athletes or attend as spectators (p. 8). Thus, sport event tourist behaviour is defined as the process where people identify, purchase, use, and arrange sport products and services related to sport events to satisfy their needs (Funk et al., 2008).
Getz (2003) considers sports events as one of the major components of sports tourism in relation to the number of tourists and the economic impact. Sport and tourism are two activities of enormous economic importance (Cabanilla et al., 2021). This fact is confirmed by a recent systematic review that concluded that organising more sporting events is the way to support the growth of sports tourism (Sudarmanto et al., 2025). For instance, the global turnover of the traditional race industry was around 4 billion (€) in 2019; this represents a 30.6% rise over the previous 5 years (Andersen, 2024). In Spain, the expenditure on sport-related services in 2021 was 4,395 million euros per year, where 68.4% of this expenditure was on recreational and sports services (Ministry of Culture and Sport, 2023), and in 2022, more than 1.7 million international tourists who visited Spain attended a sports show (Ministry of Culture and Sport, 2023).
The constant evolution of sport in society is generating greater opportunities for tourism development and tourist experiences (Higham & Vada, 2025). Therefore, it is important to analyse the factors that influence sport consumers’ behaviour when attending an event and repeating the experience (Deng & Pierskalla, 2011). Examples of these factors include destination image, word of mouth (WoM), service quality, satisfaction, and future intentions to consume this type of sport service. Moreover, it is important to further investigate the behaviour of passive tourists at sporting events, as research has shown that their perceptions can differ significantly from those of active tourists (participants). For example, Hallmann et al. (2010) found differences between passive and active sports tourists’ perceptions in the sport event’s image. Therefore, passive sport tourists-characterized by distinct motivational profiles, travel behaviours, and consumption patterns-warrant separate and specific investigation, rather than being examined through the same lens as active participants.
Furthermore, most previous research has concentrated on other competitive disciplines, such as athletics, often analysing recurring annual events like marathons or popular races (e.g., An & Yamashita, 2022; Xiao et al., 2020). In contrast, the present study centres on a multi-stage cycling event, a format that has received comparatively less scholarly attention despite its growing popularity and complex organizational structure. Finally, it should be noted that the existing literature on sporting events reveals a gap in the availability of standardized scales capable of evaluating different types of events according to their specific dimensions and objectives.
This study aims to build on existing research into sport tourism behaviour and the consumption of sport event services, with a particular focus on the profile of the sport tourist attending major sporting events. Specifically, on one hand, the study seeks to identify the key factors that influence the future behavioural intentions of these spectators when attending a major sporting event. On the other hand, to offer a specific, valid, and reliable survey that authors and sports event managers could use to assess sporting events of different scales with the same variables to better analyse possible differences. To this end, this research is approached from a first theoretical part with four sections that examine the relationships that comprise the model, a second methodological part that details the sample of participants, the instruments used, and the data analyses performed, and a third section dedicated to discussion, which integrates practical implications as well as limitations and future lines of work.
2. Theoretical Framework
The present study is grounded in the Stimulus–Organism–Response (S–O–R) framework (Mehrabian & Russell, 1974), which explains consumer behaviour as a process in which external environmental cues (stimuli) generate internal cognitive and affective evaluations (organism), which in turn shape behavioural responses. In sport tourism, this framework has been used to explain how event- and destination-related stimuli influence destination image, emotions, satisfaction, loyalty, and revisit intentions (Duan & Wu, 2024; Jeong, 2023; Zhang, 2022; Zhang et al., 2024). For example, Duan and Wu (2024) showed that environmental stimuli at small-scale sport events positively affect cognitive and affective destination image, which then predicts revisit intentions, while Jeong (2023) and Jeong et al. (2020) also support the relevance of internal psychological evaluations in explaining sport tourists’ post-consumption behaviour.
Based on this perspective, sporting events provide multiple external cues that may act as stimuli for tourists. In the context of this study, staff performance, communication, and electronic word-of-mouth constitute relevant social and informational stimuli because they shape how spectators interpret the event and the host destination. These cues are expected to influence tourists’ internal evaluations, particularly destination image and satisfaction. In turn, these organism variables should predict future behavioural intentions, understood here as spectators’ willingness to revisit, recommend, or maintain a favourable disposition toward the event and/or destination. This logic is consistent with prior sport tourism research showing that event-related stimuli affect destination image and that destination image and satisfaction are key antecedents of behavioural outcomes (Duan & Wu, 2024; Jeong et al., 2019; Jeong & Kim, 2020). Below, the different variables were explained in the sequence of S-O-R involvement.
3. Literature Review
3.1. Perceived Quality
Service quality is a constant factor, sustainable over time and difficult to modify, being one of the most interesting factors in the context of sports services management, even more so given the changing environment faced by organizations (Gálvez-Ruiz & Morales, 2015). In this way, Grönroos (1994, p. 38) defines perceived quality as “the result of a comparison between the perceived service and the expected service, where the consumer compares his expectations with his perception of the service received”. Previous studies have shown the importance of perceived service quality in the overall customer experience as a differentiating element in sports events (Byon et al., 2013). A broad understanding of the quality of sporting events is fundamental for fostering meaningful contributions to the tourism sector (Moon et al., 2011). For example, Vegara-Ferri et al. (2018), with tourism purposes, identified the perceived quality of sport events through two key factors, namely communication and staff.
In this regard, Jeong et al. (2019) evaluated tourists who attended a marathon in South Korea, and found statistically significant relationships between service quality, satisfaction, and loyalty to the destination. Tzetzis et al. (2014) also determined the influence of different aspects of perceived quality at a beach volleyball tournament in Greece on the satisfaction and future behaviour of spectators. Pérez-Bartolomé et al. (2016) also analysed the influence of different aspects of perceived quality in a non-competitive sports event on satisfaction and future intentions. In other sports services consumption contexts, several studies have shown that service quality is a key factor influencing the behavioural intentions of both active and passive tourists of sport events (Byon et al., 2013; Ma & Kaplanidou, 2018; Wang et al., 2023).
Other factors like effective communication have been recognised as a relevant antecedent of both the functional and technical quality of sporting events (Park et al., 2012). Therefore, this factor plays a relevant role in the tourism sector (Miao, 2015), making it essential to account for consumer-to-consumer communication when designing effective tourism marketing strategies. Furthermore, and thanks to the development of new technologies, electronic WoM has emerged as the primary means by which travellers obtain information about the quality of service and destinations during their journeys (Chevalier & Mayzlin, 2006). For these reasons, we have developed the following hypotheses:
H1. Staff have a positive and significant impact on communication.
H2. Staff have a positive and significant impact on electronic word-of-mouth.
H3. Staff have a favourable and significant impact on the destination image.
H4. Staff have a positive and significant impact on satisfaction.
H5. Communication positively and significantly influences electronic word-of-mouth.
H6. Communication positively and significantly influences the destination image.
H7. Communication has a positive and significant effect on satisfaction.
3.2. Electronic Word-of-Mouth
According to Zeithaml et al. (1996), who defined consumer loyalty as a customer’s propensity to speak favourably of a business to other customers, WoM is a part of consumer loyalty. However, the evolution and prevalence of new electronic communication channels, such as websites, specialized forums, or social networks, allow for different interaction options when sharing experiences (Bilgihan, 2016). Hennig-Thurau et al. (2004) define electronic WoM as “any positive or negative opinion made by current, potential or past consumers about a product or a company, accessible to a multitude of people and organizations through the Internet” (p. 39). Electronic WoM has become an essential factor in the current technological society, breaking the traditional face-to-face interaction for another form of communication characterized by non-simultaneity, anonymity, and the permanence in time of those opinions.
Therefore, the presence of a wider range of social media increases the importance of this factor, making electronic word-of-mouth a powerful tool that allows potential consumers to obtain information about a destination or an event, and to easily share their opinions and experiences through different social media (Jeong & Kim, 2019a). In this sense, WoM in the form of online reviews can positively affect sales (Chen et al., 2017), just as negative electronic WoM can have significant negative effects on an organization’s revenues (Balaji et al., 2016). Similarly, organizations can benefit from consumer interaction, with positive or negative information and feedback (Van Doorn et al., 2010). In the scientific literature, there is evidence of the influence of electronic word-of-mouth on decision-making (Córdova-Morán & Freixa, 2017), on the destination image (Yang et al., 2024), or on future consumer behaviour intentions (Silaban et al., 2023; Miao, 2015), so the following hypotheses are established:
H8. Electronic word-of-mouth has a positive and considerable impact on the destination image.
H9. Electronic word-of-mouth has a positive and significant effect on satisfaction.
H10. Electronic word-of-mouth has a favourable and large impact on future intentions.
3.3. Destination Image
Beerli and Martín (2004) describe the destination image as passengers’ destination perceptions. It can also be defined as a set of thoughts, expectations, ideas, or perceptions produced as a result of analysing individual features in a given region (Crompton, 1979). In this approach, a positive image of the destination influences not only the choice of an event or location, but also subsequent appraisal and future behavioural intention (Hallmann et al., 2015). Laradi et al. (2024) reported that cognitive and affective destination images have a large effect on the intention to return to the destination. Events can affect tourists’ revisit intentions and their verbal evaluations of the destination, possibly contributing to the evolution of its destination image (Lai, 2018) and are one of the most important antecedents for tourist satisfaction (Jeong & Kim, 2020). Therefore, the following hypothesis is established:
H11. Destination Image has a positive and significant influence on satisfaction.
3.4. Satisfaction and Future Intentions
Sports tourists’ satisfaction is the most important factor in developing a connection between the individual and the sports event or venue. Satisfaction can be described as the difference between expectations and perceptions of the quality of service received by the user (Shonk & Chelladurai, 2008). In other words, a customer’s pleasure is defined by the gap between their expectations and their assessment of the outcome (Aguado, 2015). Furthermore, it can elicit a desire to return to the location and/or participate in future versions of the sporting event. Moreover, if tourists are so satisfied with a destination, they are more willing to have stronger intentions to return to the destination and/or the sports event (Calabuig et al., 2015; Shonk & Chelladurai, 2008; Vassiliadis et al., 2021). Finally, future intentions are the final element considered in tourist perception models. This loyalty is fundamental in view of the continuous and growing competition, bringing about new forms of differentiation to achieve the retention and attraction of new tourists.
It is therefore essential for managers to understand what produces loyalty to fate (Gursoy et al., 2014). In line with previous research in sport services, loyalty may be understood as a component of future intentions rather than as a separate construct (Nuviala et al., 2014; Zeithaml et al., 1996). Previous literature found evidence related to the influence of satisfaction on loyalty (Deng et al., 2024; Jin et al., 2022; Kusumah & Wahyudin, 2024). The last hypothesis is established in this way:
H12. Satisfaction has a positive and significant influence on future intentions.
Lastly, Figure 1 presents the theoretical model of the study, which summarizes all the hypotheses based on the S–O–R framework and the relationships among the different variables discussed above related the different variables. This model has been used in previous research with participants in sporting events (Vergara-Ferri et al., 2020).
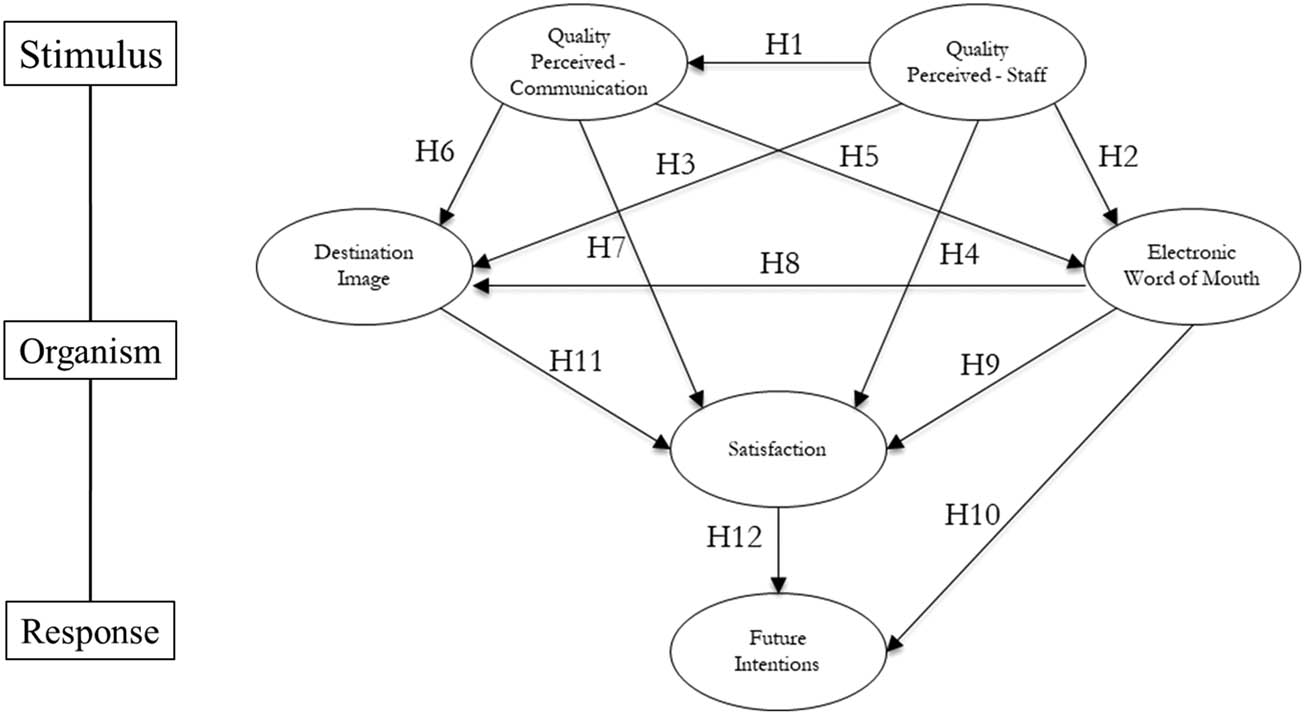
Figure 1
Research model.
Source: Authors’ contribution.
4. Methods
4.1. Sample Design and Data Collection
Using an observational cross-sectional design, A non-probability convenience sampling method was used to select the sample. The sample consisted of 152 tourists (56.6% men and 43.4% women) with a mean age of 38.7 years (±13.6), who participated in the sixth stage of La Vuelta, finishing in San Javier (Murcia, Spain); 59.2% of the participants were married or living with a partner, and 38.2% had a university degree. Regarding employment status, 52.6% were employed under contract, and 62.5% were physically active (Table 1). The information collection point was in a tent belonging to the University of Murcia, located 150 meters from the finish line of the stage. Before data collection, the research team informed organisers about the objectives of the study. Data collection was carried out by means of online surveys using tablets. A total of five trained interviewers participated in the process. They first reported on voluntary participation and the confidentiality of the responses. They then showed the informed consent form, which had a specific checkbox to confirm its reading before beginning the survey. The collection period was concentrated on the day of the event, between 11:00 and 18:30, and the questionnaires took about 10–11 minutes to complete.
Table 1
Sample demographic profile.
| Characteristics | Frequency | |
|---|---|---|
| N (152) | % | |
| Gender | ||
| Female | 86 | 56.6 |
| Male | 66 | 43.4 |
| Age (years) | ||
| 18 to 30 | 42 | 27.6 |
| 31 to 45 | 59 | 38.8 |
| 46 to 60 | 38 | 25.0 |
| More than 61 | 13 | 8.6 |
| Marital status | ||
| Single | 53 | 34.9 |
| Married/Cohabited | 90 | 59.2 |
| Divorced/Separated | 8 | 5.3 |
| Widowed | 1 | 0.7 |
| Education level | ||
| Elementary studies | 14 | 9.2 |
| Junior High School | 18 | 11.8 |
| Senior High School | 24 | 15.8 |
| Professional education | 22 | 14.5 |
| Graduated | 58 | 38.2 |
| Post graduated | 16 | 10.5 |
| Occupation | ||
| Self-employed | 14 | 9.2 |
| Employed | 80 | 52.6 |
| Student | 40 | 26.3 |
| Unemployed | 8 | 5.3 |
| Retired/Pensioner | 7 | 4.6 |
| Housekeeper | 3 | 2.0 |
| Practice physical activity | ||
| Yes | 95 | 62.5 |
| No | 57 | 37.5 |
Source: Authors’ contribution.
4.2. Measures
The instrument used in this study is based on Vegara-Ferri et al. (2018), and it consists of 18 items distributed in six factors to assess the touristic impact of sporting events: quality perceived – staff (3 items), quality perceived – communication (3 items), electronic word-of-mouth (4 items), destination image, satisfaction (3 items each), and future intentions (2 items). In this study, the ratio of cases to variables is greater than 8:1, exceeding the 5:1 range recommended by Worthington & Whittaker (2006). Participants needed to mark their level of agreement with each statement on a 7-point Likert scale, ranging from 1 (completely disagree) to 7 (completely agree). Additionally, a first section was included to identify the following specific characteristics of the sample: gender, age, marital status, education level, occupation, and practice of physical activity. This questionnaire has been previously used in a small sports event (Vegara-Ferri et al., 2020), and all measurement items have been validated, and the results showed adequate psychometric properties of the measurement model. Table 2 provides detailed information about the items and reports the factor loadings, composite reliability, and validity.
Table 2
Measurement items, construct reliability and convergent validity.
| Abbreviations | Dimensions and items | Mean | SD | λ | |
|---|---|---|---|---|---|
| Quality Perceived – Communication (α = 0.74; CR = 0.76; AVE = 0.51) | |||||
| COM1 | The organization of the event provided me with a reliable, consistent, and dependable service | 6.21 | 1.07 | 0.611 | |
| COM2 | I had updated information about the event/participants/teams | 6.33 | 1.02 | 0.746 | |
| COM3 | The information about this event was easy to get | 6.17 | 1.04 | 0.775 | |
| Quality Perceived – Staff (α = 0.74; CR = 0.76; AVE = 0.51). | |||||
| STF4 | The event staff and the volunteers were competent | 5.99 | 1.21 | 0.705 | |
| STF5 | Staff behaviour was pleasant | 5.76 | 1.42 | 0.746 | |
| STF6 | The staff linked to the event made an effort to understand my needs and helped me with the questions I asked | 6.06 | 1.05 | 0.686 | |
| Electronic Word of Mouth (α = 0.79; CR = 0.83; AVE = 0.62) | |||||
| eWOM7 | Advertising of this event online was the key to choose this destination | 5.36 | 1.79 | 0.887 | |
| eWOM8 | I consulted and valued the comments and opinions I have read online when it came to choosing this destination | 5.23 | 1.79 | 0.838 | |
| eWOM10 | I search or I will search for publications by other attendees of this event on social networks | 4.95 | 1.96 | 0.609 | |
| Destination Image (α = 0.83; CR = 0.84; AVE = 0.64) | |||||
| DIM11 | There are good opportunities to enjoy free time and entertainment in the destination | 5.89 | 1.32 | 0.759 | |
| DIM12 | The destination offers interesting places to visit | 5.89 | 1.29 | 0.870 | |
| DIM13 | As a tourist destination, the place offers good value for money | 5.91 | 1.18 | 0.771 | |
| Satisfaction (α = 0.81; CR = 0.80; AVE = 0.57) | |||||
| SAT14 | I am having a good time attending this event | 6.14 | 1.07 | 0.823 | |
| SAT15 | I really enjoy attending sports events | 6.21 | 1.09 | 0.757 | |
| SAT16 | I think having free time and fun are important when it comes to choosing | 6.24 | 1.05 | 0.683 | |
| Future Intentions (α = 0.71; CR = 0.72; AVE = 0.56) | |||||
| FI17 | I am going to recommend this destination to my friends and relatives | 6.14 | 1.10 | 0.796 | |
| FI18 | If I had the opportunity to attend a similar sports event, I would repeat the experience | 6.32 | 1.12 | 0.696 | |
Note: all items are measured with a 7-point Likert scale anchoring strongly disagree (1) and strongly agree (7). SD = Standard Deviation, λ = item loadings, α = Cronbach’s alpha, CR = Composite Reliability, AVE = average variance extracted.
Source: Authors’ contribution.
4.3. Data Analysis
The software SPSSv21.0 was used to conduct certain analyses, including descriptive data for quantitative variables (means and standard deviations), data normality (skewness and kurtosis), and internal consistency with Cronbach’s alpha (C-α). The program AMOS was used to analyse the measurement model and test the postulated relationships. The dimensionality of the measures was investigated using confirmatory factor analysis (CFA) with the maximum likelihood (ML) estimation method (Byrne, 2000). In addition, composite reliability (CR) and average variance extracted (AVE) were calculated to assess the measurement model’s reliability and validity, and discriminant validity was determined using the criteria proposed by Hair et al. (2009).
5. Results
5.1. Descriptive Analysis
We performed descriptive analysis and data normality (univariate skewness and kurtosis) with values less than criteria 3 and 7, respectively (Marôco, 2014), indicating normality for the structural equation model (SEM). There were no missing values in the data, and descriptive statistics revealed no deviations from univariate normality. According to Carretero-Dios and Pérez (2005), all items except eWOM10 (M = 4.95) had a mean value above the middle point of the scale, and the standard deviation was greater than one in all cases, indicating that the data were normal.
5.2. Measurement Model Assessment
A CFA was initially performed to ensure the scales’ validity and measurement quality (Anderson & Gerbing, 1988). The sample size chosen is appropriate for low-complexity models, exceeding the required minimum ratio of 10:1 (Kline, 2005; Worthington & Whittaker, 2006). The original model’s CFA showed poor goodness-of-fit statistics: χ 2(120) = 304.26; χ 2/df = 2.53; RMSEA = 0.101 (CI = 0.087, 0.115); CFI = 0.87; IFI = 0.87; TLI = 0.83; PCFI = 0.68. The χ 2/df was below the minimum acceptable value of 3.0 (Kline, 2005), but other indices suggested insufficient adjustment (Hu & Bentler, 1999; Arbuckle, 2008).
A first inspection of the reliability of the construct indicators showed that the loads of all the elements are adequate and were statistically significant to provide evidence that each item appropriately fitted its respective factor, except a load of electronic WoM that is less than 0.60 (Wang & Wang, 2012), specifically λ = 0.411 (eWOM9; “Reading negative comments on the internet influences my decision to attend the event”), so its elimination is recommended. After this initial depuration, the CFA showed adequate goodness-of-fit indexes and suggested that the model is coherent with the data: χ 2(102) = 215.70; χ 2/df = 2.11; RMSEA = 0.081 (CI = 0.070, 0.085); CFI = 0.92; IFI = 0.92; TLI = 0.90; PCFI = 0.73).
To assess common method bias (CMB), both exploratory and confirmatory approaches were conducted. In the first case, Harman’s single-factor test identified 3 factors with eigenvalues greater than 1, with the first factor explaining 36.80% of the variance (below the 40% threshold). In the second case, a common latent variable was introduced into the measurement model, but no loadings were significant. These results suggest that there is no strong CMB.
Cronbach’s α scores range from 0.72 to 0.83, over the 0.7 threshold (Marôco & Marques, 2006). The CR and AVE satisfied the requirements proposed by Hair et al. (2014), and no cross-loading was observed, indicating convergent dependability (Gefen & Straub, 2005). Hair et al. (2009) investigated discriminant validity by comparing the squared root of each construct’s AVE to its parallel correlations. Thus, the square roots of the AVE values outperformed their relationships with other constructs Fornell and Larcker (1981) criterion (Table 3).
Table 3
Discriminant validity analysis (Fornell–Larcker criterion).
| (1) | (2) | (3) | (4) | (5) | (6) | |
|---|---|---|---|---|---|---|
| Quality perceived – Staff | (0.51) | |||||
| Quality perceived – Communication | 0.42 | (0.51) | ||||
| Electronic Word of Mouth | 0.23 | 0.29 | (0.62) | |||
| Destination image | 0.39 | 0.36 | 0.28 | (0.64) | ||
| Satisfaction | 0.48 | 0.49 | 0.30 | 0.53 | (0.57) | |
| Future intentions | 0.45 | 0.49 | 0.35 | 0.52 | 0.46 | (0.56) |
Note: Values on the diagonal are AVE values, while the off-diagonal values are squared correlations between the constructs.
Source: Authors’ contribution.
5.3. Measurement Model Assessment
A SEM analysis was then performed to determine the link between the various constructs. First, the degree of linear dependency of the indicators was assessed, yielding variance inflation factors ranging from 1.33 to 2.31, demonstrating that collinearity is not an issue in our measurement approach (Gujarati & Porter, 2009). The model had a satisfactory overall fit, with all indexes within an acceptable range: χ 2(105) = 217.66; χ 2/df = 2.07; RMSEA = 0.084 (CI = 0.068, 0.088); CFI = 0.92; IFI = 0.92; TLI = 0.91; PCFI = 0.72). All R 2 values were more than 0.40, demonstrating predictive accuracy (Henseler et al., 2009) (Table 4).
Table 4
Path estimates.
| Path | Estimate | t Statistic | p-Value | Hypotheses |
|---|---|---|---|---|
| Staff → Communication | 0.748 | 5.325 | <0.001 | H1: supported |
| Staff → Electronic Word of Mouth | 0.181 | 1.037 | 0.300 | H2: not supported |
| Staff → Destination image | 0.341 | 2.252 | 0.024 | H3: supported |
| Staff → Satisfaction | 0.173 | 1.534 | 0.125 | H4: not supported |
| Communication → Electronic Word of Mouth | 0.404 | 2.292 | 0.022 | H5: supported |
| Communication → Destination image | 0.183 | 1.099 | 0.272 | H6: not supported |
| Communication → Satisfaction | 0.125 | 1.149 | 0.250 | H7: not supported |
| Electronic Word of Mouth → Destination image | 0.253 | 2.456 | 0.014 | H8: supported |
| Electronic Word of Mouth → Satisfaction | 0.077 | 0.931 | 0.352 | H9: not supported |
| Electronic Word of Mouth → Future intentions | 0.030 | 0.741 | 0.733 | H10: not supported |
| Destination image → Satisfaction | 0.603 | 6.663 | <0.001 | H11: supported |
| Satisfaction → Future intentions | 0.913 | 8.759 | <0.001 | H12: supported |
Source: Authors’ contribution.
The results partially support the hypotheses raised. The findings show that staff had a significant influence on communication and destination image, supporting H1 (β = 0.748, p < 0.001) and H3 (β = 0.341, p < 0.05) with a positive effect. However, the influence of staff was lower and not significant in electronic Word-of-Mouth (β = 0.181, p = 0.300) and satisfaction (β = 0.173, p = 0.125), not confirming H2 and H4. In the case of communication (H5, H6, and H7), the results showed a positive and significant influence on electronic Word-of-Mouth (β = 0.404, p < 0.05) but not on destination image (p = 0.272) and satisfaction (p = 0.250), confirming only H5. Of the three electronic Word-of-Mouth hypotheses, H9 (p = 0.352) and H10 (p = 0.753) were not confirmed, while H8 was supported at a significant level (β = 0.253, p < 0.05). Finally, H11 (β = 0.603) and H12 (β = 0.913) are supported; both had a significant and positive effect (p < 0.001). Figure 2 shows the graphic representation of the models with their coefficients.
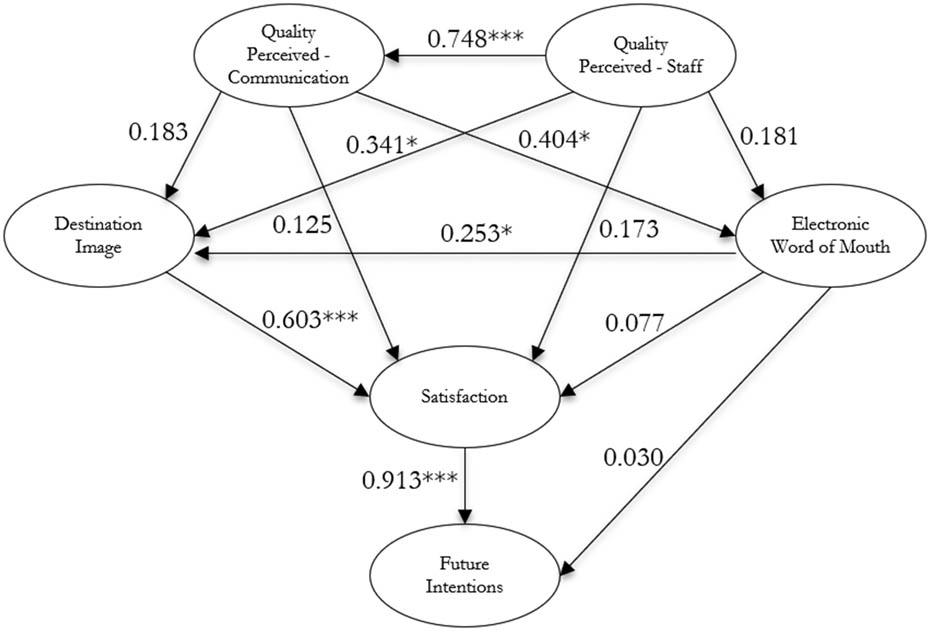
Figure 2
Model SEM coefficients and relations between variables.
Source: Authors’ contribution.
6. Discussion
This study analysed the factors that influence the future intentions of tourists that attending a major sporting event as spectators. To this end, the psychometric properties were determined using CFA to check that the scale followed the same structure and dimensionality as the study carried out by Vegara-Ferri et al. (2020) on a small-scale sports event, finding certain differences between the psychometric qualities as described below. Despite the similarities between the two studies, it is important to highlight the clear differences between them. The study by Vegara-Ferri et al. (2020) analysed a regular, small-scale sporting event focused on active and amateur mass-participation running races. In contrast, La Vuelta (the event analysed in this study) is an international event (one of the three major stage cycling tours) which visits different locations each year and whose target audience is passive participants (spectators), as the active participants are all professionals.
Based on these differences, it is important to mention that within the literature on sporting events, there is a gap in the existence of scales that allow for the evaluation of different types of events according to their dimensionality and objective. It is common to find a multitude of scales for evaluating different types of sporting events, where authors develop them ad hoc for each event, as identified by Vegara-Ferri (2022). Therefore, it is important to establish a common scale for different types of events and their participatory nature, which will subsequently allow new internal or external variables to be introduced to address the differences between different sporting events.
The reliability analysis based on C-α are considered reasonable, with values between 0.74 and 0.83, slightly lower than those reported in Vegara-Ferri et al. (2020), with the destination image dimension being the one that obtained the highest value in both studies. The CFA showed a low factorial loading for item eWOM9 (λ = 0.411), so it was excluded, thus obtaining an appropriate adjustment. Additionally, adequate composite reliability and convergent validity were verified for all dimensions, although the values obtained were lower than those reported by Vegara-Ferri et al. (2020), the discriminant validity was accepted.
The most important finding of the research is the relationships between the different dimensions. Of the 12 hypotheses raised in the model, the results showed support for 6, namely H1, H3, H5, H8, H11, and H12. These results differ from the study carried out in small-scale sports events, where 8 hypotheses were accepted (with the exception of H5, which was rejected) in addition to hypotheses H4, H6, and H10. More specifically, Staff showed a significant influence on communication (H1) and destination image (H3), but not on satisfaction (H4; p = 0.125), which was accepted at small-scale events where interaction with staff is much greater than at large events where contact is usually lower or the attention to the participants isn’t as personalized due to the characteristics of the event. On the contrary, Kim et al. (2016) found in a motor event that staff had a significant influence on electronic Word-of-Mouth but not on destination image, so that the staff of a sports event is a fundamental element in the development of any sports service (Angosto et al., 2016). The results of this study confirmed the positive and significant influence of the communication dimension on electronic Word-of-Mouth, contrary to the results obtained by Vegara-Ferri et al. (2020), where they also obtained a significant relationship with destination image. Due to the fact that it is a smaller event, with less popularity and media impact, those interested in attending are more supported and influenced by the opinion of other consumers through the Internet than in a larger city. Regarding the non-influence of communication on destination image, it may be because the promotion is focused on the sports event and not on the location where it is held.
In terms of electronic Word-of-Mouth, technological advancements are a critical component of promotion and marketing for any service in today’s digital society, particularly when considering the Internet-of-Things (IoT; Lo & Campos, 2018) or mobile applications and social media (Shareef et al., 2019), which organizations are leveraging to reach out to the masses (Hanna et al., 2011). This component has a significant impact on the image due to the opinions and comments of prior customers left on the website or through social media. The findings validate the hypothesis that electronic Word-of-Mouth has a favourable and significant influence on destination image, which is consistent with prior research (Córdova-Morán & Freixa, 2017; Vegara-Ferri et al., 2020; Yang et al., 2024). However, electronic Word-of-Mouth did not show a significant influence on satisfaction (H9) and future intentions (H10), as did Miao (2015) on Chinese tourists in Thailand and Vegara-Ferri et al. (2020) at small-scale events. The destination image dimension did show a significant influence on satisfaction (H11), confirming the results obtained by other studies on large and small events (Elahi et al., 2020; Jeong & Kim, 2020; Swart et al., 2018; Vegara-Ferri et al., 2020), contrary to what Kaplanidou & Vogt (2007) found in a sample of active sports tourists whose purpose for travel was participation in a sports event.
Finally, H11 established the influence of satisfaction on future intentions, obtaining the highest relationship of those analysed in the present work, as it happened in the models analysed by other works (e.g., Calabuig et al., 2015; Elahi et al., 2020; Jeong & Kim, 2019b; Plunkett & Brooks, 2018; Prayag & Grivel, 2018; Vegara-Ferri et al., 2020). Thus, the future intentions is equivalent to the success of the event consumed by the tourist, although other previous studies found no relationship (Brown et al., 2018; Kaplanidou & Vogt (2007).
Thus, this study offers several theoretical implications. Firstly, it underscores the significance of the relationship between key variables within the context of sport management and event tourism. The study highlights the crucial role of event staff in shaping both communication and the destination image as perceived by passive sport tourists. Furthermore, communication emerges as a key factor in generating word-of-mouth, which, in turn, significantly influences the perceived image of the destination. The findings also demonstrate that the destination image held by passive tourists has a strong impact on their satisfaction levels, which subsequently affect their future behavioural intentions. Second, it emphasizes the distinctions between active and passive sport tourists, reinforcing the need to consider them as separate categories within sport tourism research. Finally, it demonstrates that the applied measurement scales are valid tools for evaluating sporting events of varying scales and objectives.
7. Conclusions
From a theoretical perspective, the findings support a relational view of sport tourist behaviour, suggesting that event-related stimuli do not translate uniformly or directly into behavioural intentions. Instead, destination image and satisfaction emerge as key internal mechanisms linking external cues to future intentions. This pattern is consistent with the S–O–R framework, in which staff, communication, and electronic WOM act as stimuli, destination image and satisfaction as organism variables, and future intentions as the final response. Moreover, the strongest paths in the model (destination image – satisfaction and satisfaction – future intentions) indicate that behavioural outcomes are mainly explained through internal evaluations rather than through the direct effects of all service-related dimensions.
From a practical perspective, the results of this research reveal the most influential factors on sport event tourists, which the managers of this typology of events must be aware of in the elaboration of recruitment strategies, to guide the offer of the services, enabling them to increase the future intentions to recommend services at the sport event. In addition, sports event managers must train and pay attention to the staff and volunteers that are part of the organization. Volunteers are one of the agents who have the most contact with consumers, and therefore they are fundamental in the perception of the image and communication of the service. Similarly, the electronic word-of-mouth generated by the experience is influential in the destination image, which plays an important role in the opinion of consumers of large sports events and their satisfaction. This fact guides us towards the importance of analysing everything that happens (content) both on the event’s website and on the social media associated with it, as they are new forms of communication and generate a large amount of content that each time has more importance in information and decision-making.
7.1. Limitations and Future Research Directions
Different limitations have been identified that give rise to future study lines. First, this study includes a small sample size, despite the fact that it is a large sports event with much higher spectator attendance than the one analysed. The duration of a cycling event in a locality is relatively short, so interviewers had very limited time for data collection on the day of the event. Moreover, it would be useful for future research to test the study model with data from more and different types of stages, as it is a three-week event that visits a new city every day. Another limitation is the possible selection bias (Kim et al., 2016) associated with the sampling used, which prevents generalization of results. To mitigate this issue, interviewers were instructed to collect surveys from diverse population groups, ensuring a proportional representation of attendees based on gender and age. Future studies should replicate the scale at larger sports events where the timing at the venue is greater and where tourists stay longer. Finally, another future study could be the evaluation of sustainable sport tourism at events and the impact of their visit on the event and the destination. Analysing the potential environmental and social impacts of events on host destinations can significantly enhance our understanding of passive tourist behaviour. This, in turn, may contribute to the development of more effective strategies for tourism planning and event management.
Acknowledgments
All contributors who do not meet the criteria for authorship should be listed in the Acknowledgments section.
Funding information
The publication is part of grant JDC2022-048886-I, funded by MCIN/AEI/10.13039/501100011033 and by the European Union “NextGenerationEU”/PRTR.
Author contributions
José Miguel Vegara-Ferri: conception and design of the study, acquisition of data; Pablo Gálvez-Ruiz: analysis and interpretation of data, manuscript preparation; Salvador Angosto: conception and design of the study, acquisition of data, analysis and interpretation of data, obtaining funding; Aurora María García-Vallejo: analysis and interpretation of data, manuscript preparation.
Conflict of interest statement
The authors declare no competing interest.
Ethics approval and informed consent
This study received ethical approval from the Ethics Committee of the University of Murcia (ID: 2024/130). Additionally, informed consent was obtained from all participants.
Data availability statement
Data is availability under request to corresponding author.