
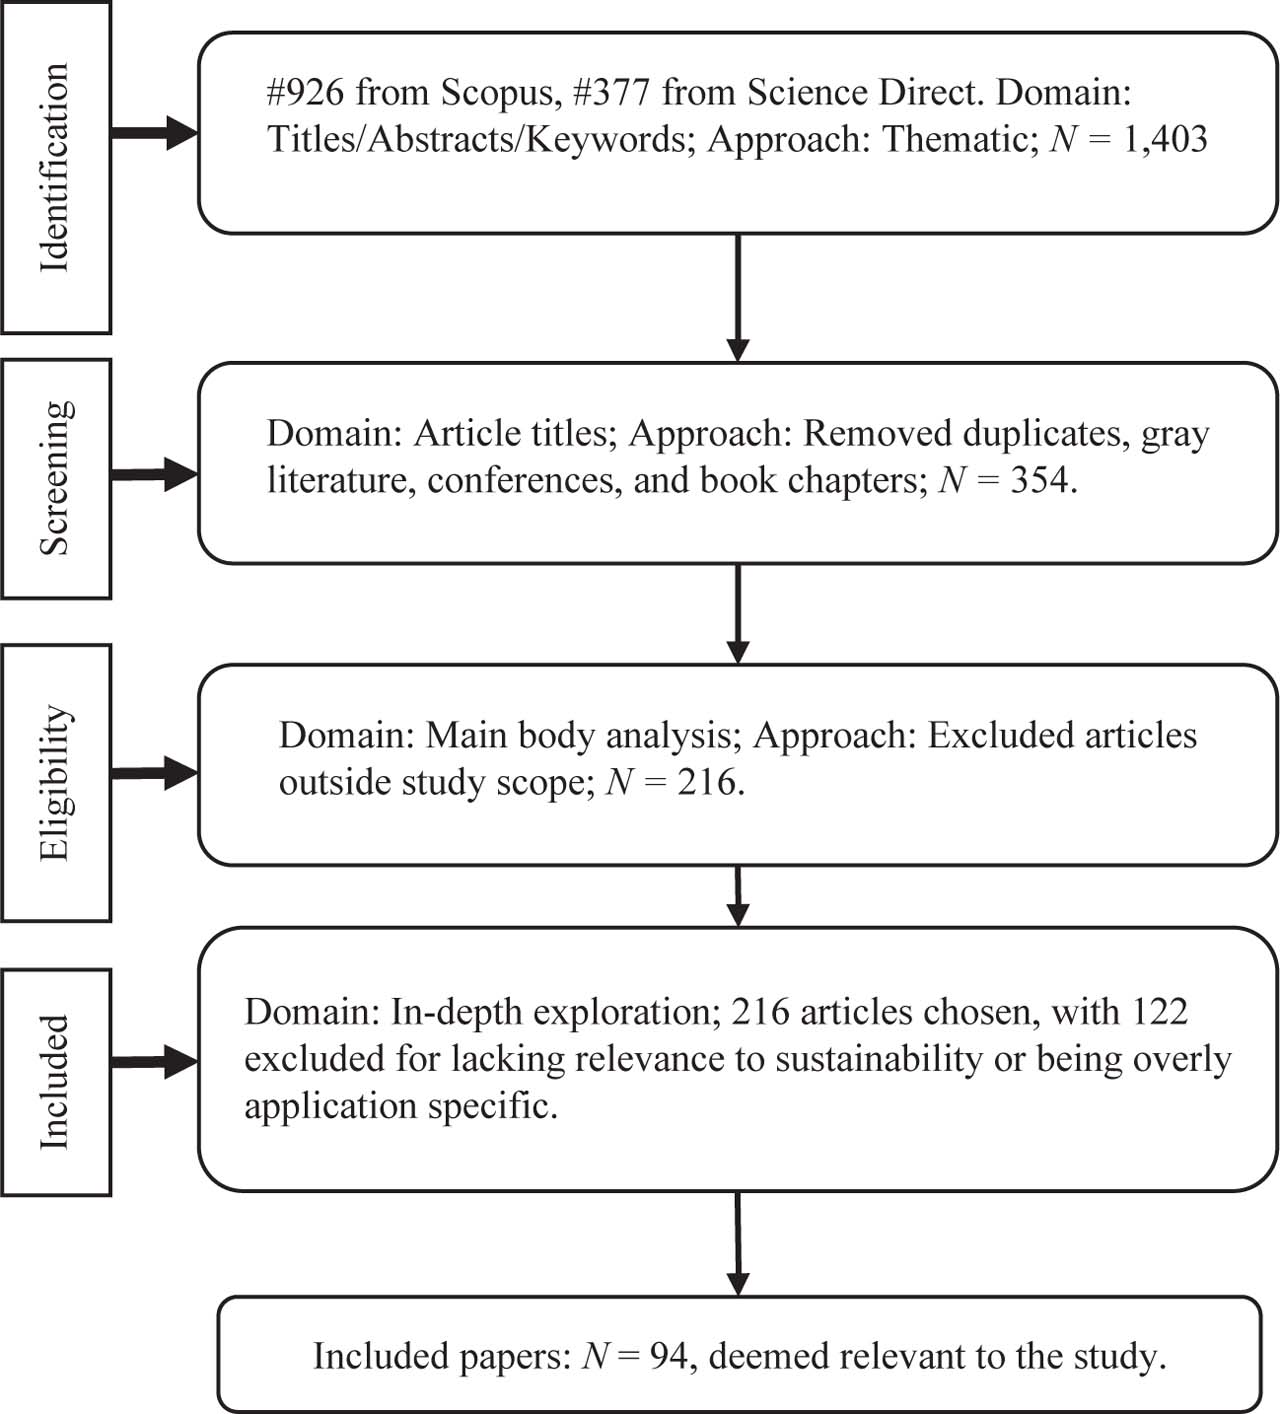
Fig. 1:
Search and selection of journal articles.
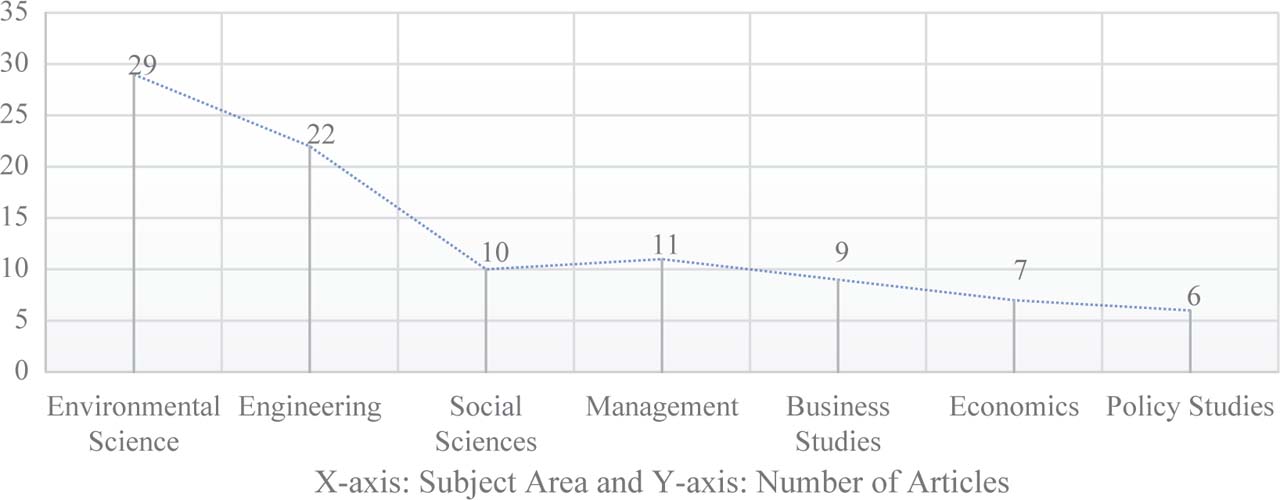
Fig. 2:
Distribution of articles across subject areas in ESCWM. ESCWM, environmental sustainability and construction waste recycling.
Tab. 1:
Construction waste challenges and research findings in various countries.
| Country | Researcher | Issues/findings |
|---|---|---|
| UAE | Bialko (2023) | Examines the gap between theory and practice in waste management, ranking factors by company size. Work culture has the highest impact; larger companies understand WR strategies better. |
| Batikha et al. (2023) | Focuses on materials and waste management in the UAE cement industry, aiming for net-zero carbon by 2050. Provides recommendations for decarbonisation. | |
| Malaysia | Rahim et al. (2017) | Links increased construction waste volume to illegal dumping |
| Kupusamy et al. (2019) | Prediction for 2016 in Peninsular Malaysia: 63,101.93 metric tonnes of CnD waste generated in residential constructions. | |
| Shah et al. (2021) | Construction waste contributes to drainage congestion and flash floods in Johor city. | |
| United States of America | Nowak et al. (2019) | In 2018, CnD activities led to the disposal of approximately 46 million tonnes of waste in US landfills. |
| In the US, 85% of all CnD waste consisted of concrete and asphalt. | ||
| Bangladesh | Islam (2016) | In Bangladesh, a substantial portion (85%–90%) of CnD waste is openly disposed of in landfills, posing a threat to sustainable development and ecological balance. |
| India | Borrelle et al. (2020) | India generates 150 million tonnes of CnD waste annually. |
| Gupta (2018) | CnD waste, particularly road dust, is a significant contributor to urban pollution, accounting for 56% of total particles and 38% of harmful inhalable subatomic particles. | |
| China | Chen (2018) | China produces a staggering 1.8 billion tonnes of construction waste annually, with a recycling rate of less than 5%. |
| Wang et al. (2020) | The substantial amount of CnD waste generated has severe environmental consequences, including raw material consumption, energy use and green-house gas emissions. | |
| Hong Kong | Yu et al. (2021) | Most of Hong Kong’s construction waste is solid inert and non-inert waste from excavation, site work, demolition and civil projects. Sustainable growth requires alternatives to land reclamation for disposing of inert waste. |
| Thailand | Thongkamsuk et al. (2017) | In 2014, Thailand generated approximately 4,200,595.85 tonnes of construction-related waste, resulting in significant environmental impact. |
| Brazil | Massara (2018) | CnD waste in Brazil exceeds urban solid waste and constitutes about 60% of the nation’s total waste. |
| Iraq | Abdulaali et al. (2023) | Reviews challenges in managing construction waste, emphasising the need for better integration of waste management with green building systems. |
| Saudi Arabia | Almadhi et al. (2023) | Evaluates plastic waste management, recommending a diversified approach with environmental benefits from renewable energy. |
| Oman | Dawood and Alsiyabi (2023) | Rapid urban growth and regulatory changes create construction waste issues. Be’ah plans to use debris for road construction, informing policy recommendations. |
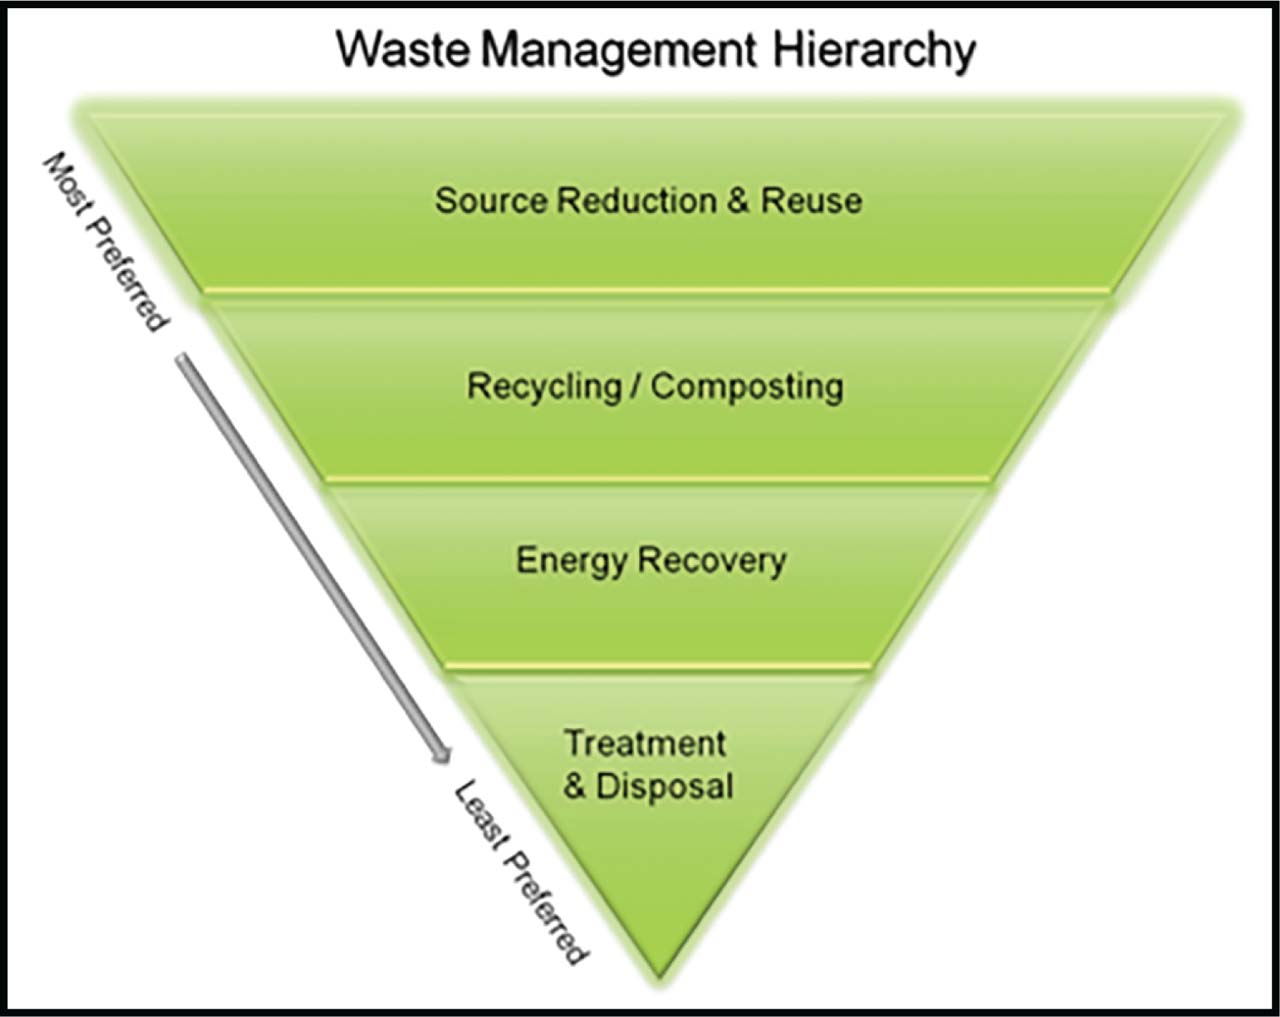
Fig. 3:
Waste management hierarchy (Kabirifar et al. 2020).
Tab. 2:
Compilation of key ES factors emanating from a thorough review of existing literature.
Tab. 3:
Key measurement items for WR.
| Factors | References |
|---|---|
| 1. Source segregation | Akanbi et al. (2018); Ibrahim et al. (2022); Yaashikaa et al. (2022); Bialko (2023); Saleh et al. (2024) |
| 2. Material efficiency | |
| 3. Waste audit programmes | |
| 4. Reuse of materials | |
| 5. Minimisation practices | |
| 6. RI | |
| 7. Employee training | |
| 8. Environmental regulations |
Tab. 4:
Key measurement items for RI.
| Factor | References |
|---|---|
| 1. Availability of recycling facilities | Akanbi et al. (2018); Francis and Thomas (2020); Wang et al. (2020); Mashingaidze (2024) |
| 2. Accessibility of recycling centres | |
| 3. Proximity to RI | |
| 4. Adequacy of recycling equipment | |
| 5. Investment in recycling technology | |
| 6. Integration of recycling facilities | |
| 7. Recycling capacity and throughput | |
| 8. Public awareness of recycling options |
Tab. 5:
Key measurement items for RC.
| Factor | References |
|---|---|
| 1. Adherence to local waste management regulations | Calvo et al. (2015); Hongyu et al. (2020); Gaur et al. (2022); Dawood and Alsiyabi (2023) |
| 2. Compliance with environmental standards | |
| 3. Legal requirements for recycling practices | |
| 4. Government oversight and enforcement | |
| 5. Compliance with WD laws | |
| 6. Documentation and record-keeping for compliance | |
| 7. Environmental audits and inspections | |
| 8. Penalties and consequences for non-compliance |
Tab. 6:
Key measurement items for RC.
| Factor | References |
|---|---|
| 1. Efficient resource utilisation | Islam (2016); Jain et al. (2023); Onyekwere (2023); Qiu and Chen (2023); Lodhi et al. (2024); Pietocha (2024); Rasaq and Serag (2024) |
| 2. Sustainable procurement | |
| 3. Energy-efficient practices | |
| 4. Water management | |
| 5. Use of recycled materials | |
| 6. Sustainable timber sourcing | |
| 7. Eco-friendly equipment | |
| 8. Environmental compliance |
Tab. 7:
Key measurement items for CE.
| Factor | References |
|---|---|
| 1. Use of low-emission technologies | Pires et al. (2011); Aslam et al. (2020); Shooshtarian et al. (2022); Bialko (2023) |
| 2. Alternative energy sources | |
| 3. Energy-efficient building designs | |
| 4. Renewable energy integration | |
| 5. Fuel-efficient transportation | |
| 6. Carbon offsetting practices | |
| 7. Emissions monitoring and reporting | |
| 8. Carbon credits and trading |
Tab. 8:
Key measurement items for WD.
| Factor | References |
|---|---|
| 1. Diversion rate | Zhao et al. (2021); Alnaqbi and Alami (2023); Maalouf and Mavropoulos (2023); Trivedi et al. (2023) |
| 2. Source separation practices | |
| 3. Diversion programmes | |
| 4. RI | |
| 5. Waste-to-energy conversion | |
| 6. Landfill diversion practices | |
| 7. Waste sorting technologies | |
| 8. Public participation |
Tab. 9:
Key measurement items for ESCWM.
| Factor | References |
|---|---|
| 1. Reduction of environmental impact | Shen et al. (2020); Alnaqbi and Alami (2023); Anyanwu et al. (2023); Qiu and Chen (2023); Saradara et al. (2023); Pietocha (2024) |
| 2. Efficient resource utilisation | |
| 3. Reduction in carbon footprint | |
| 4. Conservation of natural resources | |
| 5. Decreased waste to landfills | |
| 6. Compliance with environmental regulations | |
| 7. Community and stakeholder satisfaction | |
| 8. Economic sustainability |
Tab. 10:
Key measurement items for EOHP.
| Factor | References |
|---|---|
| Public awareness: evaluate community awareness of construction waste recycling and its environmental impact. | Massara (2018); Marut et al. (2020); Abdu (2021); Maués et al. (2021); Naser and Pearce (2022); Alnaqbi and Alami (2023); Batikha et al. (2023); Bialko (2023); Jain et al. (2023); Onyekwere (2023); Soto-Paz et al. (2023); Lodhi et al. (2024); Rasaq and Serag (2024) |
| Participation in recycling programmes: measure the engagement of local residents in recycling initiatives for sustainable waste management. | |
| Development of recycling-supportive community: assess the community’s active support for and encouragement of recycling practices. | |
| Social consensus building: gauge the effectiveness of EOHP in fostering social consensus on the importance of recycling. | |
| Community involvement in decision-making: evaluate the extent of community participation in decisions related to waste recycling. | |
| Building environmental awareness: measure the effectiveness of EOHP in building awareness about the environmental impact of construction waste. | |
| Participation in recycling programs: measure the engagement of local residents in recycling initiatives for sustainable waste management. |