
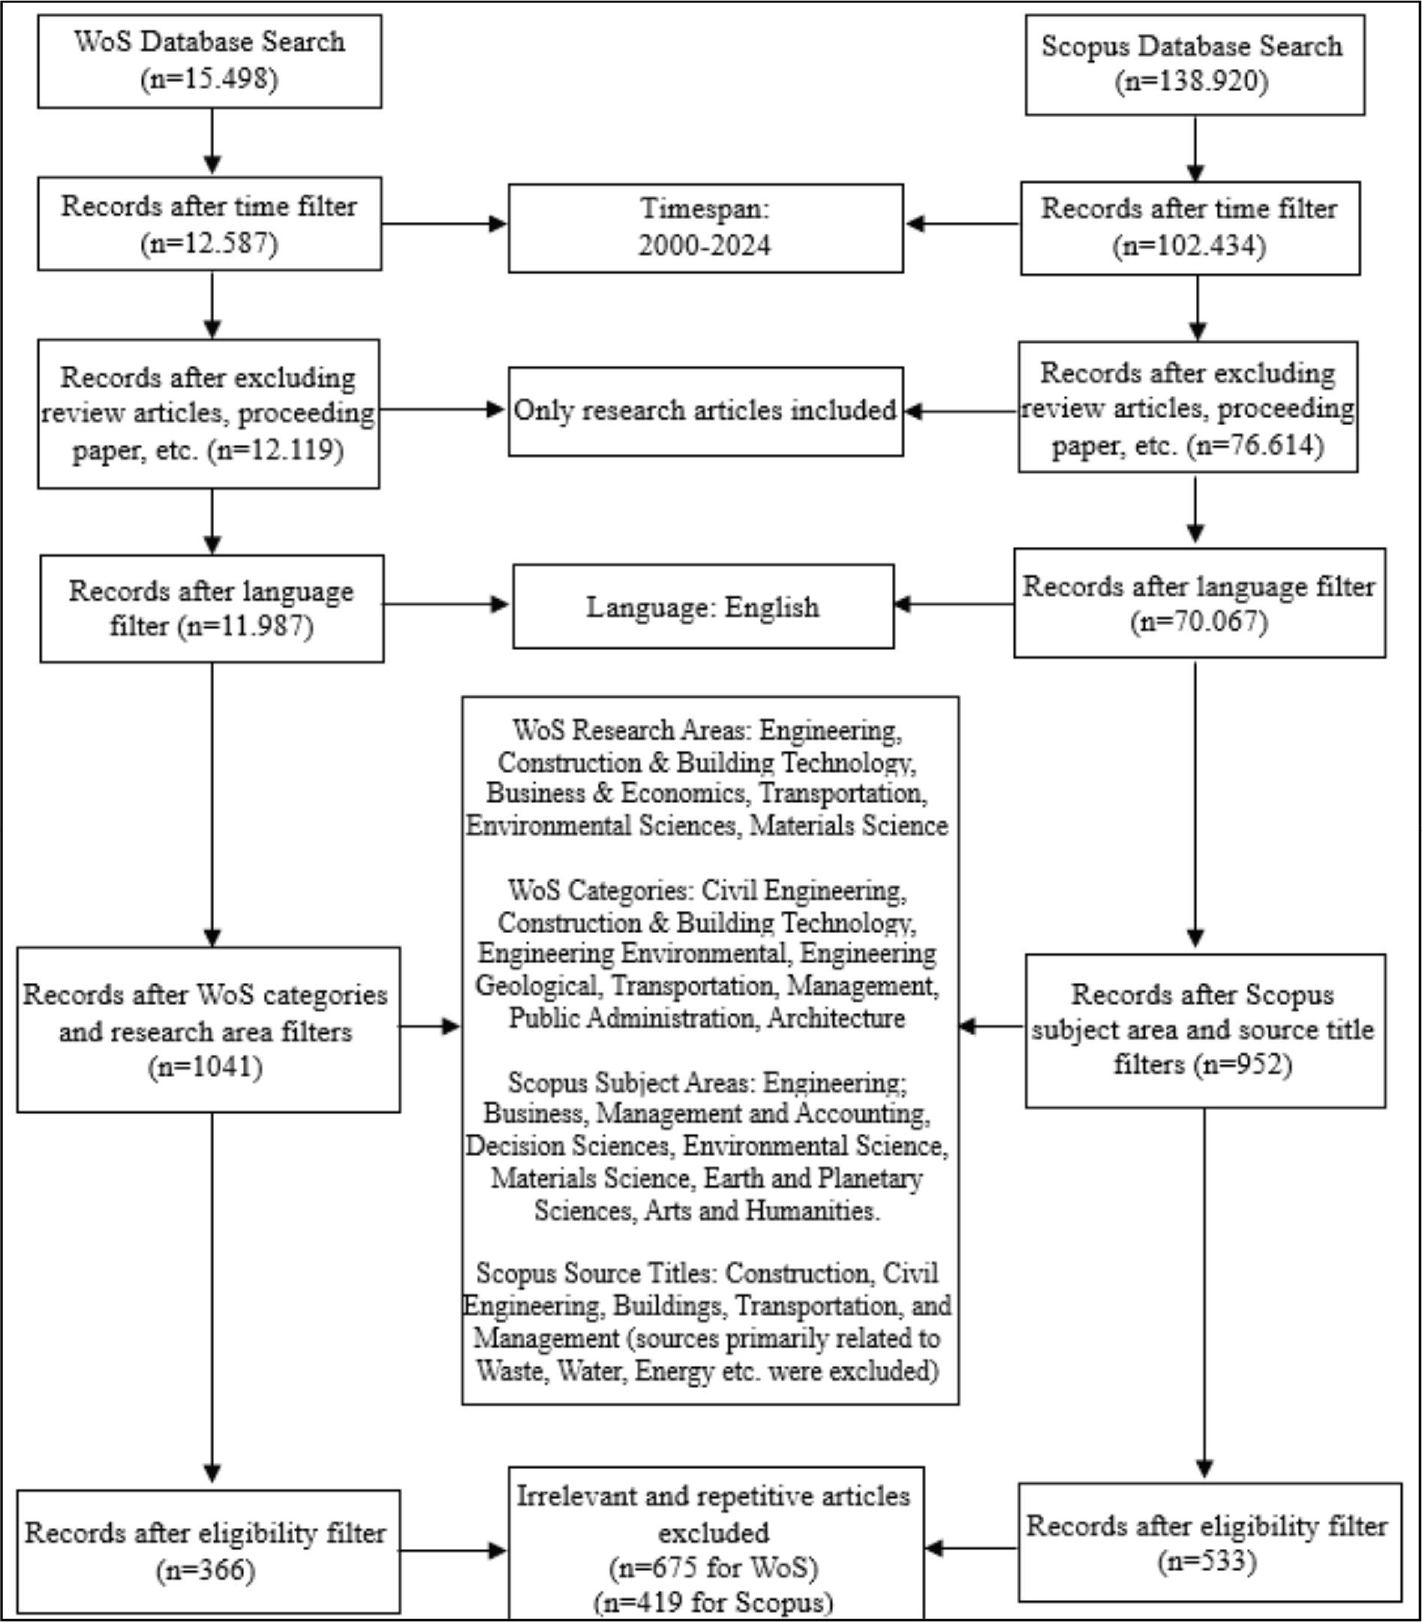
Fig. 1:
PRISMA flow diagram. WoS, Web of Science.
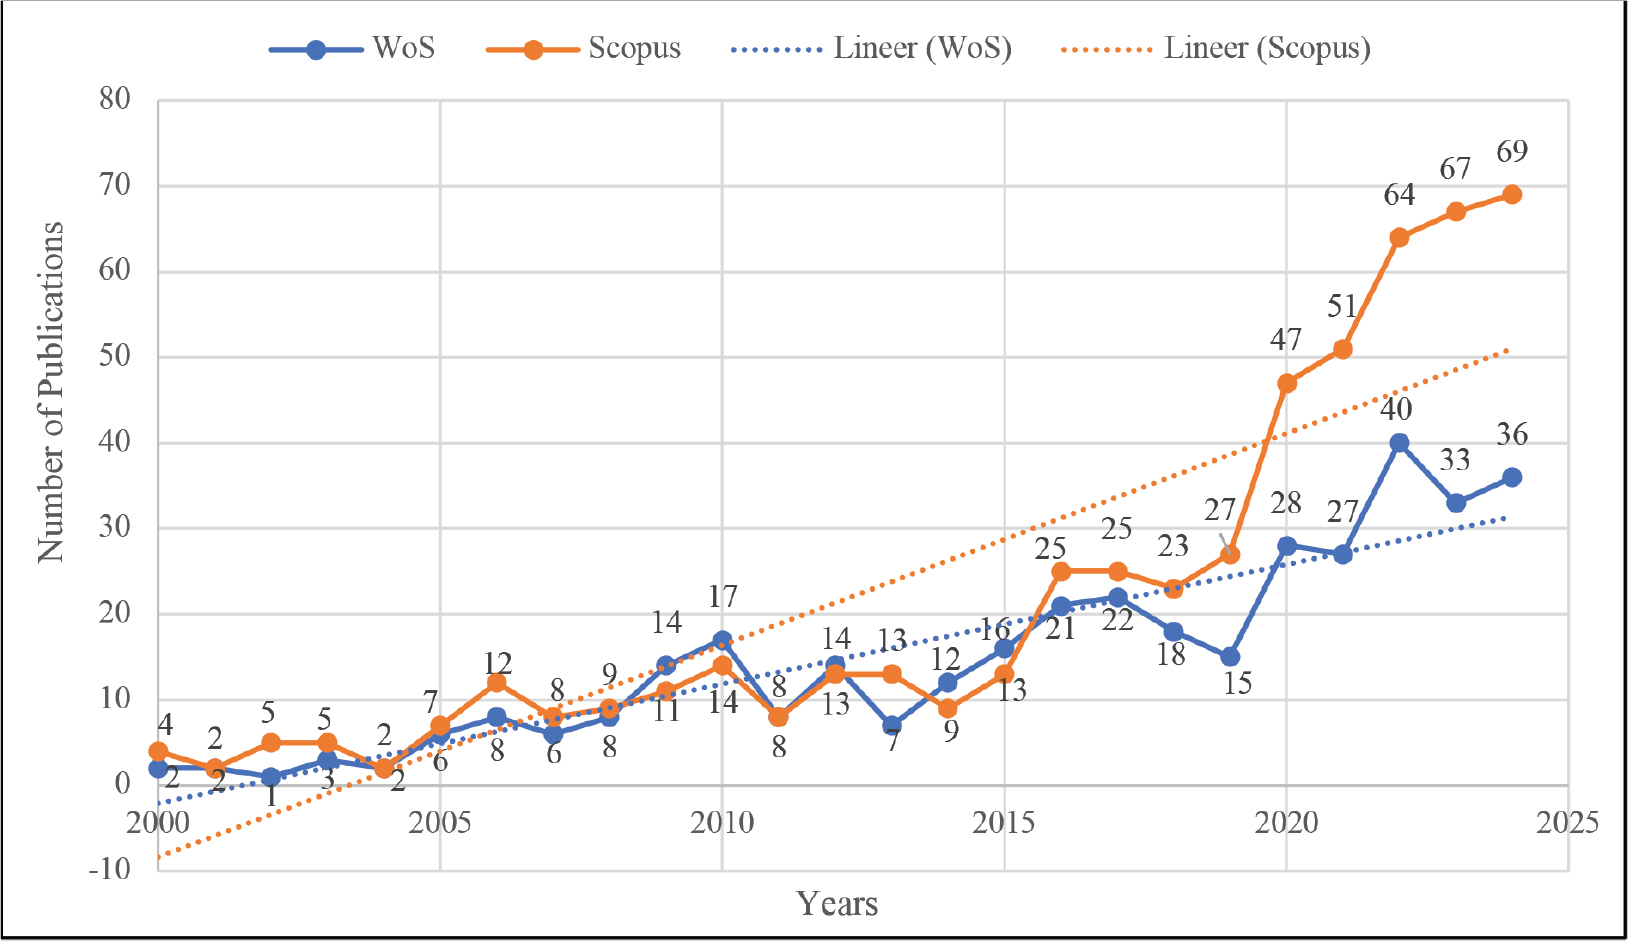
Fig. 2:
Number of publications on related topics by years (2000–2024) for the WoS and Scopus. WoS, Web of Science.
Tab. 1:
Top journals publishing construction delay research in the WoS and the Scopus.
| Database | Journals | Impact factors | Number of publications |
|---|---|---|---|
| WoS | Journal of Construction Engineering and Management | 5.1 | 85 |
| Engineering, Construction and Architectural Management | 3.9 | 40 | |
| Journal of Management in Engineering | 7.0 | 34 | |
| Automation in Construction | 11.5 | 28 | |
| Buildings | 3.1 | 25 | |
| International Journal of Project Management | 7.5 | 13 | |
| Journal of Civil Engineering and Management | 3.7 | 11 | |
| Transportation Research Record | 1.8 | 10 | |
| Canadian Journal of Civil Engineering | 1.1 | 10 | |
| Advances in Civil Engineering | 1.6 | 10 | |
| Scopus | Journal of Construction Engineering and Management | 5.1 | 78 |
| International Journal of Construction Management | 3.4 | 51 | |
| Engineering, Construction and Architectural Management | 3.9 | 41 | |
| Buildings | 3.1 | 28 | |
| Journal of Management in Engineering | 7.0 | 27 | |
| International Journal of Project Management | 7.5 | 25 | |
| Construction Management and Economics | 3.3 | 19 | |
| Automation in Construction | 11.5 | 19 | |
| Journal of Environmental Management | 8.4 | 19 | |
| International Journal of Sustainable Construction Engineering and Technology | 0.5 | 17 |
Tab. 2:
Top 10 authors with the most publications on related topics in the WoS.
| Database | Authors | Number of publications | Citations |
|---|---|---|---|
| WoS | Hegazy, Tarek | 10 | 285 |
| Yang, Jyh-Bin | 10 | 275 | |
| Ballesteros-Perez, Pablo | 7 | 122 | |
| Park, Moonseo | 5 | 118 | |
| Lee-Hyun-soo | 4 | 44 | |
| Lucko, Gunnar | 4 | 7 | |
| Hong, Taehoon | 4 | 60 | |
| Yap, Jeffrey Boon Hui | 4 | 190 | |
| Birgonul, M. Talat | 4 | 80 | |
| Dikmen, Irem | 4 | 80 |
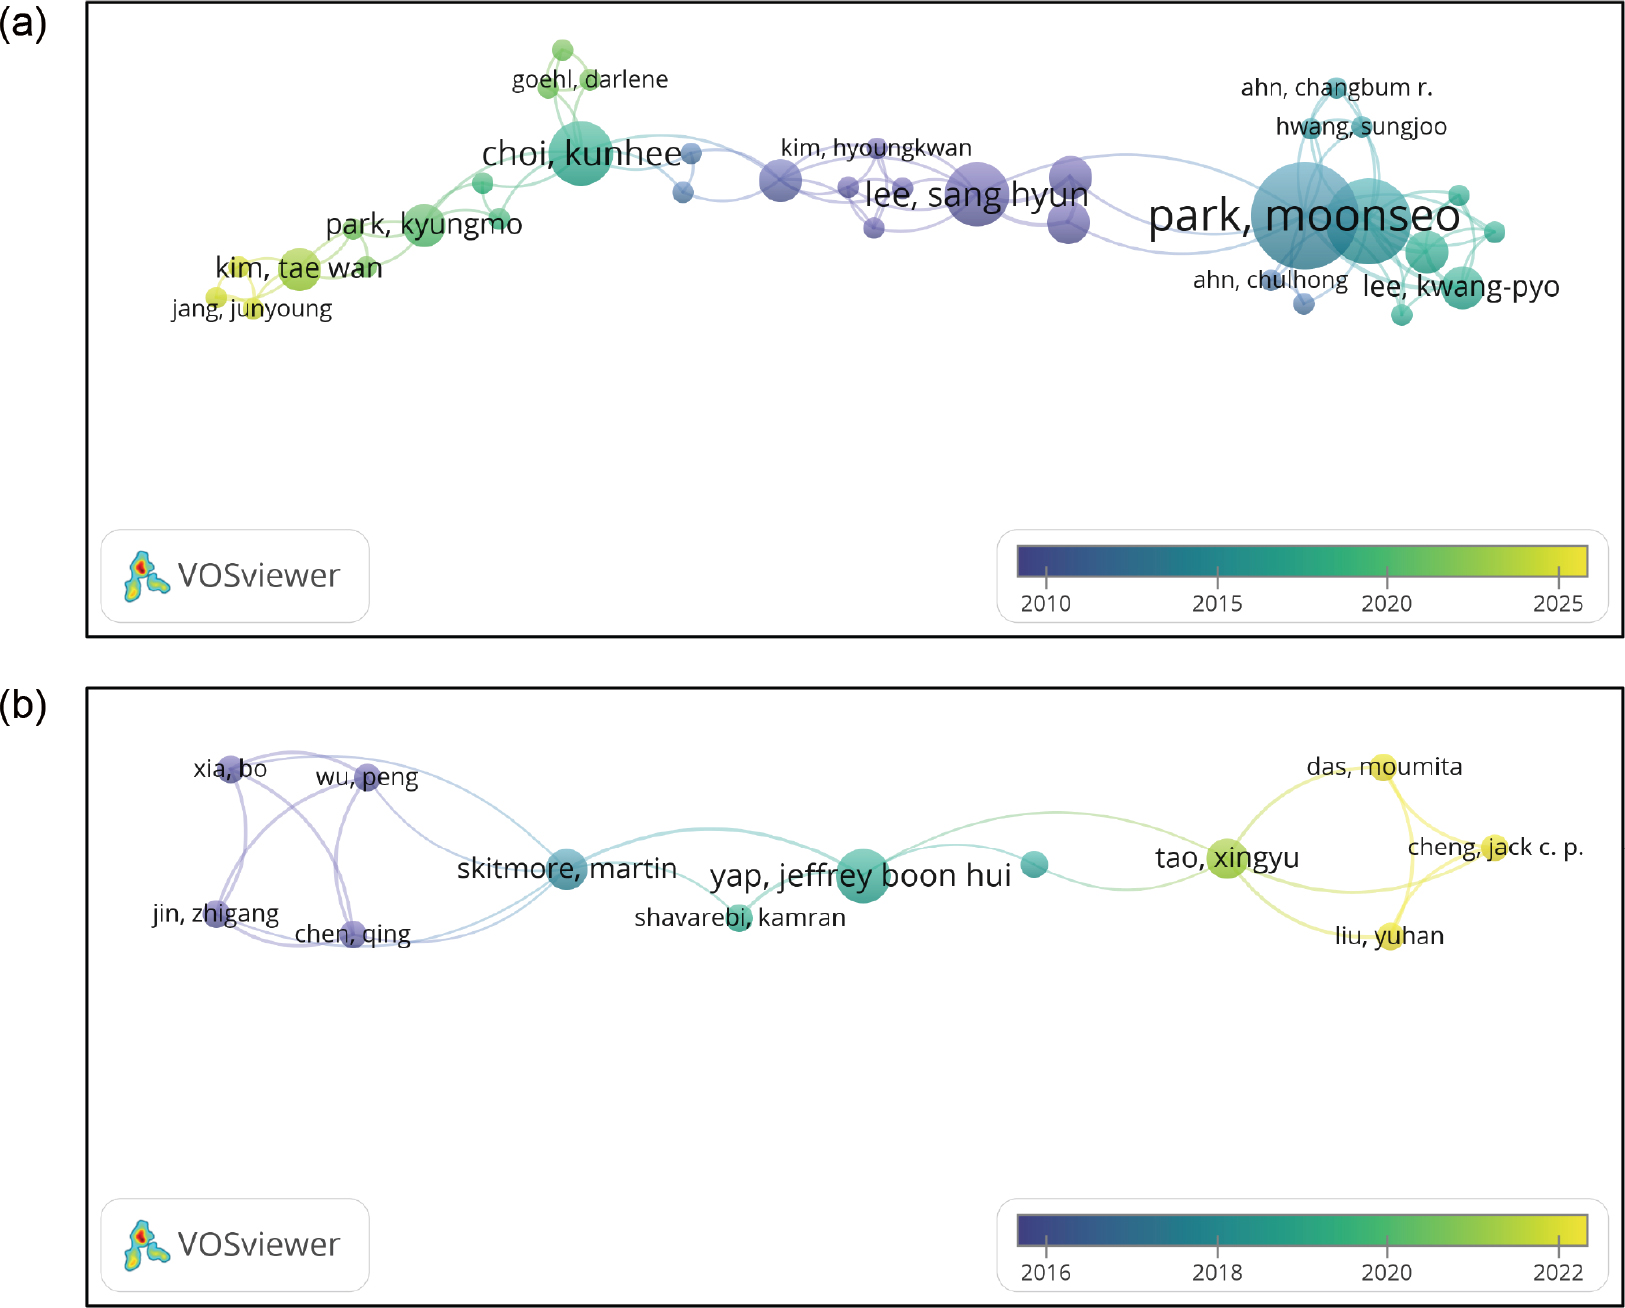
Fig. 3:
(a) Co-authorship network of authors in the WoS dataset. (b) Filtered co-authorship network of core authors.
Note: Node size represents the number of publications. Lines indicate co-authorship links between authors, and colours represent clusters generated by VOSviewer. Figure 3a shows the full author network, while Figure 3b shows the filtered core-author network based on documents ≥2 and citations ≥10. WoS, Web of Science.
Tab. 3:
Top 10 countries with the most publications on related topics in the WoS.
| Database | Countries | Number of publications | Citations |
|---|---|---|---|
| WoS | USA | 80 | 1,664 |
| China | 72 | 1,913 | |
| England | 39 | 1,002 | |
| South Korea | 34 | 896 | |
| Canada | 30 | 843 | |
| Australia | 29 | 1,232 | |
| Taiwan | 23 | 774 | |
| Iran | 21 | 494 | |
| Turkiye | 14 | 641 | |
| Spain | 13 | 295 |
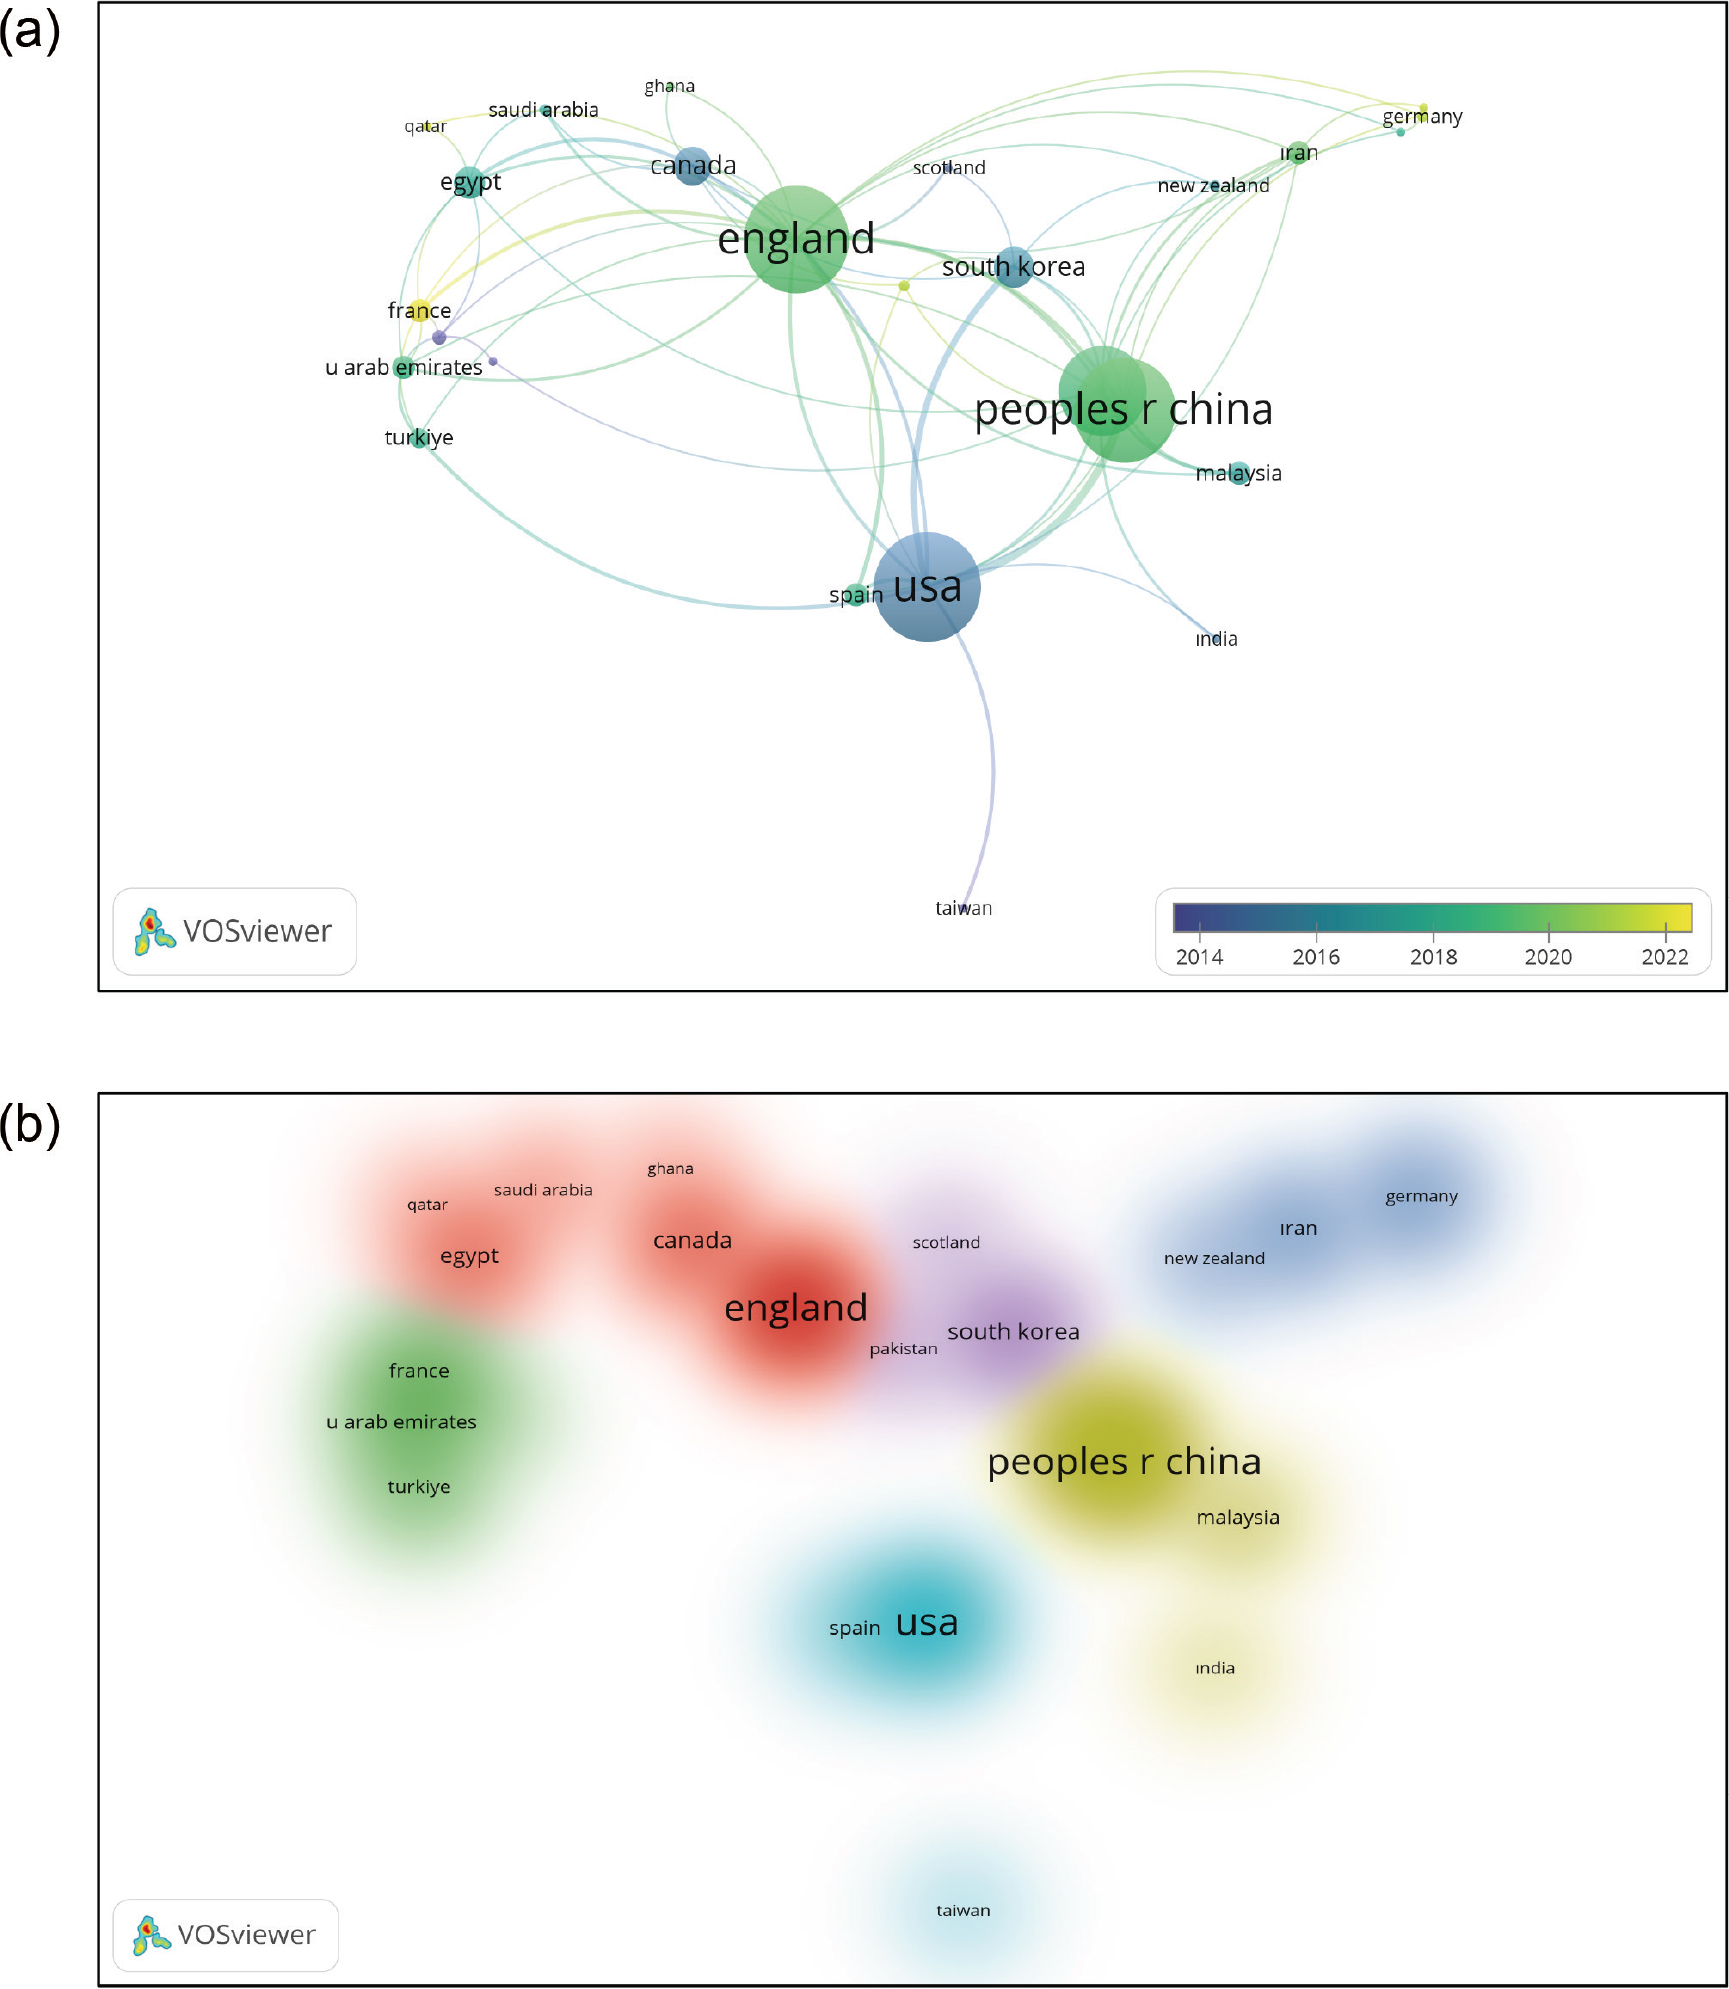
Fig. 4:
(a) Co-authorship network among countries. (b) Visual concentration of country collaboration intensity based on TLS in the WoS. Note: Node size is based on TLS. Lines in Figure 4a indicate country co-authorship links, and colours represent VOSviewer clusters. TLS, total link strength; WoS, Web of Science.
Tab. 4:
Top 10 organisations with the most publications on related topics in the WoS.
| Database | Organisations | Number of publications | Citations |
|---|---|---|---|
| WoS | University of Waterloo | 13 | 383 |
| University of Tehran | 10 | 264 | |
| Hong Kong Polytechnic University | 9 | 385 | |
| Chung Hua University | 9 | 284 | |
| Indian Institute of Technology | 9 | 960 | |
| Polytechnic University of Valencia | 8 | 211 | |
| Seoul National University | 7 | 186 | |
| University College London | 7 | 212 | |
| Tongji University | 6 | 147 | |
| National Central University | 6 | 119 |
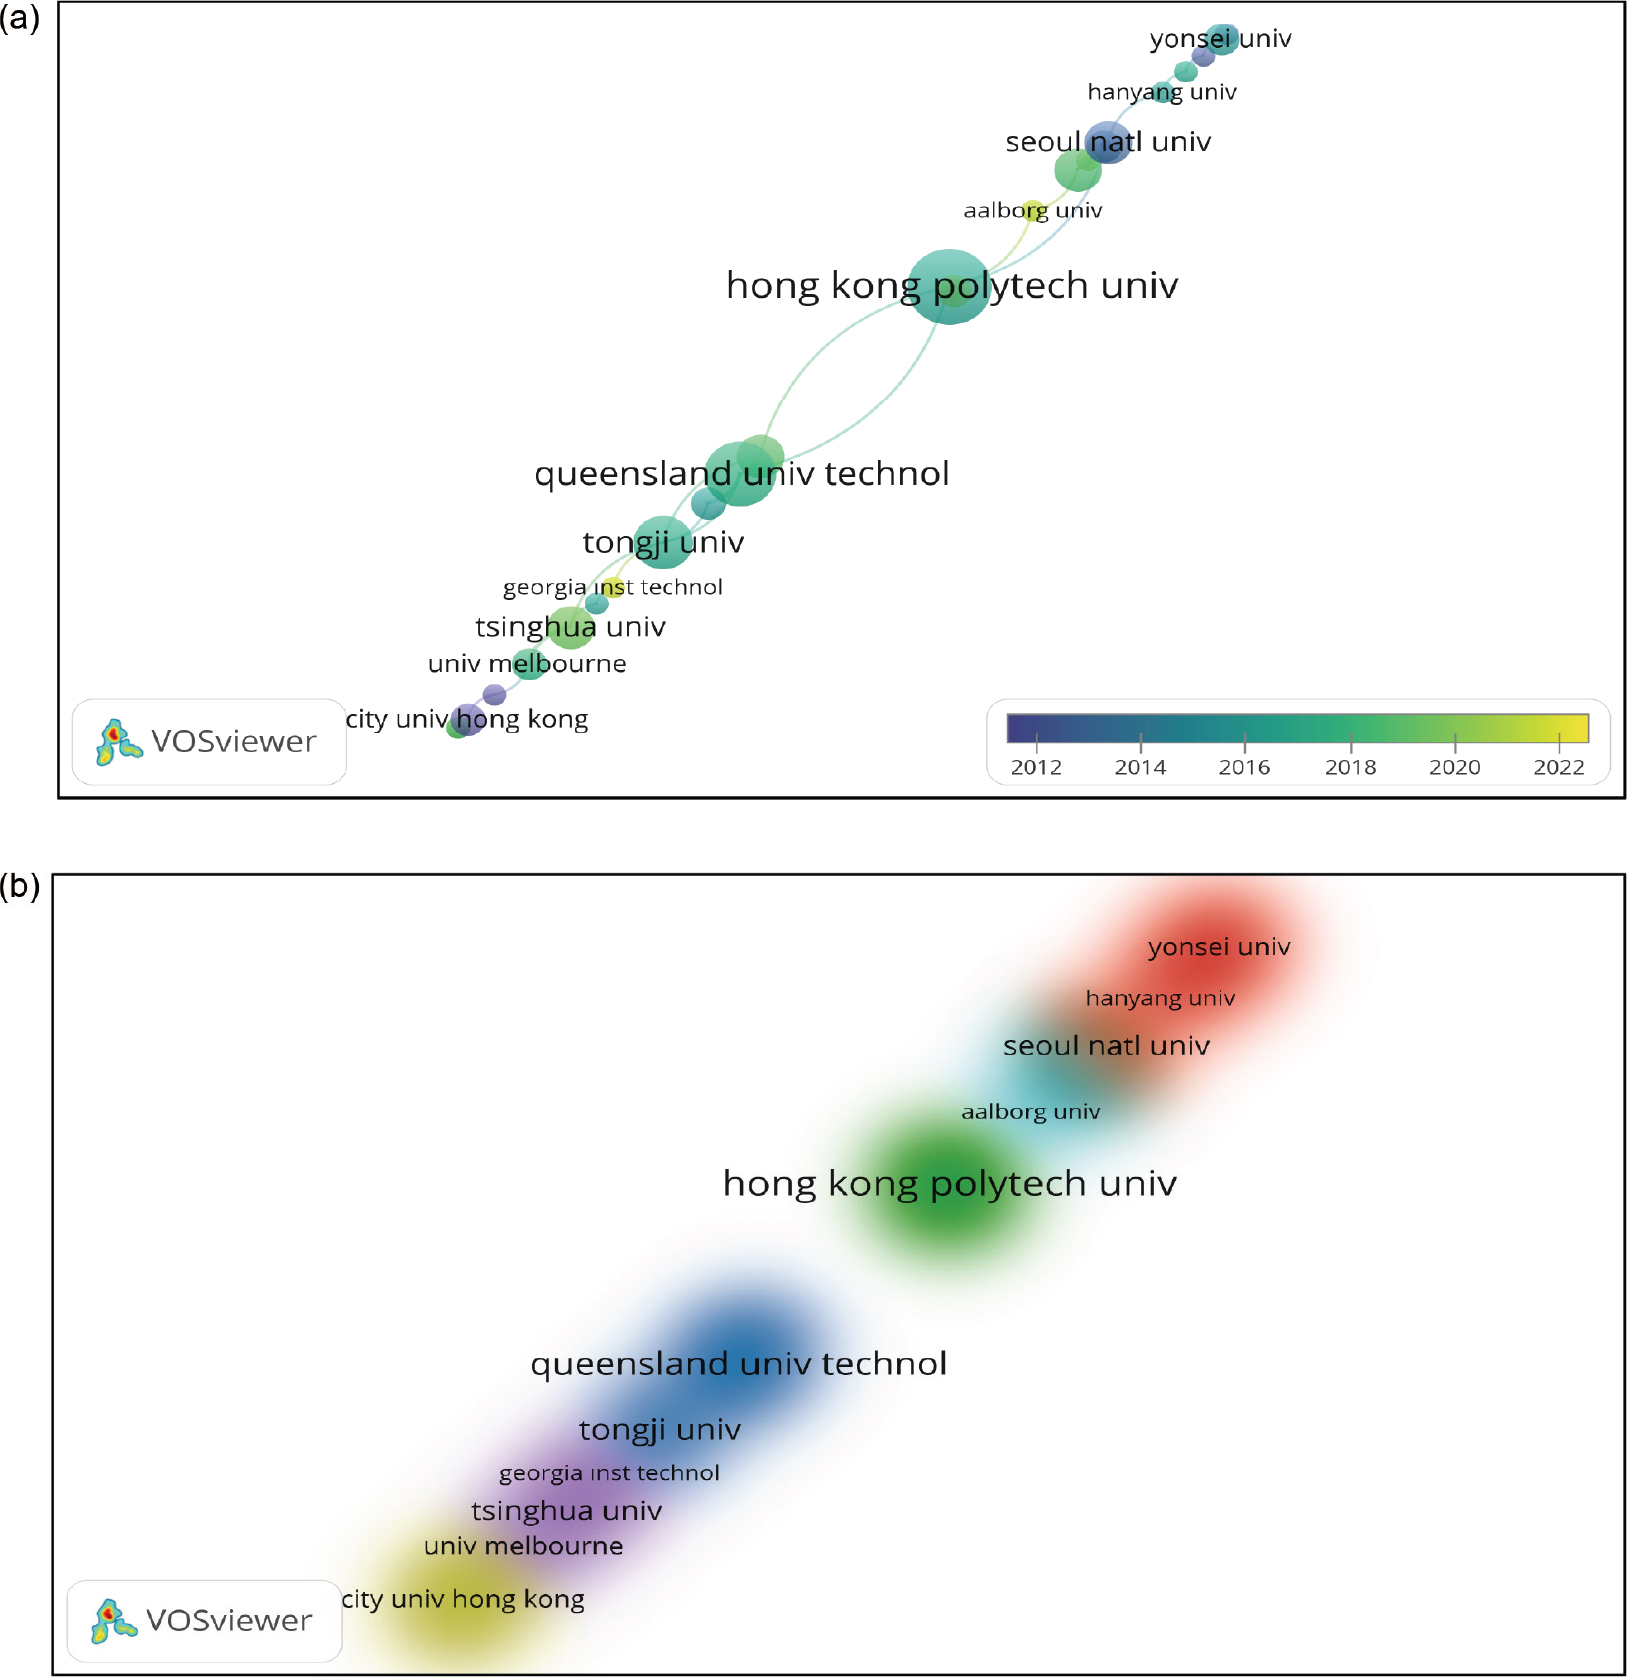
Fig. 5:
(a) Co-authorship network visualisation of organisations in the WoS dataset. (b) Visual concentration of organisational collaboration intensity based on TLS in the WoS.
Note: Node size is based on TLS. Lines indicate organisational co-authorship links, and colours represent VOSviewer clusters. TLS, total link strength; WoS, Web of Science.
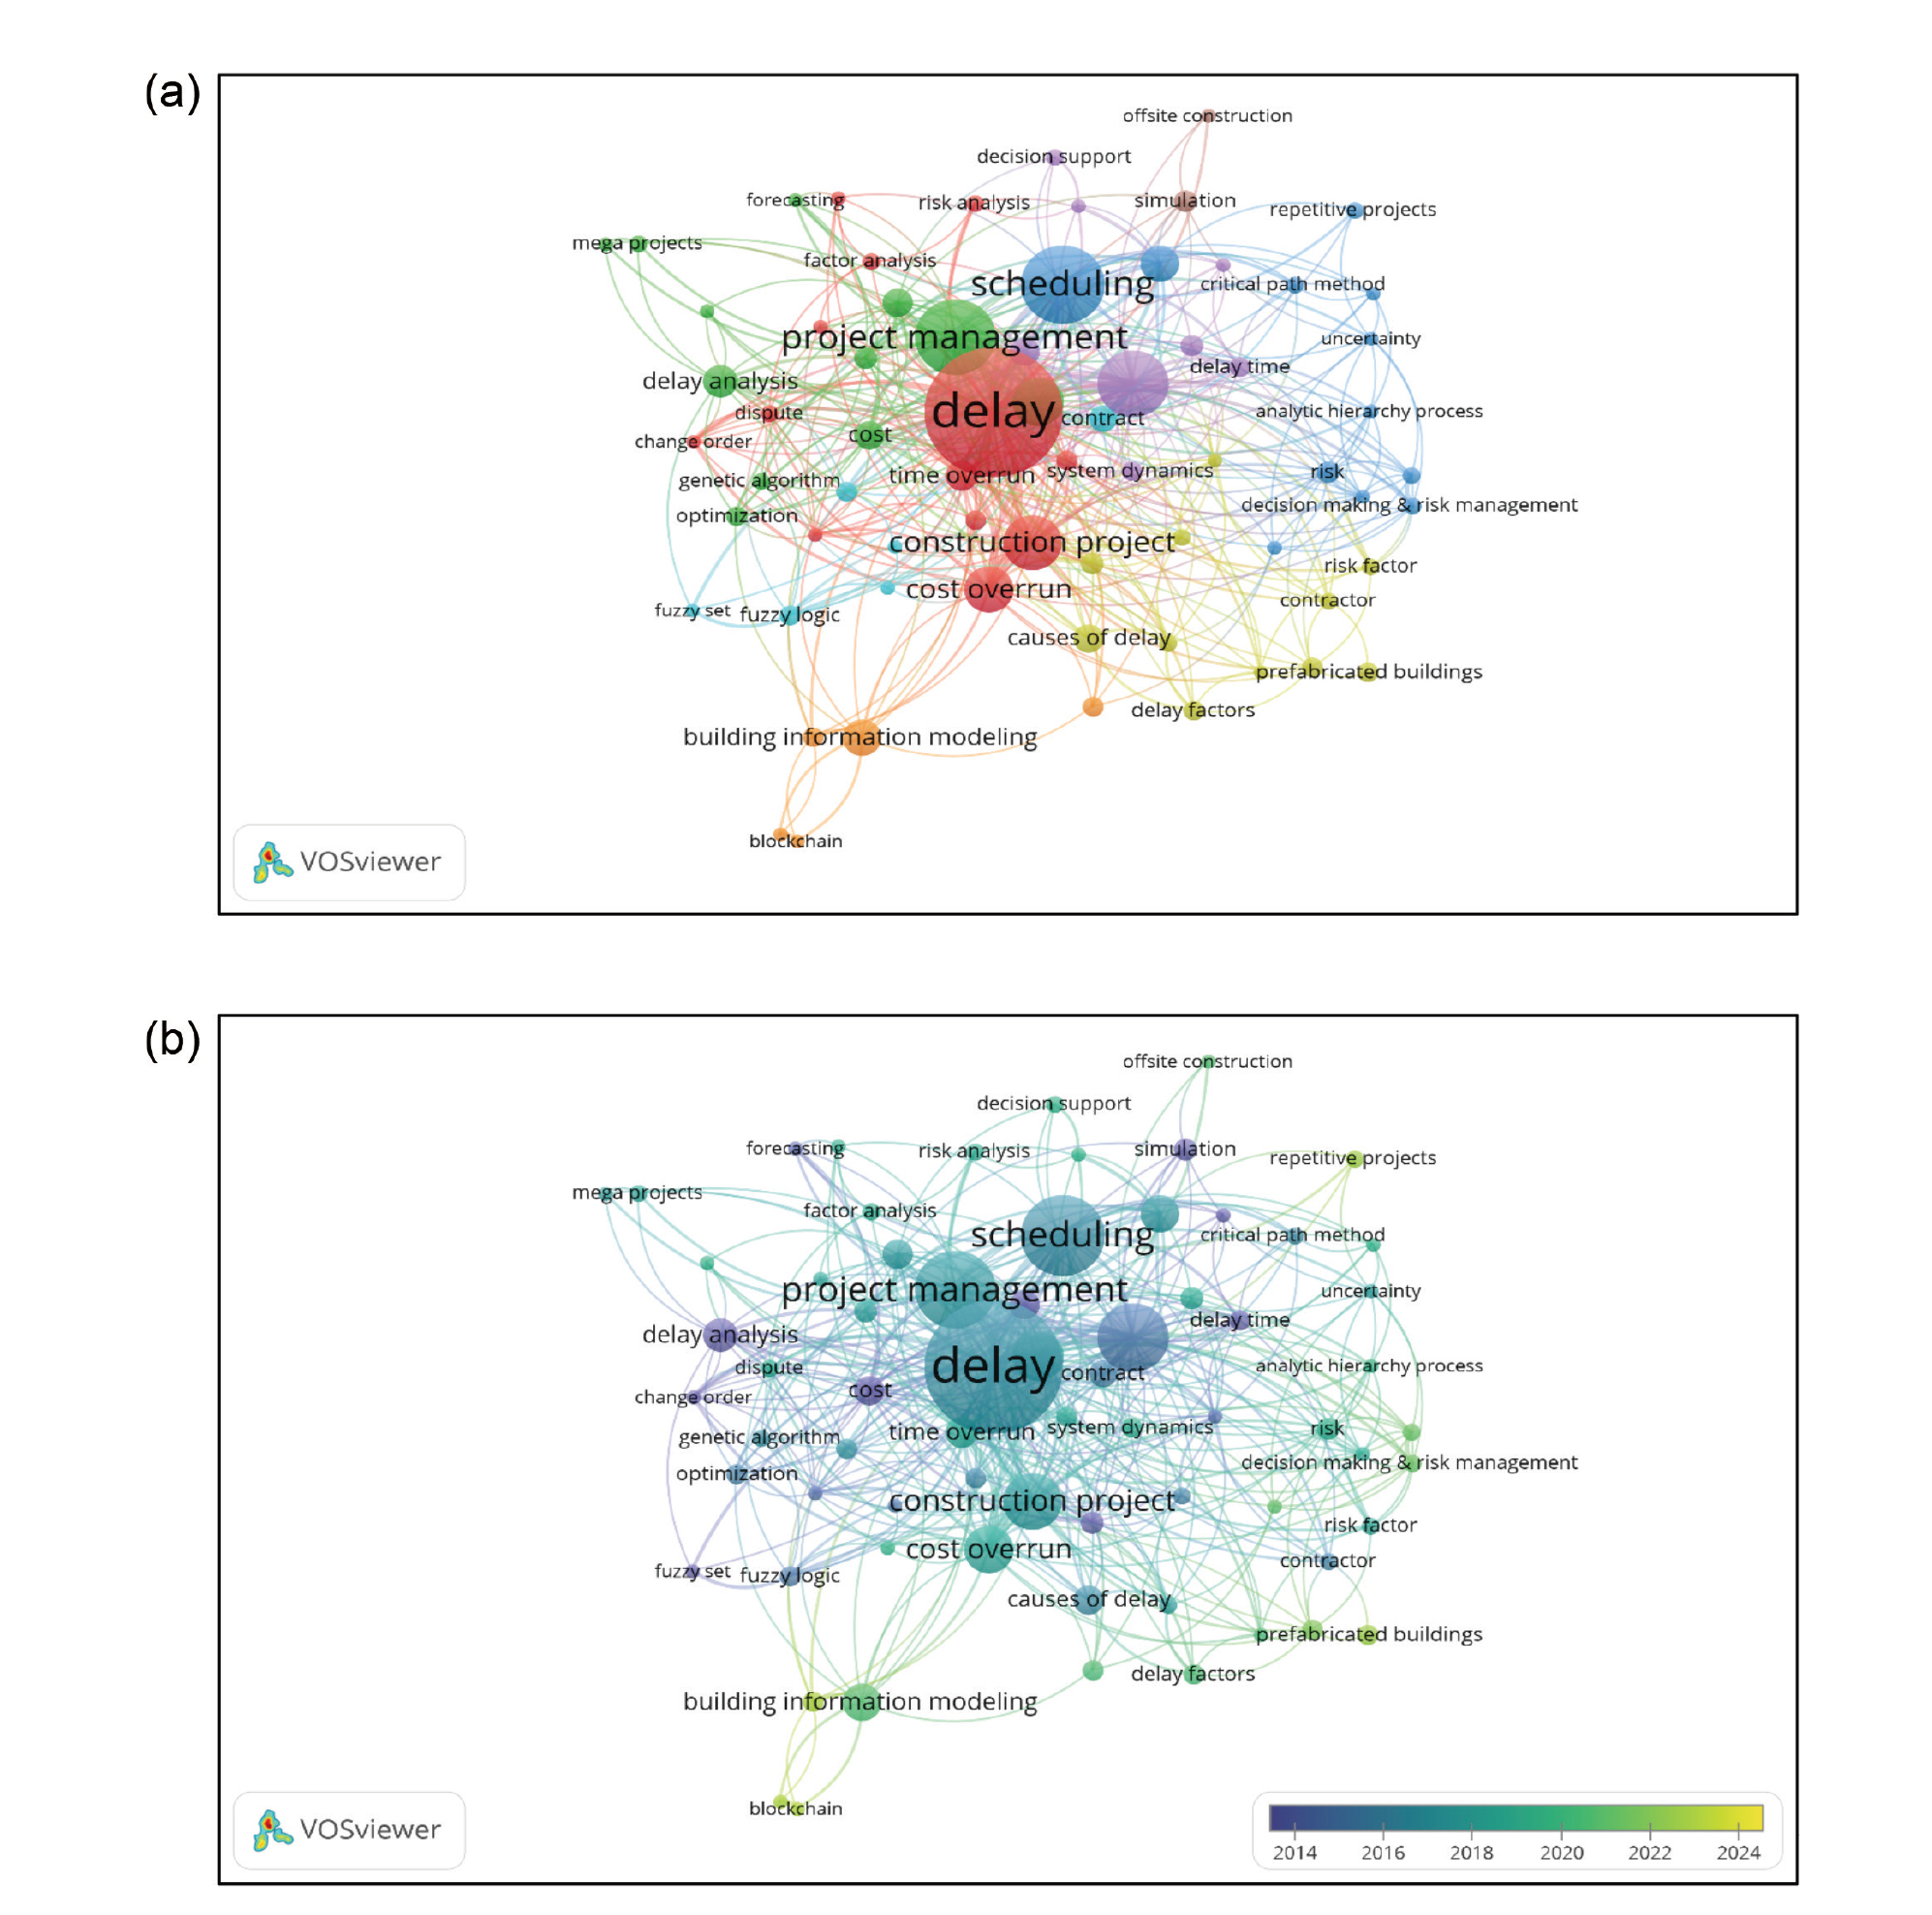
Fig. 6:
(a) Keyword co-occurrence network based on cluster visualisation in the WoS. (b) Overlay visualisation of keyword evolution based on average publication year.
Note: Node size represents keyword occurrence frequency. Lines in Figure 6a indicate keyword co-occurrence links, and colours represent thematic clusters generated by VOSviewer. Colours in Figure 6b represent the average publication year of keywords, ranging from earlier topics in blue to more recent topics in yellow. WoS, Web of Science.
Tab. 5:
Keyword clusters and thematic classification of delay research.
| Cluster No. | Cluster definition | Related keywords |
|---|---|---|
| Cluster 1 (13 items) | Core project performance and delay outcomes | Change order, construction project, cost overrun, delay, dispute, factor analysis, productivity, project performance, public projects, regression, rework, risk analysis, time overrun |
| Cluster 2 (12 items) | Project planning, optimisation, and decision processes | Claim management, construction planning, cost, decision making, delay analysis, forecasting, genetic algorithm, mega projects, optimisation, planning, project management, risk management |
| Cluster 3 (12 items) | Quantitative risk analysis and decision-support modelling | AHP, artificial neural network, Bayesian network, construction, critical path method, decision making & risk management, Monte Carlo simulation, programme & project management, repetitive projects, risk, scheduling, uncertainty |
| Cluster 4 (11 items) | Delay causes and project context factors | Causes of delay, contractor, cost and schedule, delay factors, developing countries, highways and roads, interpretive structural modelling, prefabricated buildings, public-private partnership, risk factor, road projects |
| Cluster 5 (8 items) | Project control and system-based management approaches | Claim, construction management, decision support, delay time, infrastructure project, project risk management, resource allocation, system dynamics |
| Cluster 6 (6 items) | Fuzzy-based and structural modelling approaches | Construction industry, contract, design-build, fuzzy logic, fuzzy set, structural equation modelling |
| Cluster 7 (5 items) | Digital technologies and data-driven methods | Blockchain, building information modelling, COVID-19, machine learning, smart contracts |
| Cluster 8 (2 items) | Offsite construction and simulation applications | Offsite construction, simulation |