
1. Introduction
Improving the efficiency of construction operations has been a globally significant approach (Toğan and Eirgash 2019). Ensuring a project completion within the designated time span is widely recognised as a crucial factor for achieving project success (Durdyev and Hosseini 2020; Fashina et al. 2021). Nevertheless, delays in construction projects are a globally widespread occurrence (Assaf and Al-Hejji 2006; Sha et al. 2017). The literature clearly indicates that delays have a significant impact on the majority of construction projects (Memon et al. 2023). A report has shown that approximately 70% of construction projects worldwide encountered time delays and these delays were featured by overruns ranging from 10% to 30% of the originally scheduled project duration (Gebrehiwet and Luo 2017).
In general, project delay is defined as ‘an overrun beyond the scheduled project completion time’ (Assaf and Al-Hejji 2006). These delays can be primarily attributed to the interconnected risk factors and uncertainties inherent in the complex and dynamic nature of construction processes (Ika and Donnelly 2017; Gondia et al. 2020). Numerous studies have highlighted similar challenges regarding inefficiencies in systems, construction delays, and cost-time overruns which have a significant impact on productivity (Moghayedi et al. 2020). Various factors contribute to these delays such as deviations from construction contracts, stakeholder incompetence, cost overruns, weather and terrain, politics, poor communication, inadequate resource estimation and even municipal constraints (Assaf and Al-Hejji 2006; Ika and Hodgson 2014; Al-Hazim et al. 2017). Consequently, these project delays, measured in terms of time overrun, can have adverse outcomes on the project and its stakeholders including: (1) claims, disputes and arbitration; (2) cost overruns and revenue loss; (3) disruption of work and decreased productivity; or (4) contract termination and potentially even project abandonment (Aibinu and Jagboro 2002; Majid 2006).
Scientific publications, patents and citations to these publications serve as valuable bibliometric information. They not only facilitate the mapping of various fields or subfields within scientific and technological inquiry but also offer a means to evaluate the performance of key contributors in these domains (Verbeek et al. 2002). The number of publications included in international scientific citation indexes such as SCI, social science citation index (SSCI), art&humanities citation index (A&HCI) is widely recognised as a crucial indicator for measuring the scientific and technological development of countries. It is commonly accepted that a country’s contribution to global scientific production is determined, to a significant extent, by the number of articles it has in these indexes and the citations received by those articles (Yavan 2005). The application of bibliometric indicators to estimate scientific cooperation (Lemarchand 2012; Zabidin et al. 2020) and research trends in construction management (Owojori et al. 2021; Akinlolu et al. 2022; Bilge and Yaman 2022; Otitolaiye et al. 2022) has been studied by many authors. These studies use different methods, such as text mining, cluster analysis, bibliometric analysis and scientific mapping.
Despite the growing number of bibliometric studies in construction management, the existing literature remains fragmented in addressing construction delays. Previous bibliometric analyses have predominantly focused on broader domains, such as BIM, sustainability, project success, and digital transformation, often treating delays only as a secondary or embedded topic within wider research agendas (Akinlolu et al. 2022; Bilge and Yaman 2022; Zhu et al. 2022). As a result, the intellectual structure of delay research as a distinct domain remains insufficiently explored. More importantly, prior studies tend to emphasise descriptive mapping of research trends without systematically linking thematic developments to the underlying theoretical evolution of construction management (Cevikbas and Isik 2021; Aliu et al. 2025). In particular, the relationship between delay-related research and core project management dimensions, such as time-cost performance, risk management and project control systems, has not been clearly articulated. This creates a gap between bibliometric mapping and theoretical interpretation, limiting the explanatory power of existing reviews. Furthermore, existing studies generally rely on single databases and do not adopt a comparative approach to data coverage (Khalife et al. 2021; Nazir et al. 2021; Bilge and Yaman 2022). Differences between major databases such as Web of Science (WoS) and Scopus in terms of scope, indexing policies and disciplinary coverage remain underexplored.
In response to these limitations, this study offers three main contributions. First, it provides a focused and systematic bibliometric analysis of construction delay research as an independent domain, rather than treating it as a subtopic within broader construction management studies. By doing so, it reveals the intellectual structure, thematic evolution and research dynamics specific to delay-related studies. Second, the study integrates bibliometric mapping with a theoretically informed interpretation of the field. Instead of presenting clusters as purely descriptive groupings, the analysis links thematic developments to key dimensions of construction management theory, including performance outcomes, planning and control processes, and methodological advancements. This approach enhances the explanatory depth of bibliometric findings. Third, the study adopts a comparative dual-database design by analysing the WoS and Scopus separately. This allows for a more robust assessment of publication trends, collaboration patterns and thematic structures, while also addressing potential biases associated with single-database studies. Through these contributions, the study moves beyond descriptive bibliometric analysis and provides a more structured and analytically grounded understanding of construction delay research. Moreover, this study is the third part of a more comprehensive PhD research. The first part was about a case study on calculating the total construction duration of public housing projects (Tirataci and Yaman 2023a). The second part was a model proposal for estimation of ideal construction duration in the tender preparation stage of housing projects (Tirataci and Yaman 2023b).
This study aims to identify publication trends, collaboration patterns among authors, countries, and institutions, and the thematic development of the field through keyword co-occurrence analysis. Accordingly, the study addresses the following research questions:
What is the overall status of scientific publications on construction delays and scheduling in the last 24 years?
What is the relationship among authors, countries and organisations on construction delays and scheduling?
What are the research trends and hot topics on construction delays and scheduling?
To answer the first research problem, the analyses included: (1) article publication trend; (2) the distribution of published journals; (3) author analysis; (4) country analysis; and (5) author organisation analysis. Quantitative analyses are used to gain insight into delays on construction planning and management research area. To answer the second research problem, the study employed a network analysis of: (1) co-authorship of authors; (2) cooperation network of countries; and (3) cooperation network of organisations. To answer the third research problem, co-occurrence analysis is employed by using clusters of keywords and comprehensive relationships between publication keywords are examined.
2. Background
Many studies have investigated research trends by using bibliometric analysis in the field of construction planning in the last 24 years. These publications were obtained and reviewed by using keywords of ‘construction planning’, ‘construction delays’, and ‘bibliometric analysis’. The findings of the most recent studies on these topics are given below.
He et al. (2019) conducted a bibliometric analysis on project success within the domain of construction engineering and management. The study encompasses an extensive review of 164 peer-reviewed journal papers published between 2007 and 2017. It was observed that there is a growing research interest in project success within the field of construction engineering and management. However, the majority of studies concentrate on developed regions, particularly Hong Kong, while there is a dearth of research pertaining to developing economies. Within the targeted research area, the subtopic of critical success factors emerges as the most popular theme based on the keyword network analysis.
Nazir et al. (2021) evaluated the potential of modular construction as a viable alternative to the traditional approach, to address the ongoing housing crisis in the United Kingdom. After a bibliometric analysis is performed on the WoS database by using VOSviewer, the findings underscore the critical state of the UK housing market, characterised by a combination of factors including a growing population and a significant decline in housing delivery rates, resulting in a widening gap in housing supply. The construction industry’s ability to meet this substantial shortage is further hindered by various chronic challenges, including a decline in workforce participation, diminishing skill levels, reduced profitability, time constraints and cost overruns.
Akinlolu et al. (2022) investigates the advancements in managing health and safety in the construction industry, aiming to identify current research patterns. The authors adopted a bibliometric review utilising a two-step literature selection approach and focused on publications from the Scopus database. After the analysis of 240 papers by VOSviewer, the outcomes indicated that the emerging research trends in construction health and safety technologies revolve around project design and planning, visualisation and image processing for construction projects, digital technologies for project monitoring, information management and the Internet of Things, automation and robotic systems, as well as health, safety, accident prevention, and structural evaluation.
Baarimah et al. (2022) examined trends in BIM applications in post-disaster reconstruction. Their VOSviewer analysis of 75 Scopus-indexed studies identified “reconstruction” and “safety management” as prominent research themes that have recently attracted scholarly attention. Additionally, five major research domains associated with BIM were identified based on frequently used keywords, namely disasters, earthquakes, historical building information modeling (HBIM), damage detection, and life cycle.
Bilge and Yaman (2022) identified research trends in the field of construction management using text mining techniques, focusing on the years 2000–2020. Bibliometric analysis of 3,335 journal articles published obtained from the WoS database in the domain of construction management is followed by topic detection using the latent Dirichlet allocation (LDA) method. Through cluster analysis, 20 distinct clusters were identified, and topics were extracted within each cluster using the LDA topic detection method. The findings indicate that BIM and information management are the most extensively studied subjects. Furthermore, the literature reveals that BIM, information management, scheduling and cost optimisation, lean construction, agile approach, and megaprojects represent the current trend topics in the field of construction management.
Castañeda et al. (2022) examined the trends in highway planning and its knowledge structure, utilising a bibliometric analysis spanning from January 2015 to September 2021. After the analysis of information from 1,703 journal papers, the findings highlight the primary trends in highway planning, which covers areas such as life cycle analysis, computational tools, smart cities, sustainability concerns, construction processes, utilisation of new equipment and materials, and multi-objective optimisation.
Hire et al. (2022) presented a comprehensive bibliometric analysis focused on the adoption of BIM in the global construction industry, with specific emphasis on the Indian construction industry. The analysis incorporated VOSviewer (Centre for Science and Technology Studies, Leiden University, the Netherlands) and iMap-Builder (WebUnion Media Ltd.) for data analysis. The findings showed that a total of 6,039 documents related to BIM adoption in the construction sector worldwide were identified and revealed that only 1.29% of the total documents were specific to India. Keywords analysis found that only 549 documents have been published globally to date, and out of these, only nine documents originated from India. These findings underscore the fact that the adoption of BIM for the safety of Indian construction sites is still in its early stages.
Kineber et al. (2023) investigated the connection between the successful implementation of value management and the barriers encountered in the Egyptian building sector. Through bibliometric analysis, the authors concluded that there is a lack of comprehensive research on the barriers to VM implementation in the Egyptian construction industry. Furthermore, there is a scarcity of studies focusing on the implementation of VM in developing countries as a whole.
There are much more previous bibliometric analyses on construction management besides the mentioned literature above (Utama et al. 2016; Yu et al. 2019; Khalife et al. 2021; Zhu et al. 2022), and many studies indicated that topics related to technological advancements, such as building information modelling (BIM), geographic information systems (GIS), four-dimensional computer-aided design (4D CAD), robotics and automation in construction have become the main trend (Santos et al. 2017; Boulos et al. 2020; Khudhair et al. 2021; Akinlolu et al. 2022; Baarimah et al. 2022; Hire et al. 2022). While these studies provide valuable insights into emerging topics in construction management, delay-related research is typically addressed only indirectly or embedded within broader thematic areas. Consequently, the internal structure, thematic evolution and collaboration patterns of construction delay research as a distinct domain remain insufficiently explored. In addition, most existing bibliometric studies rely on single databases and focus primarily on descriptive mapping without systematically linking findings to the theoretical dimensions of construction management. This study addresses these limitations by providing a focused and comparative bibliometric analysis of construction delays, duration and scheduling as well as integrating network-based analysis with a theoretically informed interpretation of the field.
3. Method and source of data
3.1. Methodology
Bibliometric analysis serves as a valuable tool for evaluating international scientific activities. Early definition of bibliometrics by Pritchard (1969) is ‘the application of mathematics and statistical methods to books and other media of communication’. Diodato (1994) in his Dictionary of Bibliometrics defines it as ‘[the] mathematical and statistical analyses of patterns that arise in the publication and use of documents’. Bibliometric analysis is a tool used to summarise vast amounts of publication data with quantitative citation statistics, rankings of major contributors, authorship patterns, regional distribution rankings of authors, rankings of institutions most productive, collaboration between institutions, the range and percentage of references per study, and the frequency allocation of topic descriptor (Keshava et al. 2008; Thelwall 2008; Hung and Zhang 2012).
Bibliometric analysis is useful for identifying relevant literature, evaluating research trends, measuring research impact, identifying key contributors, and mapping research networks. In this study, it was selected to examine the historical development and future direction of construction delay and scheduling research (Gan et al. 2022). Apart from bibliometric analysis methods, researchers used systematic reviews to identify these trends and research topics (Nie and Sun 2017). Usually, a strong systematic review provides an overview of the context of this subject, important research issues, historical research, proven techniques, and other challenges. However, the complete dependence on systematic reviews is not always realistic or feasible. Systematic reviews cannot exist in an evolving field of research, and current systematic reviews may be outdated and not as strong in the interests of researchers as they could be (Chen 2016). Second, many researchers have considered bibliometric analysis for construction management as a practical method (He et al. 2019; Khalife et al. 2021; Akinlolu et al. 2022; Bilge and Yaman 2022; Hire et al. 2022; Zhu et al. 2022), and researchers can explore what questions authors are seeking and discover various methods (Chen 2016). However, there are some limitations of bibliometric analysis. It evaluates and groups publications based only on the title keyword and the associated citation network analysis (Chen and Luo 2019). It does not constitute a subject or a cluster according to the main text or abstract of the study (Bilge and Yaman 2022).
Science mapping analysis, on the other hand, has rapidly emerged as a burgeoning field within a relatively short span of time. It is widely acknowledged as a valuable method for assessing the structure and dynamics of information, while also enabling enhanced accessibility to relevant knowledge resources (Yildiz 2019; Castañeda et al. 2022).
VOSviewer was used because it is suitable for constructing and visualising large bibliometric maps based on co-authorship, co-occurrence and citation relationships (Van Eck and Waltman 2010; Waltman et al. 2010). In this study, the software was used to generate author, country, organisation and keyword networks. Network and density visualisations were used together to interpret structural relationships and collaboration intensity. In this study, VOSviewer is preferred due to its advanced bibliometric visualisation.
The bibliometric analysis and science mapping were conducted using VOSviewer (version 1.6.20), which enables the construction and visualisation of bibliometric networks based on co-authorship, co-occurrence, and citation relationships. In this study, networks were generated for authors, countries, organisations and keywords. Networks were visualised using both network and density views to provide complementary insights into structural relationships and collaboration intensity. For network construction, the full counting method was applied. The association strength normalisation method was used to calculate the strength of links between items, as it is widely accepted for constructing bibliometric networks. In addition, separate thesaurus files were applied in the co-authorship analyses (authors, countries and organisations) to merge different name variations and ensure consistency across the dataset. Prior to analysis, keywords were standardised by merging singular and plural forms and eliminating minor variations to improve consistency. This standardisation was performed using VOSviewer thesaurus files (.txt format) prepared separately for authors, organisations, countries and keywords. For example, author-name variants such as ‘hegazy t’, were replaced by ‘hegazy, tarek’; organisation variants such as ‘chunghua univ’ were replaced by ‘chung hua univ’; and country-name variants such as ‘turkey’ were replaced by ‘turkiye’. In the keyword file, singular/plural and synonymous delay-related terms were merged, such as ‘construction delay’, ‘construction delays’, ‘project delay’, ‘project delays’, and ‘delays’, all of which were standardised under ‘delay’. Similar standardisation was applied to related terms such as ‘cost overruns’→‘cost overrun’, ‘BIM’→‘building information modeling’, and ‘schedule’→‘scheduling’.
Clustering was performed using the visualization of similarities (VOS) clustering technique implemented in the software, with a resolution parameter set to 1.0 (default value). The specific thresholds were determined according to the type of network analysis. For keyword co-occurrence analysis, the minimum occurrence threshold was set to 4 to ensure that only frequently used and meaningful keywords were included in the network. In author co-authorship analysis, the minimum number of documents was set to 2, and the minimum number of citations was set to 10 for core authors, while the minimum number of documents was set to 1 and the minimum number of citations was set to 0 for the full author network. For organisation co-authorship analysis, the minimum number of documents was set to 3, and the minimum number of citations was set to 0. For country co-authorship analysis, the minimum number of documents was set to 4, and the minimum number of citations was set to 0. In all analyses, the clustering resolution parameter was kept at 1.0. This approach groups strongly related items into clusters based on their cooccurrence patterns, allowing the identification of major thematic structures in the literature. By analysing the data using these measures, the purpose of this study is to gain insights into the research trends and knowledge networks related to construction delays and scheduling in planning and management research.
To complement the VOSviewer network and density visualisations, additional density and centrality metrics were calculated from the exported network files. For the co-authorship analyses, authors, countries, and organisations were treated as nodes while co-authorship relations were treated as undirected links. For the keyword co-occurrence analysis, keywords were treated as nodes, and co-occurrences within the same publication were treated as undirected links. Repeated co-authorship or co-occurrence relations were used as edge weights. Network density was calculated as , where n represents the number of nodes and m represents the number of links (Wasserman and Faust 1994; Newman 2010). The average degree was calculated as , indicating the average number of direct connections per node (Newman 2010). Weighted collaboration or co-occurrence intensity was measured using total link strength (TLS) calculated as , where wij represents the weight of the link between nodes i and j. Betweenness centrality was calculated as , where σst is the number of shortest paths between nodes s and t, and σst(v) is the number of those paths passing through node v (Freeman 1977; Brandes 2001). In disconnected networks, density and average degree were reported for the full filtered network, whereas betweenness centrality was interpreted primarily within the largest connected component to identify the main bridging nodes.
3.2. Data source and data processing
Bibliometric data were collected from the WoS and Scopus and analysed separately. The WoS was used as the primary dataset for network-based bibliometric analysis, whereas Scopus was used for descriptive validation and comparative trend analysis. Only research articles were included to ensure document-type homogeneity and to focus on original research production rather than secondary syntheses. Review articles were excluded because they synthesise previously published studies and may disproportionately affect bibliometric networks, particularly citation- and keyword-based structures, as reviews tend to receive substantially more citations (×2.9) than original research articles (Miranda and Garcia-Carpintero 2018). This decision is consistent with the aim of bibliometric analysis to map the structure, evolution and thematic dynamics of a research field through publication metadata (Donthu et al. 2021). Moreover, the search is conducted by Science Citation Index-EXPANDED (SCI-EXPANDED), SSCI, and A&HCI. These indexes were chosen due to their relevance to the research aim for construction duration and delays through science, law and architecture content. Construction duration and time overrun topics have a multidisciplinary nature that involves engineering modelling as well as disputes, regulations and public administration.
The search strategy was developed iteratively to cover the main delay-related terms used in construction research. Initially, a set of 17 candidate keywords was compiled based on prior literature and domain-specific terminology including ‘construction delay’, ‘schedule delay’, ‘project delay’, ‘time overrun’, ‘construction time extension’, ‘duration extension’, ‘schedule disruption’, ‘project postponement’, ‘time lag’, ‘delays in project completion’, ‘timeline extension’, ‘delayed construction activities’, ‘late completion’, ‘work stoppage’, ‘construction hold-ups’, ‘progress delay’, and ‘execution delay’. Preliminary searches indicated that six of these terms yielded no relevant results. Therefore, the final search strategy was constructed using the remaining 11 effective keywords combined with Boolean operators. In the WoS, these terms were searched within topic fields, while in Scopus they were applied to title, abstract and keyword fields using the TITLE-ABS-KEY function.
For Scopus, the final Boolean query was structured as follows:
(TITLE-ABS-KEY (‘construction delay’) OR (‘schedule delay’) OR TITLE-ABS-KEY (‘project delay’) OR TITLE-ABS-KEY (‘time overrun’) OR TITLE-ABS-KEY (‘late completion’) OR TITLE-ABS-KEY (‘construction delay’) OR TITLE-ABS-KEY (‘time lag’) OR TITLE-ABS-KEY (‘duration extension’) OR TITLE-ABS-KEY (‘work stoppage’) OR TITLE-ABS-KEY (‘progress delay’) OR TITLE-ABS-KEY (‘execution delay’).
The screening process consisted of multiple sequential filtering stages. First, records were limited to the period 2000–2024, English language, and research articles. In the WoS, subject categories were restricted to Civil Engineering, Construction Building Technology, Management, Engineering Environmental, Transportation, Engineering Geological, Public Administration, and Architecture. This step reduced the dataset from 1,041 initial records to 555 relevant publications after excluding 486 irrelevant records. Since the WoS categories may include overlapping records across multiple categories, duplicate entries were identified and removed manually, resulting in a final dataset of 366 unique publications.
A similar filtering procedure was applied in the Scopus database. In Scopus, filtering was conducted with the same keywords as in the WoS. However, subject areas (Engineering, Business, Management and Accounting, Decision Sciences, Environmental Science, Materials Science, Earth and Planetary Science, and Arts and Humanities) and source title restrictions (e.g., ‘construction’, ‘civil engineering’, ‘building’, ‘management’, and ‘transportation’) were refined, while explicitly excluding unrelated domains, such as energy, water and waste-focused journals. A further screening step removed 419 irrelevant publications, resulting in a final dataset of 533 articles (Figure 1).
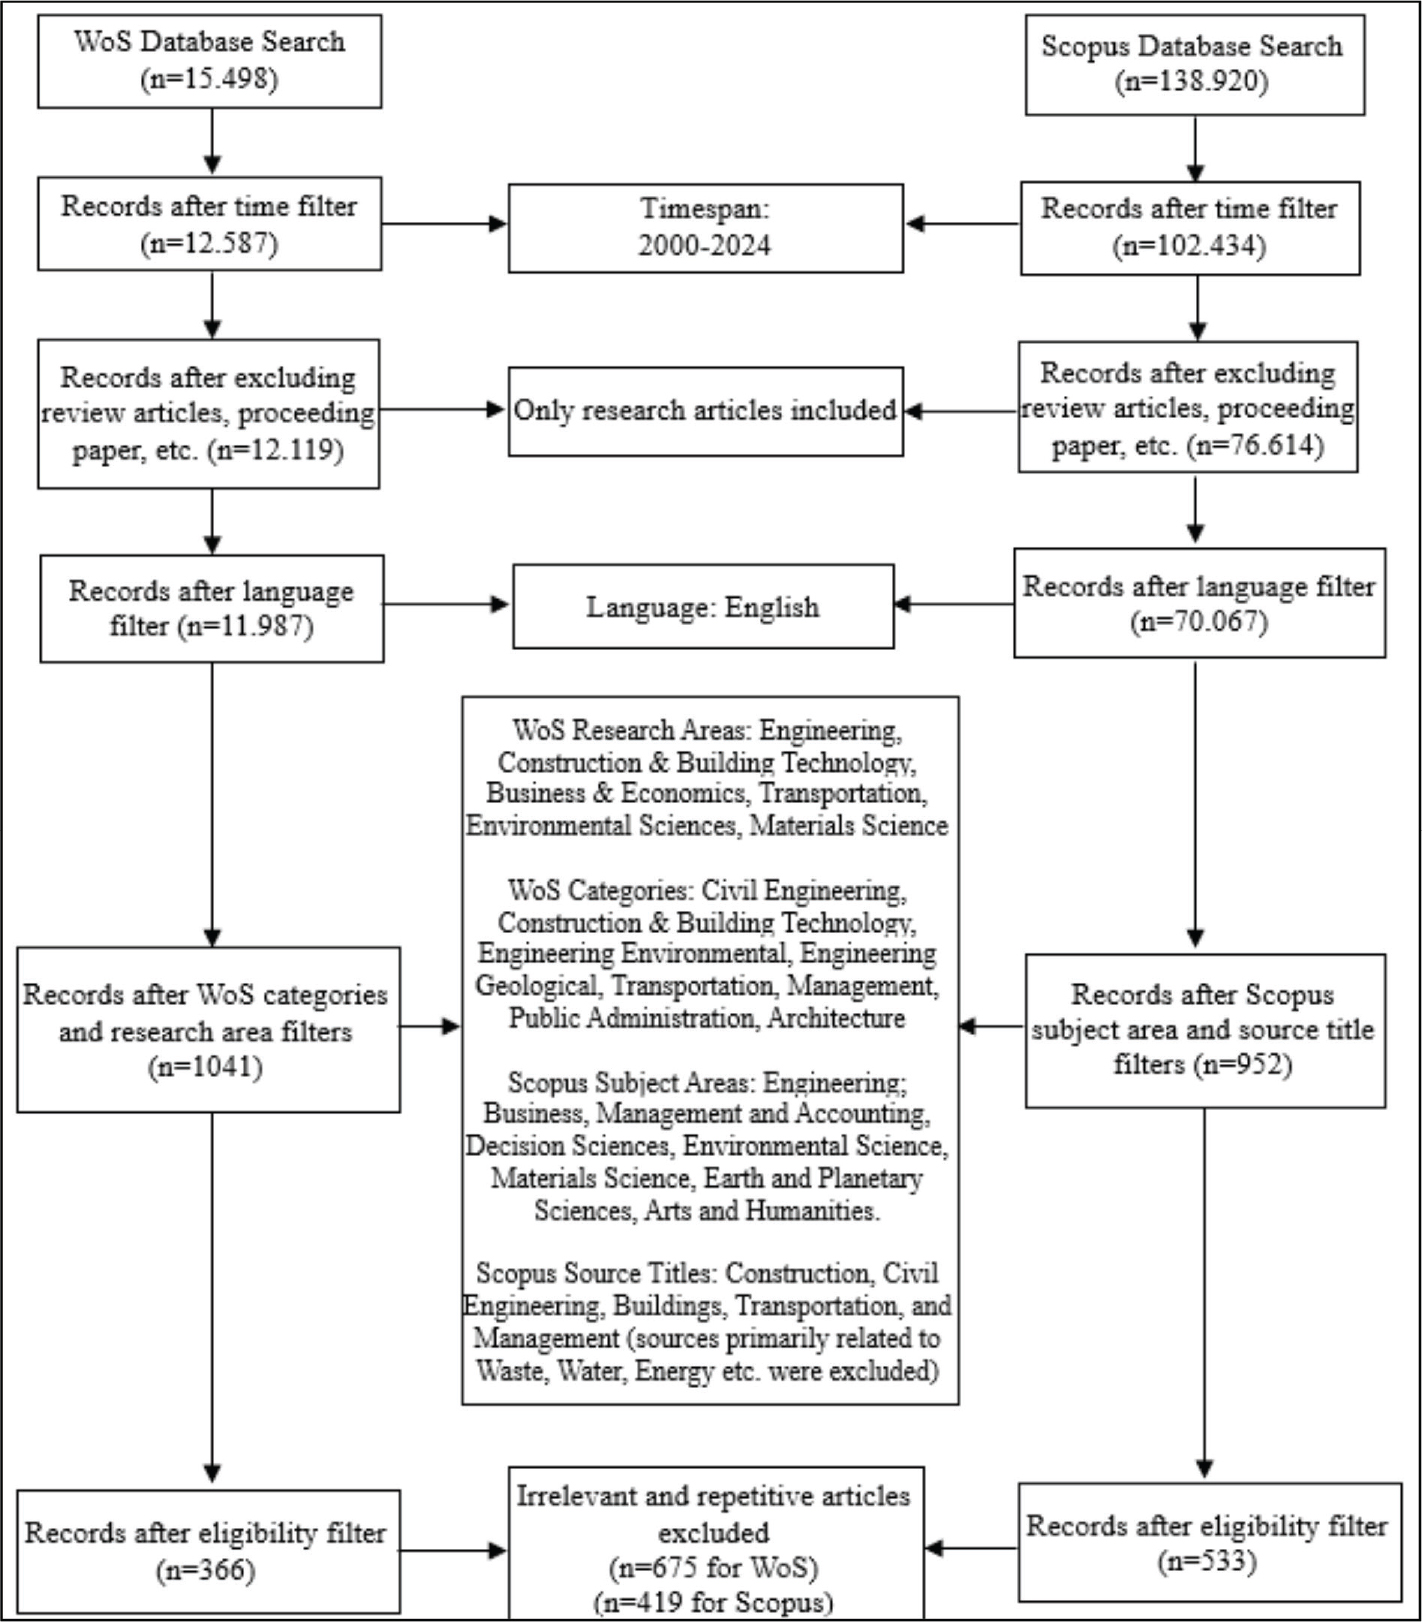
Fig. 1:
PRISMA flow diagram. WoS, Web of Science.
While identical keyword filters were applied across both databases, subject filtering in the Scopus was adapted using broader subject areas and source title restrictions to approximate the WoS category structure. This strategy reflects differences in indexing and classification systems between the two databases.
Duplicate records were checked manually within each database before the final datasets were prepared. The screening was conducted primarily by comparing DOI information. When DOI information was missing or unclear, records were additionally checked based on title and author name/surname. Since the WoS and Scopus were analysed separately rather than merged into a single dataset, cross-database duplicate removal was not applied. The WoS dataset was used for advanced bibliometric analyses including network, clustering and co-occurrence mapping, while the Scopus dataset was used for descriptive and comparative analysis. Therefore, the results presented in network-based analyses are based on the WoS data, whereas the Scopus data are used to support general publication trends and cross-database comparison. The research procedure for the WoS involves quantitative analysis, network analysis and co-occurrence analysis as in Wu et al. (2019).
4. Findings
4.1. Overall status of scientific publications
4.1.1. Article publication trend
Quantitative analysis is used to understand the overall status of construction delays and scheduling publications. The distribution of the WoS and Scopus publications by year is presented in Figure 2.
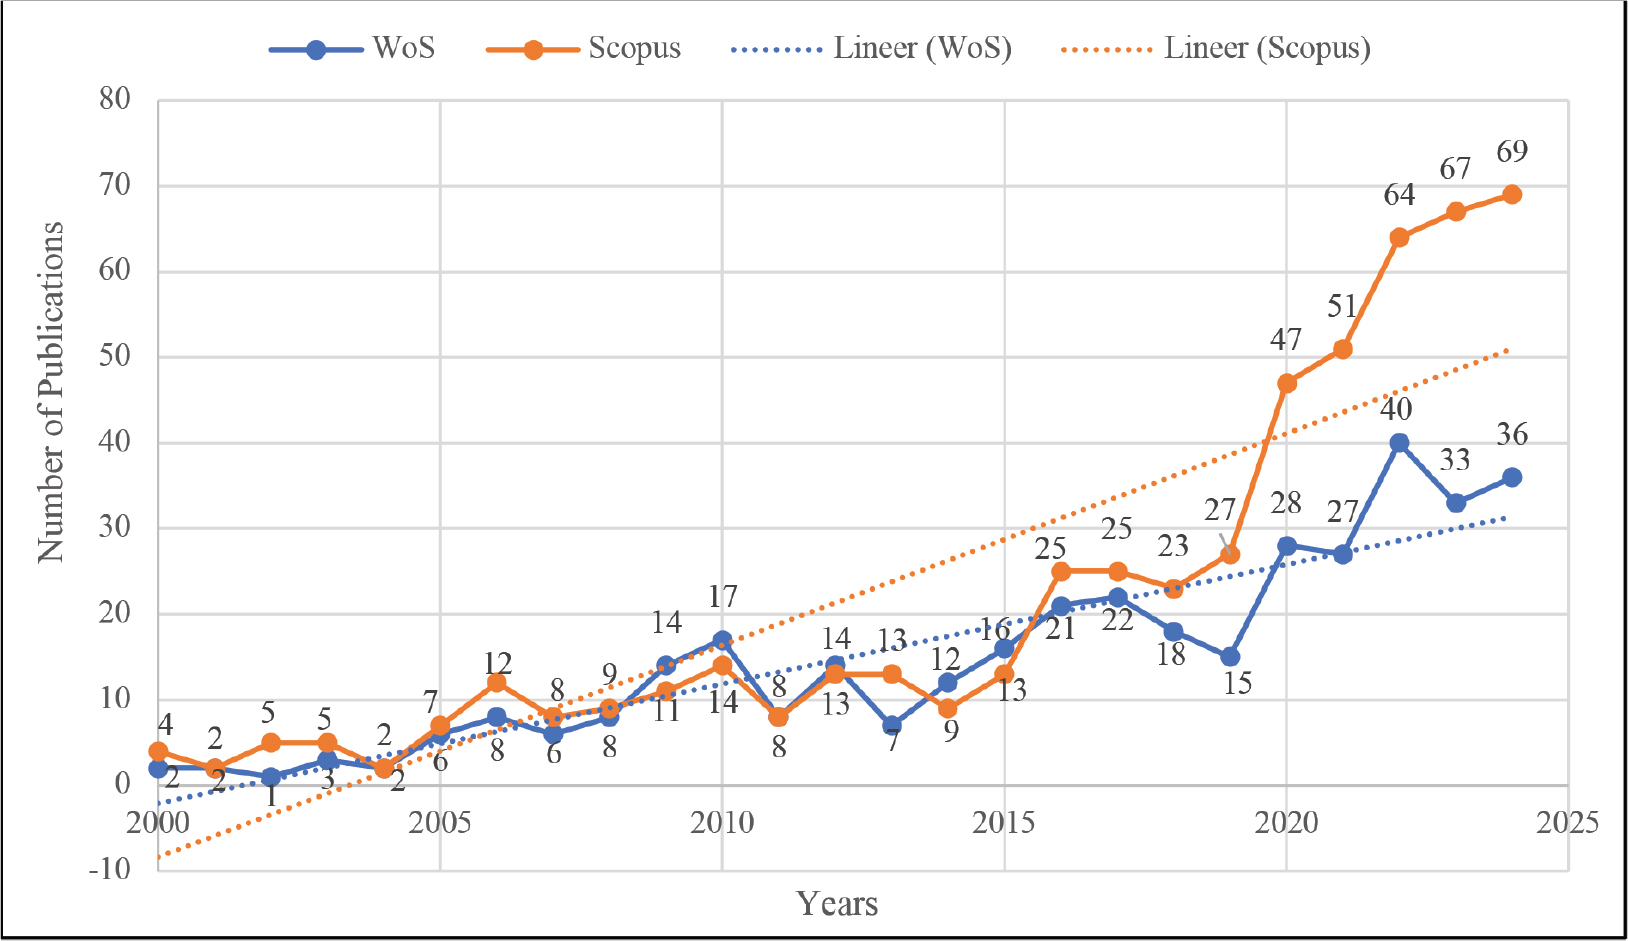
Fig. 2:
Number of publications on related topics by years (2000–2024) for the WoS and Scopus. WoS, Web of Science.
Figure 2 indicates a clear expansion of construction delay research in both WoS and Scopus between 2000 and 2024. In the early 2000s, publication activity remained limited in both databases, but the output gradually increased during the 2010s and accelerated more visibly after 2018. This post-2018 increase suggests that construction delay research has moved from a relatively narrow topic towards a more consolidated research area, likely reflecting growing attention to project time-cost performance, risk-based management, and digital construction practices. Although both databases show the same long-term growth pattern, the Scopus records a larger and smoother increase, reaching more than 60 publications per year by 2023–2024, whereas the WoS shows lower and more fluctuating annual counts. This difference indicates that the Scopus captures a broader and more applied segment of the literature, while the WoS provides a more selective view of the field.
4.1.2. Distribution of published journals
The results in Table 1 show top 10 journals in the WoS and Scopus, their impact factors, and number of publications.
Tab. 1:
Top journals publishing construction delay research in the WoS and the Scopus.
| Database | Journals | Impact factors | Number of publications |
|---|---|---|---|
| WoS | Journal of Construction Engineering and Management | 5.1 | 85 |
| Engineering, Construction and Architectural Management | 3.9 | 40 | |
| Journal of Management in Engineering | 7.0 | 34 | |
| Automation in Construction | 11.5 | 28 | |
| Buildings | 3.1 | 25 | |
| International Journal of Project Management | 7.5 | 13 | |
| Journal of Civil Engineering and Management | 3.7 | 11 | |
| Transportation Research Record | 1.8 | 10 | |
| Canadian Journal of Civil Engineering | 1.1 | 10 | |
| Advances in Civil Engineering | 1.6 | 10 | |
| Scopus | Journal of Construction Engineering and Management | 5.1 | 78 |
| International Journal of Construction Management | 3.4 | 51 | |
| Engineering, Construction and Architectural Management | 3.9 | 41 | |
| Buildings | 3.1 | 28 | |
| Journal of Management in Engineering | 7.0 | 27 | |
| International Journal of Project Management | 7.5 | 25 | |
| Construction Management and Economics | 3.3 | 19 | |
| Automation in Construction | 11.5 | 19 | |
| Journal of Environmental Management | 8.4 | 19 | |
| International Journal of Sustainable Construction Engineering and Technology | 0.5 | 17 |
Table 1 shows that construction delay research is anchored in a relatively small group of specialised construction and project management journals. In both databases, the Journal of Construction Engineering and Management is the leading journal which indicates that delay research remains closely tied to the core construction management literature. However, the journal distribution also reveals an important difference between the two databases. The WoS shows a stronger concentration in established construction and management journals, whereas the Scopus reflects a broader and more interdisciplinary publication structure, including journals related to sustainability and environmental management. This suggests that the field has a dual publication profile: (a) A specialised core represented by construction management journals and (b) A wider applied stream connected to interdisciplinary project delivery, sustainability and environmental concerns. The presence of high-impact journals shows that construction delay research is visible in influential journals, although the field remains mainly concentrated in specialised construction and project management journals.
4.1.3. Author analysis and co-authorship of authors
The results in Table 2 show top 10 authors with the most publications in the WoS and Scopus between 2000 and 2024, and their number of citations.
Tab. 2:
Top 10 authors with the most publications on related topics in the WoS.
| Database | Authors | Number of publications | Citations |
|---|---|---|---|
| WoS | Hegazy, Tarek | 10 | 285 |
| Yang, Jyh-Bin | 10 | 275 | |
| Ballesteros-Perez, Pablo | 7 | 122 | |
| Park, Moonseo | 5 | 118 | |
| Lee-Hyun-soo | 4 | 44 | |
| Lucko, Gunnar | 4 | 7 | |
| Hong, Taehoon | 4 | 60 | |
| Yap, Jeffrey Boon Hui | 4 | 190 | |
| Birgonul, M. Talat | 4 | 80 | |
| Dikmen, Irem | 4 | 80 |
Table 2 shows that productivity and citation impact are related but not identical in construction delay research. Hegazy and Yang represent the most established author core in terms of publication output and citation visibility, while authors such as Yap demonstrate that a smaller number of publications can still generate strong influence. This indicates that the field is not shaped only by publication volume; methodological relevance, topic focus, and citation visibility also affect author-level influence. Overall, the author structure appears moderately dispersed: Several contributors have visible roles, but the field is not organized around a single dominant author or a highly consolidated author group.
Figure 3a presents the overall co-authorship network which exhibits a fragmented structure with several weakly connected clusters. Although some authors, particularly Moonseo Park, stand out in terms of publication output, the network lacks strong global integration. The overlay visualisation indicates that recent studies are concentrated in newer clusters, suggesting expansion without corresponding growth in collaboration. Figure 3b shows the filtered network of core authors, where the structure becomes clearer and reduces to a few key clusters. A central linkage emerges between Martin Skitmore, Jeffrey Boon Hui Yap and Xingyu Tao, indicating their bridging role across groups, while other clusters remain internally cohesive but externally weakly connected.
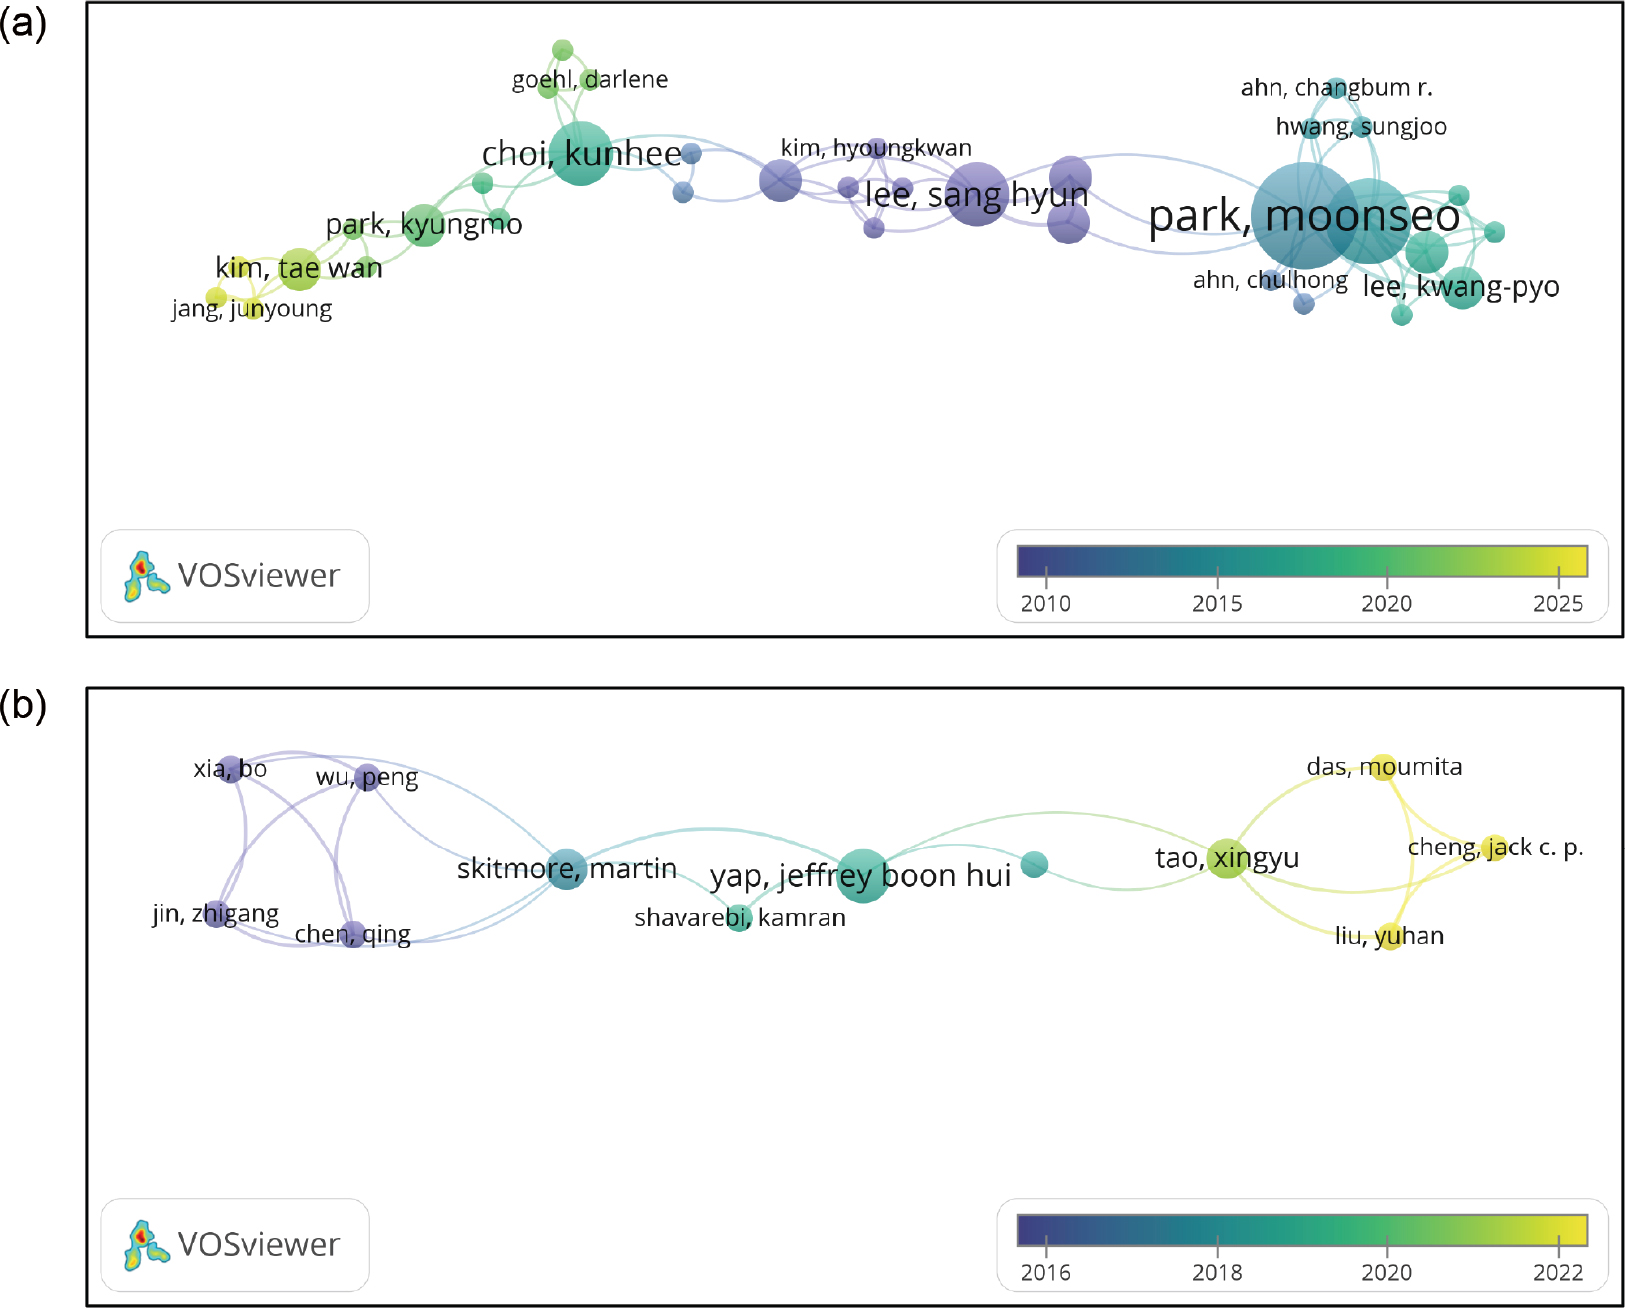
Fig. 3:
(a) Co-authorship network of authors in the WoS dataset. (b) Filtered co-authorship network of core authors.
Note: Node size represents the number of publications. Lines indicate co-authorship links between authors, and colours represent clusters generated by VOSviewer. Figure 3a shows the full author network, while Figure 3b shows the filtered core-author network based on documents ≥2 and citations ≥10. WoS, Web of Science.
The link-based indicators support this fragmented structure. In the core-author network (Figure 3b), the highest TLS values were observed for Moonseo Park (TLS = 11), Pablo Ballesteros-Perez (TLS = 10), and several authors with TLS = 9, including Mohammed S. A. Enshassi, Carl T. Haas, Scott Walbridge, Jeffrey S. West and Jyh-Bin Yang. However, these collaboration strengths are concentrated within small author groups rather than distributed across the full network. Although the filtered network includes 100 authors, only a limited subset (n = 12) appears in connected components in Figure 3b, while many authors remain weakly connected or isolated. This confirms that the author collaboration structure is fragmented and lacks broad cross-cluster integration.
Increasing the citation threshold does not substantially change the network structure. This indicates that the field is not dominated by a highly interconnected group of leading authors. Overall, collaboration is limited and concentrated within small, relatively independent research clusters.
To quantify the structure shown in Figure 3b, density and centrality metrics were calculated for the filtered core-author network. The network consisted of 100 authors and 104 links, which produced a low density value of 0.021 and an average degree of 2.08. Since network density ranges from 0 to 1, this value indicates that only a small proportion of possible co-authorship ties were realised. The average TLS was 3.68, further showing that collaboration intensity is concentrated among a limited number of authors rather than being evenly distributed across the network.
The largest connected component included 12 authors and 22 links, with a higher local density value of 0.333 and an average TLS of 6.00. Betweenness centrality values indicate that Jeffrey Boon Hui Yap (0.545), Martin Skitmore (0.509) and Xingyu Tao (0.436) occupy the main bridging positions within this component. These values are interpreted as relatively high because most other authors have a betweenness value of zero, which indicates that they do not function as intermediaries between different subgroups. These findings show that although a small core group has relatively stronger internal connectivity, the overall author co-authorship network remains weakly integrated.
4.1.4. Country analysis and cooperation network of countries
The results in Table 3 show the top 10 countries with the most publications in the WoS between 2000 and 2024, and their number of citations.
Tab. 3:
Top 10 countries with the most publications on related topics in the WoS.
| Database | Countries | Number of publications | Citations |
|---|---|---|---|
| WoS | USA | 80 | 1,664 |
| China | 72 | 1,913 | |
| England | 39 | 1,002 | |
| South Korea | 34 | 896 | |
| Canada | 30 | 843 | |
| Australia | 29 | 1,232 | |
| Taiwan | 23 | 774 | |
| Iran | 21 | 494 | |
| Turkiye | 14 | 641 | |
| Spain | 13 | 295 |
Table 3 indicates that country-level contribution is concentrated in a small group of highly visible research systems. The USA and China dominate the field in terms of publication output, while China records the highest citation count, suggesting stronger citation visibility within the WoS dataset. However, the relationship between productivity and influence is not linear. Countries such as Australia and Taiwan show relatively high citation impact compared with their publication volume, whereas Spain and Turkiye contribute at a smaller publication number but differ in citations. This pattern suggests that country-level influence in construction delay research should be evaluated through both publication output and citation impact, rather than publication counts alone.
Figure 4a shows the co-authorship network among countries in the WoS dataset. The structure is organised around three main pillars: the United States, China (closely linked with Australia) and England. The United States stands out as a central connector, linking both China and England and facilitating collaboration between different parts of the network. China forms a dense group with countries, such as South Korea, Malaysia and India, indicating strong regional cooperation. England represents another key pillar, collaborating with Canada, Middle Eastern countries, and several European partners, which reflects a more diverse collaboration pattern. Other countries such as Turkiye and the United Arab Emirates are connected to the network but play a more limited role. Overall, the network is shaped by a few dominant countries, with others connected around them.
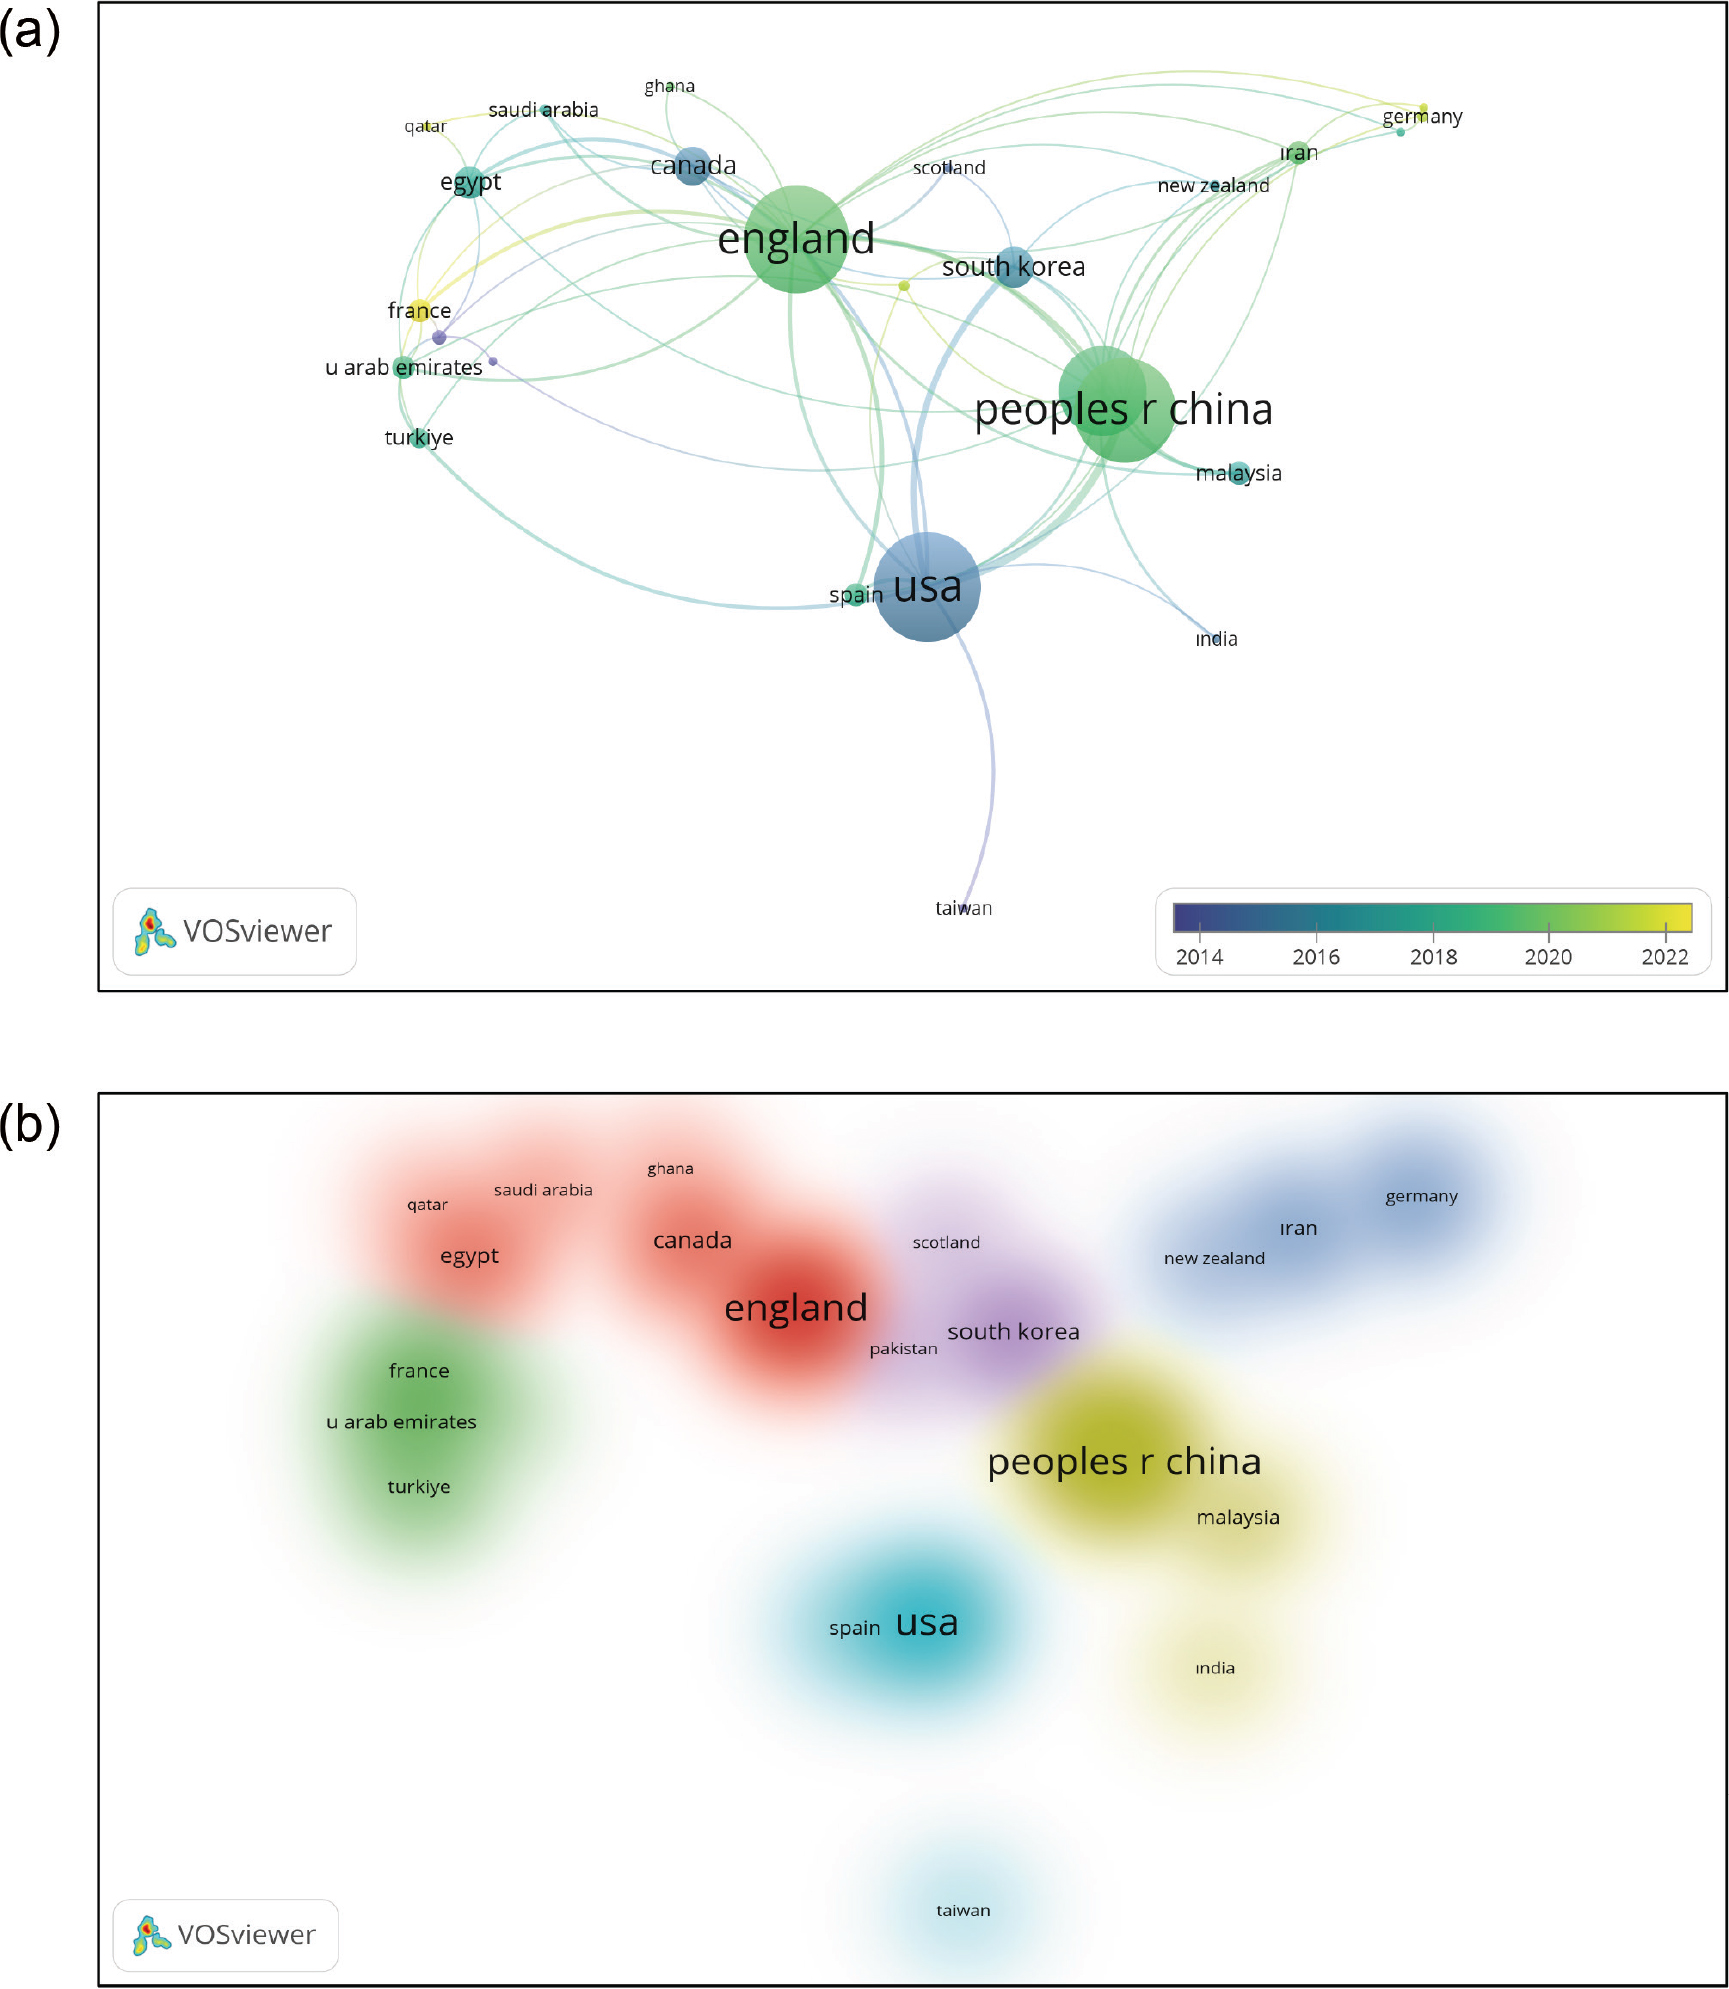
Fig. 4:
(a) Co-authorship network among countries. (b) Visual concentration of country collaboration intensity based on TLS in the WoS. Note: Node size is based on TLS. Lines in Figure 4a indicate country co-authorship links, and colours represent VOSviewer clusters. TLS, total link strength; WoS, Web of Science.
Figure 4b illustrates the intensity of collaboration. The highest density is concentrated around China and the United States, showing that these countries have the strongest collaboration links. England also appears as a prominent area, supporting its role as one of the main pillars. In contrast, regions such as the Middle East and Africa show lower density, indicating weaker and more scattered collaborations. The distribution suggests that international collaboration is concentrated in specific countries rather than evenly spread across the network.
The link-based indicators further clarify the structure of the country co-authorship network. In the country network, all 26 countries were connected to the network, indicating that international collaboration exists across the dataset. Nevertheless, the collaboration strength was highly concentrated around a few central countries. The USA (TLS = 37), England (TLS = 36), China (TLS = 35) and Australia (TLS = 30) had the strongest link profiles, while countries, such as South Korea (TLS = 14), Canada (TLS = 13), Egypt (TLS = 11) and several others remained at lower levels. This pattern suggests that the field has an internationally connected but unevenly structured collaboration network, where a few countries act as central nodes and many others participate more peripherally.
The density and centrality metrics further clarify the structure of the country co-authorship network. The filtered country network consisted of 26 countries and 70 links, producing a density value of 0.215 and an average degree of 5.38. Since the network was fully connected and included no isolated countries, international collaboration appears more integrated than the authorlevel collaboration network. However, the density value indicates that only 21.5% of all possible country-level co-authorship ties were realised. Betweenness centrality results indicate that England (0.405) occupies the most important bridging position in the network, followed by the USA (0.150), Australia (0.131), China (0.069), Canada (0.065) and Iran (0.059). This suggests that although the USA, China and Australia have strong collaboration intensity, England plays the most prominent intermediary role by connecting otherwise less directly linked country groups.
4.1.5. Organisation analysis and cooperation network of organisations
The results in Table 4 show top 10 organisations with the most publications in the WoS between 2000 and 2024, and their number of citations.
Tab. 4:
Top 10 organisations with the most publications on related topics in the WoS.
| Database | Organisations | Number of publications | Citations |
|---|---|---|---|
| WoS | University of Waterloo | 13 | 383 |
| University of Tehran | 10 | 264 | |
| Hong Kong Polytechnic University | 9 | 385 | |
| Chung Hua University | 9 | 284 | |
| Indian Institute of Technology | 9 | 960 | |
| Polytechnic University of Valencia | 8 | 211 | |
| Seoul National University | 7 | 186 | |
| University College London | 7 | 212 | |
| Tongji University | 6 | 147 | |
| National Central University | 6 | 119 |
Table 4 shows that institutional productivity and citation impact do not fully overlap. The University of Waterloo has the highest publication output, while the Indian Institute of Technology achieves the strongest citation visibility despite having fewer publications. This suggests that institutional influence in construction delay research is not only determined by publication volume alone but also by the visibility and citation performance of specific research. Overall, the institutional structure is dispersed but uneven: several universities contribute regularly to the field, yet only some achieve stronger citation-based influence.
Figure 5a shows the co-authorship structure among organisations. The network is centred around Hong Kong Polytechnic University and Queensland University of Technology, which act as the main collaboration points. These institutions are directly connected and link other organisations such as Tsinghua University, Tongji University and Seoul National University. The overall structure is relatively linear, which indicates that collaborations are concentrated around a limited number of leading institutions rather than being widely distributed. Peripheral organisations including City University of Hong Kong and Yonsei University appear at the edges with weaker connections.
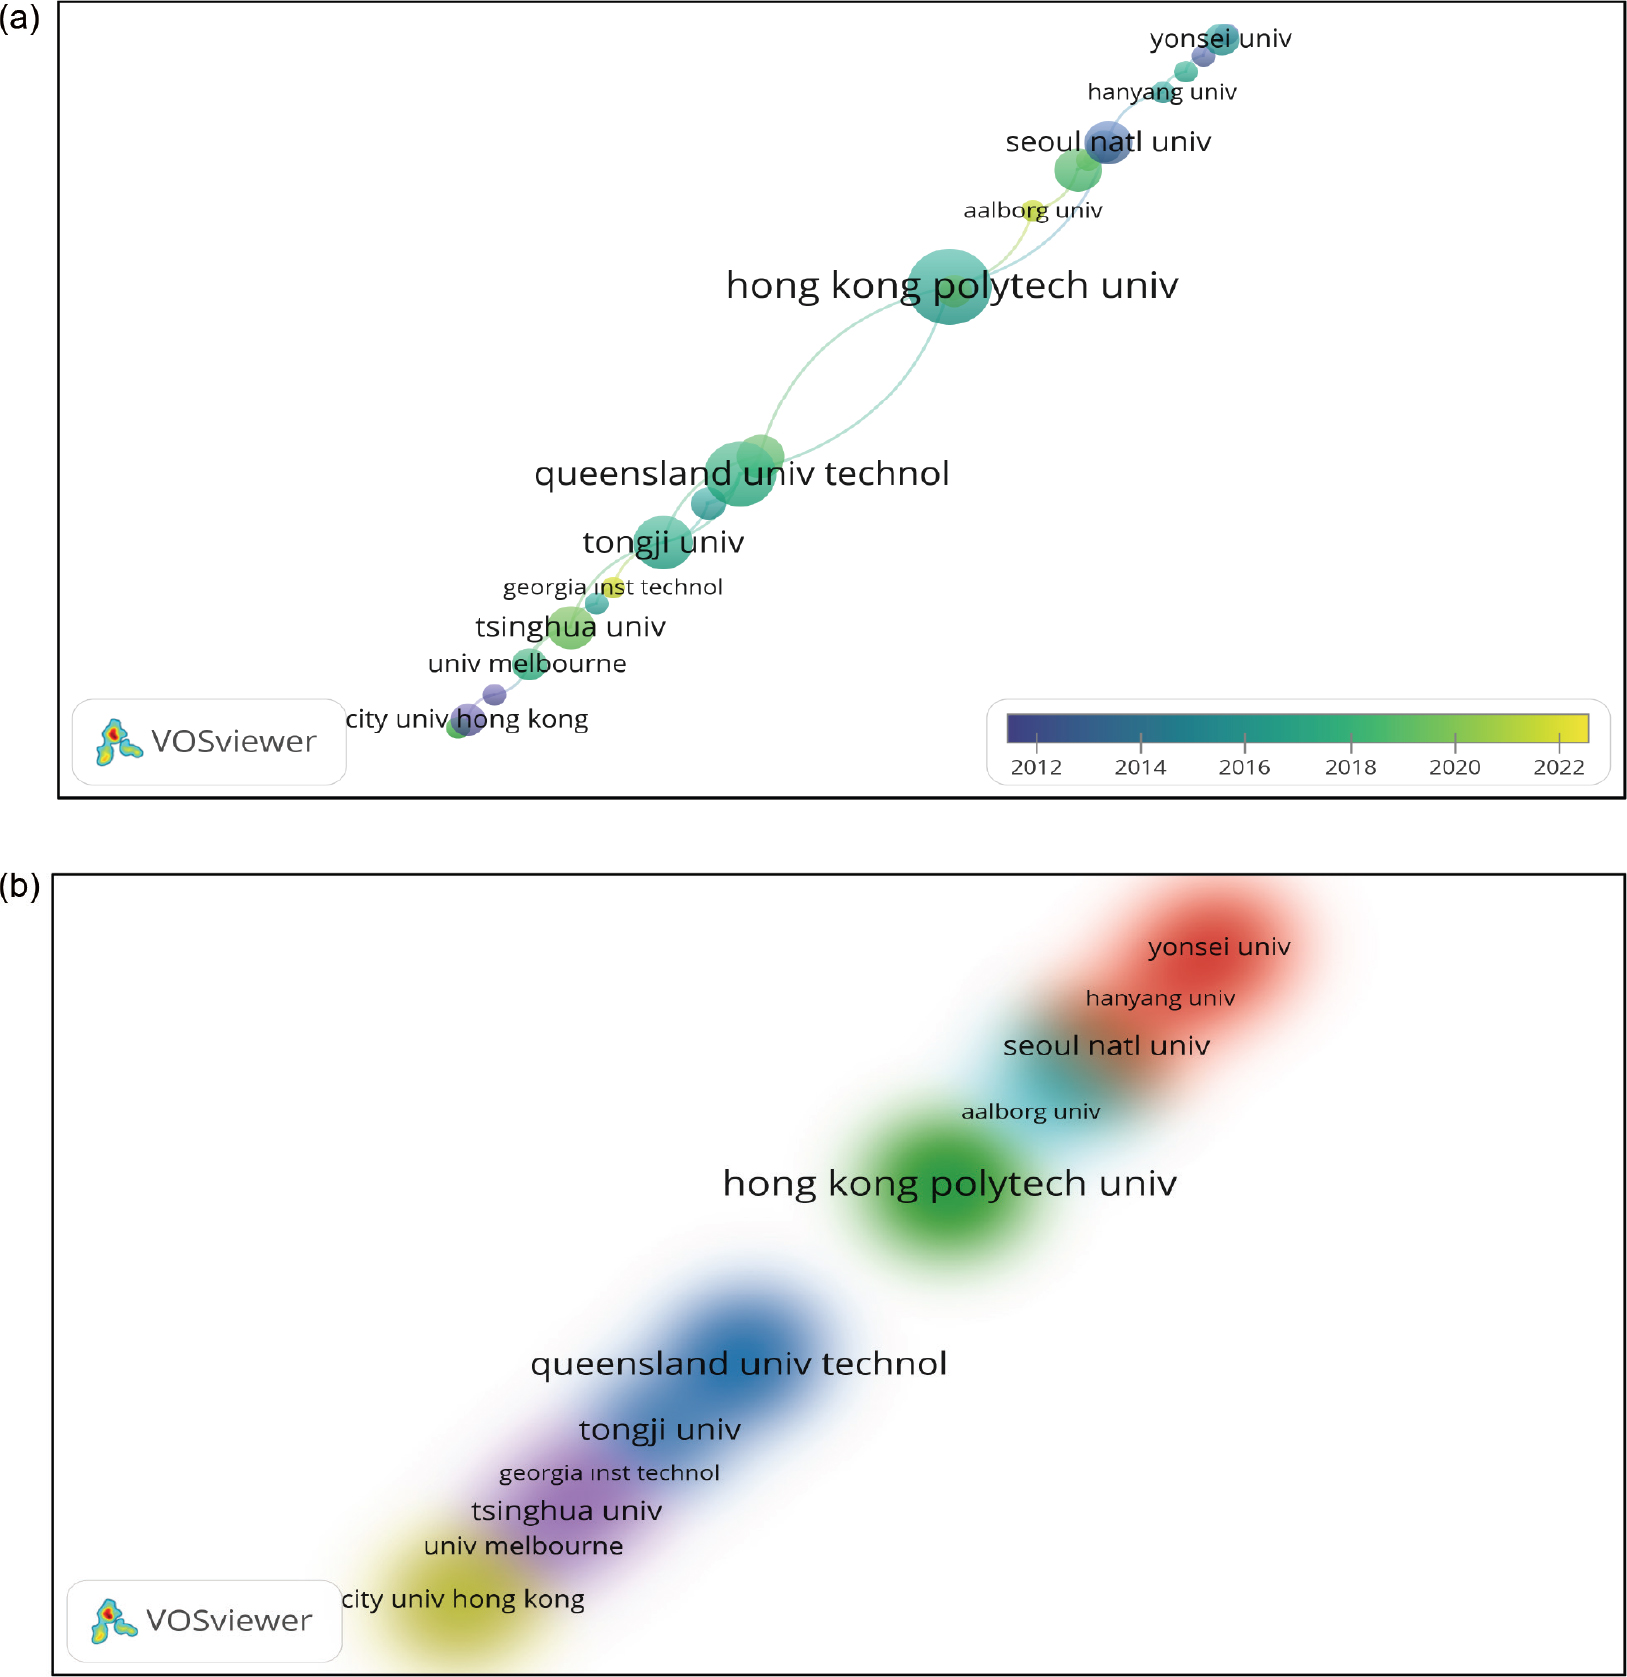
Fig. 5:
(a) Co-authorship network visualisation of organisations in the WoS dataset. (b) Visual concentration of organisational collaboration intensity based on TLS in the WoS.
Note: Node size is based on TLS. Lines indicate organisational co-authorship links, and colours represent VOSviewer clusters. TLS, total link strength; WoS, Web of Science.
Figure 5b illustrates the intensity of collaboration. The highest density is observed around Hong Kong Polytechnic University, confirming its central role in the network. A second area of notable density appears around Seoul National University and its connected institutions, indicating a secondary collaboration cluster. In contrast, institutions located at the lower end of the network, such as City University of Hong Kong and University of Melbourne, show lower density and reflect more limited collaboration intensity. Overall, the density pattern supports the network structure by highlighting that collaboration is concentrated in a few key institutions.
The density and centrality metrics provide additional evidence for the fragmented structure of the organisation co-authorship network. The filtered organisation network consisted of 58 institutions and 47 links, producing a low density value of 0.028 and an average degree of 1.62. The network included 21 disconnected components and 17 isolated institutions, which indicates that institutional collaboration is distributed across small and weakly connected groups rather than forming a cohesive organisational network. The largest connected component included 29 institutions and 36 links with a higher local density value of 0.089 and an average TLS of 2.76. Betweenness centrality results show that Hong Kong Polytechnic University (0.651) occupies the most important bridging position within the largest connected component, followed by Seoul National University (0.462), Tongji University (0.433), Tsinghua University (0.332), University of Melbourne (0.254), Hanyang University (0.254) and Queensland University of Technology (0.249). These findings suggest that institutional collaboration is not only concentrated around a few productive universities but also depends on a limited number of bridging institutions that connect otherwise weakly linked organisational groups.
4.2. Cluster analysis of keywords
Based on the results of cluster analysis, the keywords regarding delays in construction projects can be classified into eight clusters.
Figure 6a presents the cluster structure of the keyword co-occurrence network, revealing eight distinct thematic groups within the literature. The network is strongly centred around the keyword ‘delay’, which appears as the most dominant and highly connected concept, acting as a central node linking multiple clusters. The clustering structure indicates that research on construction delays is organised around several interconnected themes. A central cluster combines delay, cost overrun, and construction project which reflects the core focus on project performance and time-cost relationships. Another prominent cluster is structured around project management and scheduling which emphasises planning and control mechanisms as key components of delay-related research. A separate cluster groups involving risk, decision making, and uncertainty indicate the importance of risk-oriented analytical approaches in understanding delays.
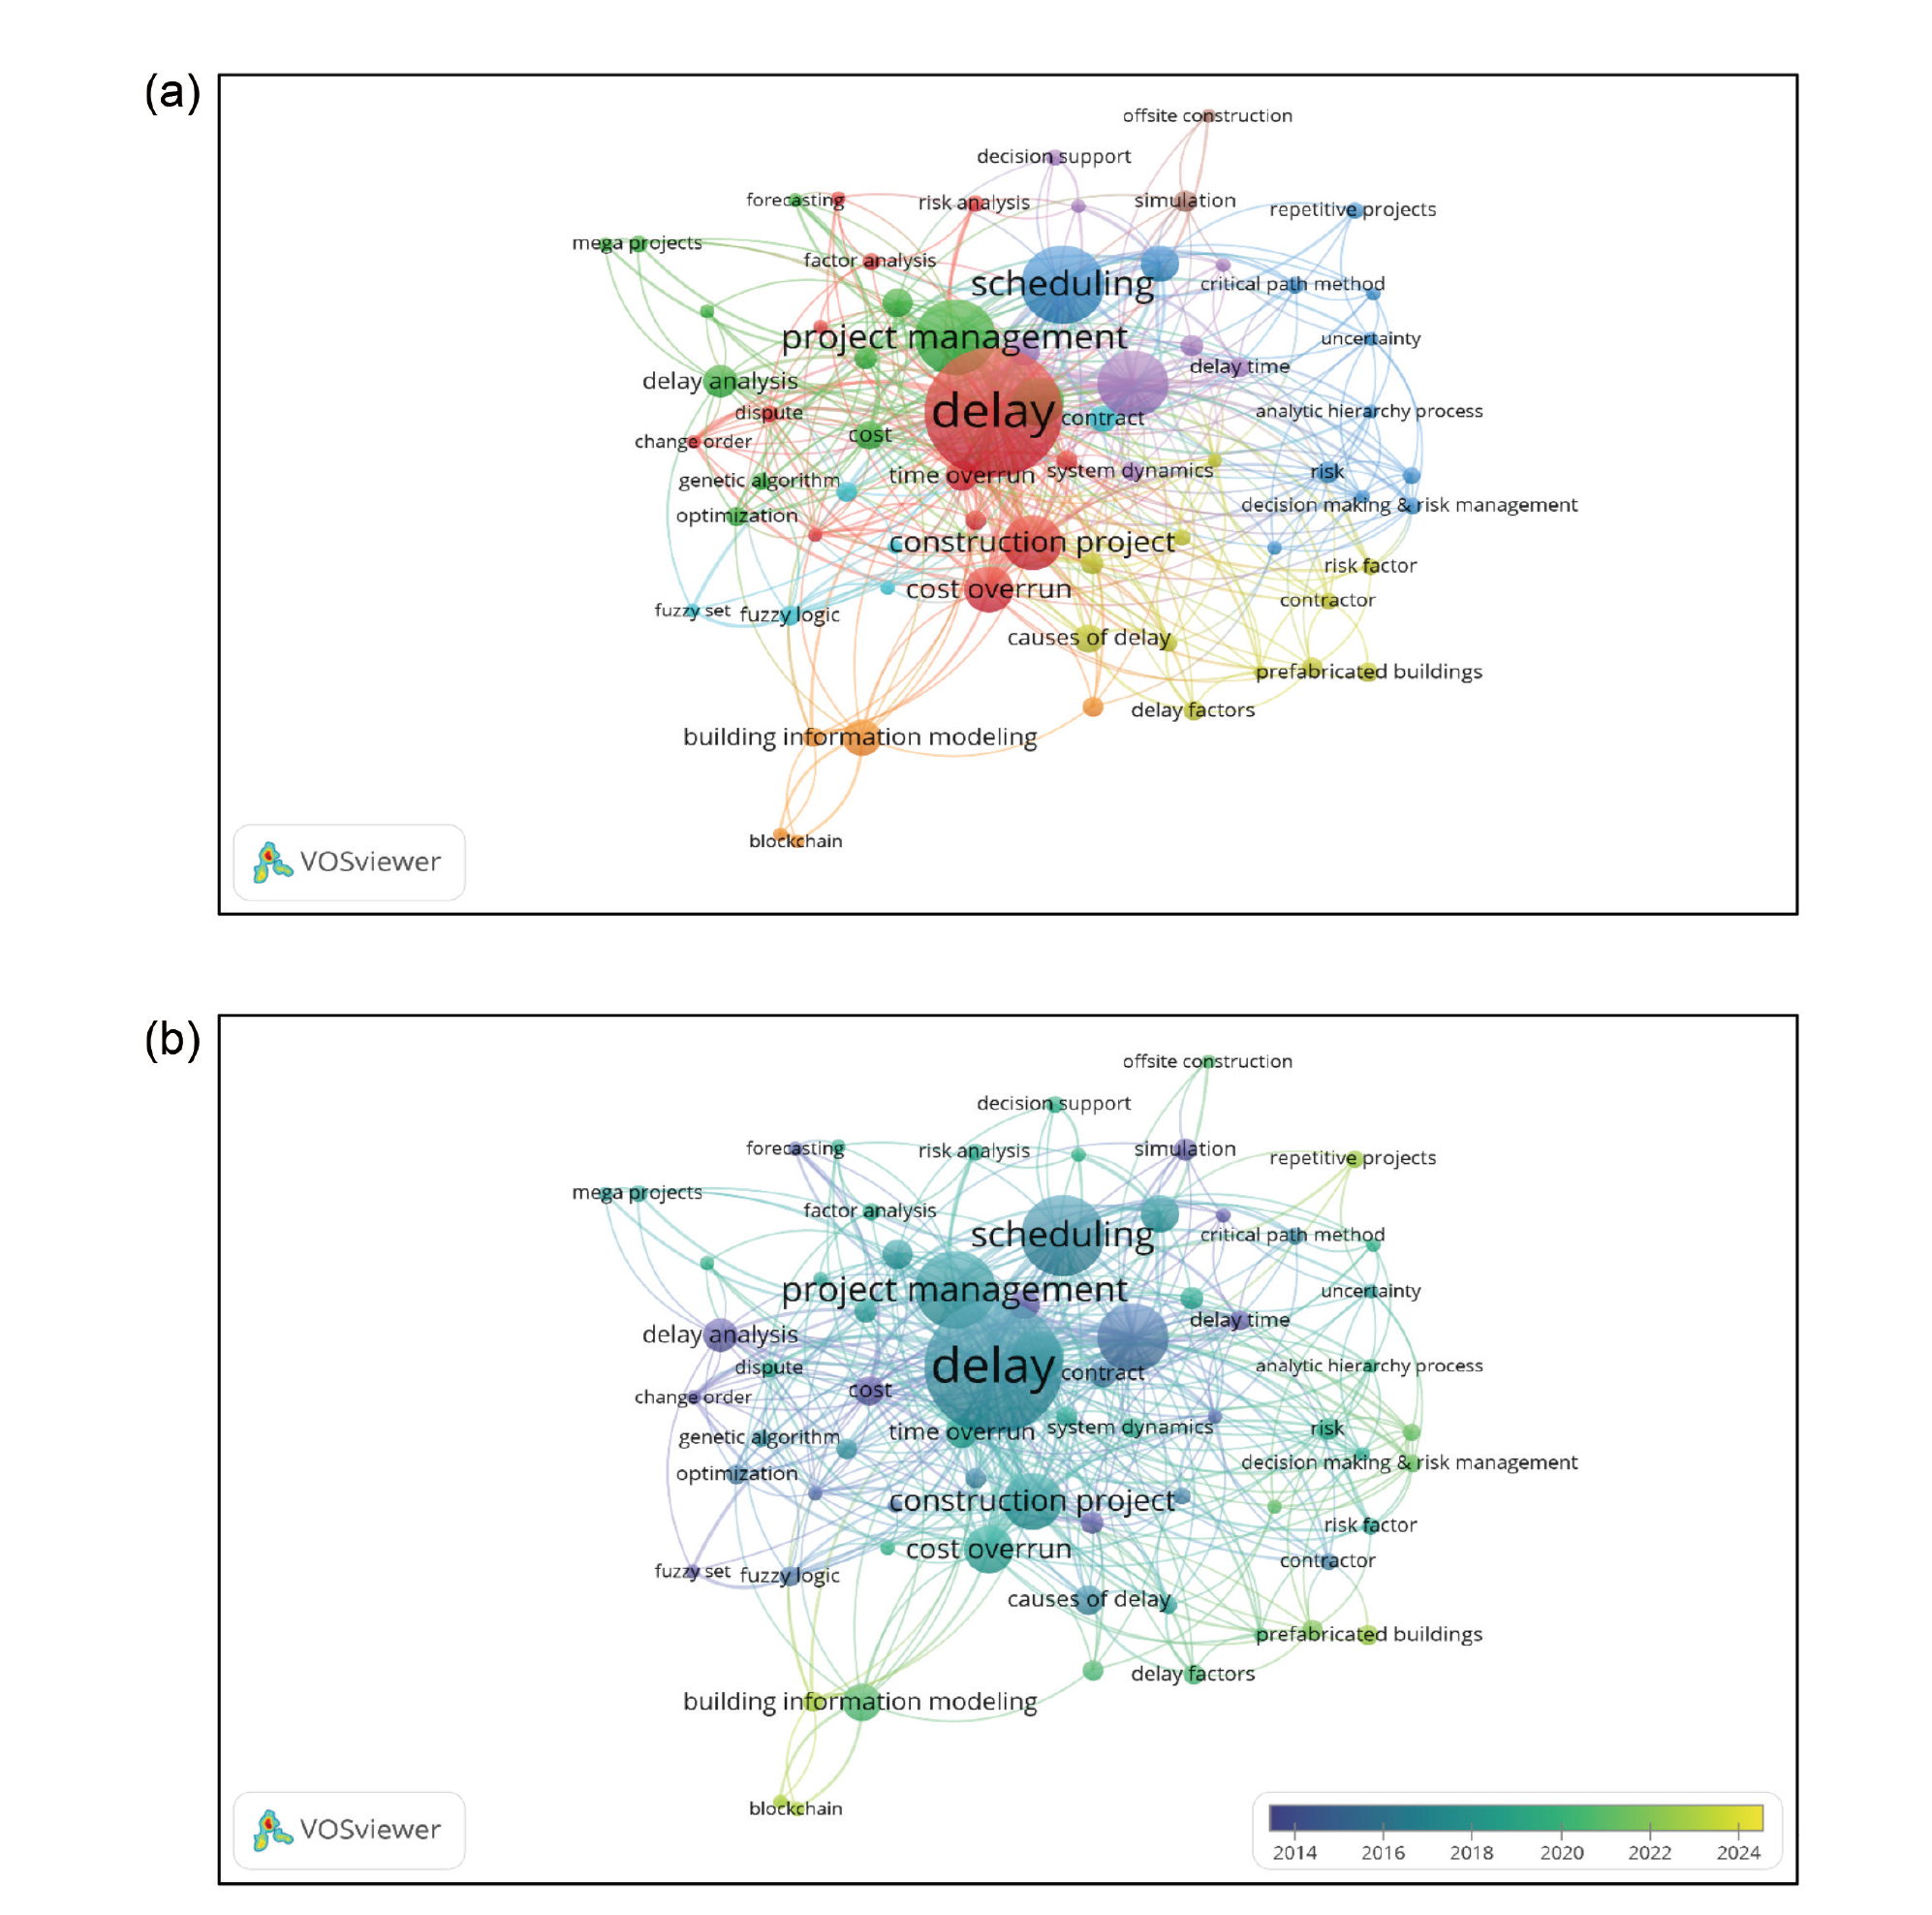
Fig. 6:
(a) Keyword co-occurrence network based on cluster visualisation in the WoS. (b) Overlay visualisation of keyword evolution based on average publication year.
Note: Node size represents keyword occurrence frequency. Lines in Figure 6a indicate keyword co-occurrence links, and colours represent thematic clusters generated by VOSviewer. Colours in Figure 6b represent the average publication year of keywords, ranging from earlier topics in blue to more recent topics in yellow. WoS, Web of Science.
In addition, clusters related to delay factors, causes of delay, and contract/dispute issues suggest that the literature also emphasises explanatory and managerial dimensions of delays. Methodological clusters including fuzzy logic, genetic algorithm, and optimisation, appear more peripheral, indicating that these approaches are applied in more specialised contexts rather than forming the core of the field. Overall, the network structure is highly interconnected, suggesting that research themes are not isolated but are integrated around central problems of delay, cost and project performance. At the same time, the presence of smaller, method-oriented clusters indicates a degree of fragmentation in analytical approaches.
Figure 6b illustrates the temporal evolution of research themes in the field using an overlay visualisation. The results show a clear transition from traditional planning-oriented topics towards more data-driven and technology-based approaches. Earlier studies represented in darker blue tones are primarily associated with keywords such as scheduling, critical path method, and delay analysis. These topics indicate that early research focused on deterministic planning techniques and time management frameworks. In the intermediate period, themes such as project management, delay, and cost overrun become more prominent, reflecting a shift towards integrated performance analysis and managerial perspectives.
More recent studies, shown in yellow tones, increasingly focus on emerging and technology-oriented topics, such as machine learning, building information modelling, blockchain and prefabrication. These keywords are typically positioned towards the periphery of the network, suggesting that while they represent growing areas of interest, they are not yet fully integrated into the core structure of the literature. This temporal pattern indicates a methodological and conceptual shift in construction delay research where a shift emerges from traditional scheduling-based approaches towards advanced analytical methods and digital technologies. The coexistence of established core themes and emerging techniques suggests that the field is evolving towards a more interdisciplinary and computational structure.
According to the Table 5, a total of eight clusters involving 69 items were obtained. These clusters are: Cluster (1) Core project performance and delay outcomes; Cluster (2) Project planning, optimisation and decision processes; Cluster (3) Quantitative risk analysis and decision-support modelling; Cluster (4) Delay causes and project context factors; Cluster (5) Project control and system-based management approaches; Cluster (6) Fuzzy-based and structural modelling approaches; Cluster (7) Digital technologies and data-driven methods; Cluster (8) Offsite construction and simulation applications. Cluster definitions were derived by jointly considering keyword co-occurrence patterns and TLS. The most central and strongly connected terms (typically the top 2–4 keywords within each cluster) were prioritised while occurrences were used as a supporting indicator to ensure thematic representativeness.
Tab. 5:
Keyword clusters and thematic classification of delay research.
| Cluster No. | Cluster definition | Related keywords |
|---|---|---|
| Cluster 1 (13 items) | Core project performance and delay outcomes | Change order, construction project, cost overrun, delay, dispute, factor analysis, productivity, project performance, public projects, regression, rework, risk analysis, time overrun |
| Cluster 2 (12 items) | Project planning, optimisation, and decision processes | Claim management, construction planning, cost, decision making, delay analysis, forecasting, genetic algorithm, mega projects, optimisation, planning, project management, risk management |
| Cluster 3 (12 items) | Quantitative risk analysis and decision-support modelling | AHP, artificial neural network, Bayesian network, construction, critical path method, decision making & risk management, Monte Carlo simulation, programme & project management, repetitive projects, risk, scheduling, uncertainty |
| Cluster 4 (11 items) | Delay causes and project context factors | Causes of delay, contractor, cost and schedule, delay factors, developing countries, highways and roads, interpretive structural modelling, prefabricated buildings, public-private partnership, risk factor, road projects |
| Cluster 5 (8 items) | Project control and system-based management approaches | Claim, construction management, decision support, delay time, infrastructure project, project risk management, resource allocation, system dynamics |
| Cluster 6 (6 items) | Fuzzy-based and structural modelling approaches | Construction industry, contract, design-build, fuzzy logic, fuzzy set, structural equation modelling |
| Cluster 7 (5 items) | Digital technologies and data-driven methods | Blockchain, building information modelling, COVID-19, machine learning, smart contracts |
| Cluster 8 (2 items) | Offsite construction and simulation applications | Offsite construction, simulation |
Table 5 shows that construction delay research is organised around three broad directions. The first cluster represents the core outcome-oriented dimension of construction delay research, focusing on time and cost overruns, productivity and project performance. It captures studies that evaluate the impacts of delays and their interrelations with management practices and dispute processes. The second cluster focuses on planning and optimisation-oriented approaches including forecasting and algorithm-based methods. It reflects efforts to improve scheduling efficiency and project decision-making through analytical and optimisation techniques. The third cluster highlights the use of advanced quantitative methods such as analytic hierarchy process (AHP), Bayesian networks, simulation, and critical path techniques. It represents the methodological core of the field, emphasising uncertainty modelling and risk-informed decision-making. The fourth cluster identifies the underlying causes of delays and their contextual determinants including contractor-related issues, infrastructure characteristics and developing country conditions. It reflects a problem-oriented perspective in the literature. The fifth cluster represents system-oriented management approaches including resource allocation, system dynamics and infrastructure project control. It emphasises integrated and dynamic methods for managing complex construction processes. The sixth cluster addresses the application of fuzzy logic and structural equation modelling in delay analysis. It is also related to handling uncertainty (as in Cluster 3) and modelling complex relationships within construction project environments. The seventh cluster captures the growing role of digitalisation in construction management, including BIM, blockchain, machine learning and smart contracts. It reflects a shift towards data-driven and technology-enabled delay mitigation strategies. The last cluster is a niche but emerging area (based on colourisation in Figure 6b) focusing on offsite construction methods and simulation-based approaches. It reflects innovative construction practices aimed at improving efficiency and reducing delays.
The density and centrality metrics further support the integrated thematic structure shown in the keyword co-occurrence maps. The keyword network consisted of 69 keywords and 416 links that produced a density value of 0.177 and an average degree of 12.06. Since the network had a single connected component and no isolated keywords, the results indicate that delay-related research forms a relatively connected thematic structure. The average TLS was 18.84, showing that co-occurrence intensity is concentrated around a set of core concepts.
Total link strength values show that the strongest conceptual profiles belong to delay (TLS = 138), construction management (TLS = 76), project management (TLS = 70), scheduling (TLS = 70), cost overrun (TLS = 64), construction project (TLS = 44) and risk management (TLS = 44). Betweenness centrality results indicate that delay (0.262) occupies the most important bridging position in the keyword network, followed by construction management (0.100), project management (0.091), scheduling (0.061), cost overrun (0.047), risk management (0.037), building information modelling (0.037), construction project (0.034) and time overrun (0.030). These findings suggest that delay functions as the central concept of the field while construction management, project management, scheduling and cost overrun connect different thematic areas such as project performance, risk management, planning and digital or model-based approaches.
5. Discussion
5.1. Cross-database comparison of publication trends and topic shifts over time
A closer comparison of the WoS and Scopus databases suggests that differences in publication volume and growth patterns are influenced not only by actual research output but also by database coverage and indexing policies. The higher and more stable counts in Scopus may be attributed to its broader journal coverage, particularly in applied and interdisciplinary fields, whereas the WoS applies more selective indexing criteria. This may explain the lower counts and relatively higher year-to-year variability observed in the WoS. Importantly, this difference does not undermine the validity of network-based findings derived from the WoS, but rather reflects its more selective structure, which tends to emphasise well-established and high-impact research. In contrast, the Scopus appears to capture a wider range of emerging and applied studies, contributing to its stronger growth pattern. Furthermore, publication acceleration after the year 2018 observed in both datasets likely reflects a structural shift in the field. This shift is driven by increasing project complexity (Sun et al. 2022), globalisation of construction activities (Ismail and Yuliyusman 2012), and the growing use of data-driven and computational approaches (Mohammed et al. 2025) in delay analysis.
Research on construction delays has undergone a clear shift between 2000 and 2024. Early studies were largely descriptive, listing delay causes, such as labour shortages, material problems, and client-related issues and documenting their frequency and impact (Assaf and Al-Hejji 2006; Sambasivan and Soon 2007). As project environments became more complex and disputes more common, the 2010s witnessed a shift towards delay analysis including techniques such as Time Impact Analysis and window analysis and towards research on claims, disputes, and early stage conflict avoidance. Cevikbas and Isik (2021) show that two dominant streams emerged in this period: improving analytical delay methods and developing proactive dispute-prevention strategies. Likewise, Perera and Sutrisna (2010) emphasised that existing analysis methods were still imperfect, motivating methodological refinement. Since the late 2010s, the field has shifted again towards preventative, predictive and computational approaches. Scholars increasingly use risk forecasting, simulation, BIM-based project control and artificial intelligence (AI)-driven prediction models to anticipate delays before they materialise (Gondia et al. 2020; Gurgun et al. 2024). Parallel to this, interest has expanded to holistic management frameworks, including lean and agile scheduling methods, and to questions of resilience and sustainability in maintaining robust project timelines. Recent reviews (Ates et al. 2025) reflect a growing emphasis on delay mitigation strategies rather than simply cataloguing causes. Overall, the field has progressed from identifying delay problems to solving them: moving from lists of delay factors towards data-driven prediction, risk-aware planning, improved dispute resolution and proactive schedule management aligned with the demands of increasingly complex construction environments.
5.2. Collaboration patterns and networks
The bibliometric analysis provides a nuanced structure of co-authorship patterns, institutional collaborations and country-level interactions in construction delay research. While the field appears geographically widespread, the empirical findings indicate a structurally fragmented and unevenly distributed collaboration network rather than a globally integrated knowledge system.
At the author level, the results show that productivity is distributed across multiple researchers rather than concentrated in a single dominant scholar. Although authors such as Hegazy and Yang stand out in terms of both publication output and citation impact (Hegazy and Kamarah 2008, 2022; Hegazy et al. 2011; Yang and Kao 2012; Yang et al. 2013), the overall structure suggests a decentralised authorship pattern with heterogeneous influence levels. Notably, authors with similar publication counts exhibit substantial differences in citation performance, indicating that productivity does not necessarily correspond to impact. More importantly, the co-authorship network reveals a fragmented structure composed of loosely connected clusters (Kim et al. 2015; Choi et al. 2021; Jang et al. 2024). Even when applying stricter thresholds, the network does not converge into a cohesive core, which suggests that the field lacks a strongly interconnected group of leading scholars. Instead, collaboration remains largely confined within small research groups, with only a limited number of bridging authors (Yap and Skitmore 2018; Tao et al. 2021) linking otherwise disconnected clusters.
At the country level, the findings confirm that research output is concentrated in a limited number of dominant countries, particularly the United States and China, followed by England and other developed economies. However, this dominance is not uniform in terms of impact. For instance, China surpasses the United States in citation counts despite slightly lower publication output, while countries such as Australia achieve disproportionately high citation impact relative to their publication volume. This shows that scientific influence is not only strictly proportional to productivity but is also shaped by factors, such as research quality, collaboration intensity and journal visibility. The co-authorship network further reveals a multi-polar structure organised around three main central nodes: the United States, China, and England. These countries act as central connectors, yet the overall network remains regionally clustered rather than globally integrated. Strong collaboration is observed within regional blocs (e.g., East Asia or Anglo-European networks), whereas cross-regional linkages remain limited. This supports the argument that knowledge production in the field is shaped by geographically bounded collaboration systems. Similar underrepresentation of developing economies has also been noted in construction management bibliometric research (He et al. 2019), suggesting that the present pattern is not unique to delay research. This pattern may also partly reflect broader socio-economic and institutional inequalities in global knowledge production. For developing countries, lower visibility in indexed bibliometric datasets may be associated with research funding gaps, limited access to international publication channels, language-related barriers, and weaker participation in cross-regional research networks (Chan et al. 2011; Harle and Warne 2020; İlhan et al. 2024). Therefore, the underrepresentation of developing countries can be also interpreted as a reflection of wider publication and research-capacity barriers.
At the organisational level, a similar pattern emerges. Research output is distributed across multiple institutions, but collaboration networks are concentrated around a small number of central universities such as Hong Kong Polytechnic University (Lee et al. 2017) and Queensland University of Technology (Chen et al. 2016). These institutions function as network centres, linking otherwise disconnected organisations. However, the overall structure is relatively linear and lacks dense interconnectivity, indicating that institutional collaboration is not widely diffused across the network. Peripheral institutions exhibit weaker connections and lower collaboration intensity (Hong et al. 2011; Leung et al. 2024), reinforcing the idea that knowledge production is clustered rather than evenly distributed.
These findings point to a structurally fragmented collaboration system operating at multiple levels (author, country and institution). This fragmentation can partly be explained by the context-specific nature of construction delays where local regulatory environments (Zaray et al. 2026), labour conditions (Sambasivan and Soon 2007) and project characteristics (Francis et al. 2022) shape research agendas. However, the persistence of weak cross-cluster connections suggests that the fragmentation is not solely contextual but also structural. In particular, the limited number of bridging actors (both at the author and institutional level) restricts knowledge diffusion across regions and research communities. From a theoretical perspective, this structure reflects a clustered knowledge production system rather than a cumulative global network where parallel research develops with limited interaction. While such specialisation may support context-specific problem solving (Sillars 2009; Arashpour et al. 2015; Jang et al. 2024), it also risks duplication of efforts and slower dissemination of methodological advancements. Therefore, the findings suggest that strengthening cross-regional and cross-institutional collaboration remains a critical issue for the field. Increasing the number of bridging collaborations and integrating currently isolated clusters could enhance both the robustness and generalisability of research on construction delays.
5.3. Thematic clusters in delay research
The identified eight clusters can be grouped into three broader thematic domains for discussion:
(i) performance outcomes and causes (Clusters 1 and 4),
(ii) planning and control processes (Clusters 2 and 5), and
(iii) methodological and technological approaches (Clusters 3, 6 and 7), with Cluster 8 representing a niche research direction. This structure indicates that the field is not fragmented randomly but organised around a problem-process-method continuum where empirical observations, managerial responses and analytical tools evolve together. This continuum also strengthens the theoretical interpretation of the results by linking the clusters to core dimensions of construction management, namely project performance, planning and control, risk and uncertainty and digital decision support (Assaf and Al-Hejji 2006; Sambasivan and Soon 2007; Gondia et al. 2020). Clusters 1 and 4 correspond to the performance-oriented logic of construction management, where delay is understood through its effects on time, cost, productivity, disputes, and project outcomes (Aibinu and Jagboro 2002; Assaf and Al-Hejji 2006; Sambasivan and Soon 2007; Shane et al. 2009). Clusters 2 and 5 reflect the planning and control dimension of project management theory which emphasises scheduling, forecasting, resource allocation, optimisation and system-based coordination (Li et al. 2006; Han et al. 2012; Ballesteros-Pérez et al. 2020; Yang et al. 2022). Clusters 3, 6 and 7 extend this structure towards risk, uncertainty and decision-support perspectives by showing how delay research has moved from descriptive explanation to probabilistic modelling, fuzzy/structural approaches and digital prediction (Namazian and Haji-Yakhchali 2018; Acar-Yildirim and Akcay 2019; Siraj and Fayek 2019; Dikmen et al. 2021). Therefore, the cluster structure also reflects the theoretical evolution of construction delay research from performance diagnosis towards control, risk-informed decision-making and technology-enabled prevention. This is also supported by recent bibliometric studies on construction project management, which show a similar shift towards BIM-based scheduling, digital monitoring, AI-supported risk management and data-driven decision support (Tian et al. 2025; Torres et al. 2025).
The keyword co-occurrence analysis confirms that the intellectual core of construction delay research remains anchored in the relationship between delays, cost overruns and project performance (Cluster 1). This cluster reflects the foundational project management principle that time, cost and productivity are interdependent dimensions. Empirical studies consistently demonstrate that delays are strongly associated with cost escalation and productivity loss (Assaf and Al-Hejji 2006; Sambasivan and Soon 2007; Shane et al. 2009; Mahamid 2022; Lee 2023). Highly cited contributors such as Hegazy and Yang can be linked to this cluster because their studies contributed to modelling and interpreting delay causes, schedule impacts, and project performance consequences (Hegazy and Zhang 2005; Yang et al. 2010; Hegazy et al. 2011). Their work therefore connects the keyword-based cluster with the substantive problem of how delays translate into cost escalation, claims and performance deterioration. However, the persistence of this cluster also indicates a structural limitation. Despite decades of research, the field continues to reproduce similar empirical findings, which suggests that problem identification has advanced faster than problem resolution.
Cluster 4 complements this by focusing on delay causes and contextual factors, particularly in developing country settings. In this cluster, Birgonul and Dikmen are relevant because their studies connect delay and risk analysis with uncertainty, contractor performance and project-specific decision-making conditions (Birgonul et al. 2015). This makes Cluster 4 important for explaining why delay factors vary across institutional and regional contexts (Famiyeh et al. 2017; Alajmi and Ahmed Memon 2022; Sun et al. 2022; Nadeem et al. 2023). While this cluster is essential for understanding the origins of delays, its relatively peripheral network position suggests that context-specific knowledge remains weakly integrated into the broader theoretical framework. This supports the argument that the literature still relies heavily on descriptive and casebased approaches (Xie et al. 2023; Akinola et al. 2024; Alemayehu et al. 2024), limiting the generalisability of findings across regions.
Clusters 2 and 5 represent a transition towards planning, optimisation and control-oriented approaches. These clusters reflect the increasing emphasis on improving project delivery through better decision-making, resource allocation and system-level coordination. Research in this domain includes forecasting techniques (Li et al. 2006; Ballesteros-Pérez et al. 2020; Servranckx et al. 2021), optimization models (Tran and Long 2018; Zou et al. 2022) and system dynamics approaches (Han et al. 2012; Wang and Yuan 2017; Hajarolasvadi and Shahhosseini 2022), indicating a shift from reactive to proactive management. Ballesteros-Pérez is particularly relevant to this cluster because his studies connect construction planning with forecasting, weather-related uncertainty, duration estimation and optimization-based project control (Ballesteros-Pérez et al. 2017, 2018, 2019). This contribution helps explain why Clusters 2 and 5 represent a shift from identifying delay causes towards improving planning accuracy and proactive control mechanisms. This shift aligns with broader trends in project management literature where integrated planning and control systems are considered critical for managing complex projects (Yang et al. 2022; Sheikhkhoshkar et al. 2024). However, the coexistence of traditional planning methods with newer optimisation techniques suggests that the field has not yet achieved full methodological convergence.
Clusters 3 and 6 form the methodological backbone of the literature, focusing on quantitative modelling and uncertainty analysis. These clusters include techniques, such as AHP (Park et al. 2019), Bayesian networks (Namazian and Haji-Yakhchali 2018), Monte Carlo simulation (Eshtehardian and Khodaverdi 2016) and fuzzy logic (Acar-Yildirim and Akcay 2019). The increasing use of these methods reflects a shift towards probabilistic and data-driven approaches in delay analysis (Siraj and Fayek 2019; Koulinas et al. 2020). Researchers such as Dikmen and Birgonul contribute significantly to this cluster through their work on risk and decision-making frameworks (Budayan et al. 2018; Dikmen et al. 2021). These studies contribute to the field by converting delay-related uncertainty into structured risk variables, expertbased evaluations and model-based decision inputs. Therefore, Clusters 3 and 6 represent the methodological transition of delay research from descriptive factor identification towards probabilistic, fuzzy-based and decision-support-oriented analysis. Despite this methodological advancement, the separation between Cluster 3 and Cluster 6 suggests that analytical approaches are still methodologically fragmented rather than fully integrated. In other words, different modelling techniques coexist but are rarely combined into unified frameworks, which limits their practical applicability.
Cluster 7 highlights the growing role of digital technologies including BIM, machine learning, blockchain and smart contracts. This cluster represents the most recent phase in the evolution of the field, driven by the digital transformation of the construction industry (Pishdad-Bozorgi and Yoon 2022; Parsamehr et al. 2023; Shirazi and Toosi 2023; Tao et al. 2023; Zhang and Li 2024). Studies such as Gondia et al. (2020) demonstrate the potential of machine learning models to predict delay risks with high accuracy, while Gurgun et al. (2024) emphasise the increasing adoption of data-driven tools for delay mitigation. These studies contribute to the field by shifting delay analysis from retrospective explanation towards prediction, automation and data-driven decision support. Therefore, Cluster 7 represents not only a technological theme but also a methodological transition in how delay risks are identified and managed. However, the peripheral position of this cluster in the network indicates that these technologies are not yet fully embedded in mainstream research. This suggests a gap between technological innovation and its integration into established project management practices.
Cluster 8 represents a niche but emerging research direction focusing on offsite construction and simulation-based approaches. Although limited in size, this cluster reflects a shift towards alternative construction methods aimed at improving efficiency and reducing delays. Its emergence is consistent with recent discussions on industrialised construction and prefabrication as potential solutions to traditional project inefficiencies (Zhao et al. 2022; Cheng et al. 2024). The contribution of this cluster lies in connecting delay mitigation with alternative production systems, particularly offsite construction, prefabrication and simulation-based planning. Although this cluster remains weakly connected to the core network, it shows how delay research is beginning to consider production-system redesign rather than only managerial control within conventional construction processes. However, its weak connectivity indicates that this research stream is still in an early stage of development.
From a methodological perspective, the cluster structure should be interpreted with caution. Cluster definitions were derived using a combination of keyword co-occurrence and TLS, prioritising the most central and strongly connected terms within each group. While this approach ensures structural coherence, it does not necessarily correspond to clear theoretical boundaries. Overlaps between clusters, particularly between risk-oriented (Cluster 3) and system-based (Cluster 5) approaches, indicate that thematic separation is partly algorithm-driven. Therefore, clusters should be understood as analytical abstractions rather than discrete knowledge domains.
Overall, the thematic structure reveals a field in transition. While traditional research continues to focus on identifying delay causes and performance outcomes (Vaux and Kirk 2018; Zagia et al. 2025), novel studies increasingly emphasise predictive, data-driven and technology-enabled approaches. However, the coexistence of these clusters without strong integration suggests that the field has not yet reached a fully mature and unified theoretical framework.
From a practical perspective, the findings suggest that delay mitigation should not rely on a single approach. Project managers can use the performance-oriented clusters to identify recurring delay outcomes, such as cost overruns, disputes, productivity losses and time overruns. Construction planning teams can use the planning and control clusters to improve scheduling accuracy through forecasting, optimisation, resource allocation and system-based project control. Risk managers can benefit from the methodological clusters by converting delay causes into measurable risk variables and using fuzzy, probabilistic or simulation-based models for early warning and prioritisation. In addition, digital tools, such as BIM, machine learning, blockchain and smart contracts can support more proactive delay monitoring, but their peripheral position in the network indicates that they should be integrated with existing project control practices rather than treated as isolated technical solutions. Therefore, the main practical implication is that effective delay management requires hybrid frameworks that combine delay-cause diagnosis, risk-based modelling, system-level control and digital decision support.
6. Conclusion
This study provides a comprehensive bibliometric analysis of construction delay research by integrating collaboration networks and thematic cluster structures. The findings show that the field has experienced a clear expansion over time with a notable acceleration after 2018. This shift reflects increasing academic and practical interest in delay-related problems. At the collaboration level, the results reveal a fragmented structure across authors, countries and institutions. Similarly, co-authorship networks are composed of loosely connected groups with limited bridging actors, indicating that knowledge production is decentralised and unevenly distributed. At the thematic level, the analysis identifies a structured but not fully integrated research landscape. The literature is organised around three main domains: ‘performance and delay causes’, ‘planning and control processes’, and ‘methodological/technological approaches’. While traditional research continues to focus on identifying delay causes and their impact on cost and productivity, more recent studies emphasise predictive models, risk-based approaches and digital technologies. However, these emerging streams remain partially disconnected from each other, suggesting that the field has not yet reached a unified theoretical or methodological framework. Overall, the findings indicate that construction delay research is transitioning from descriptive and problem-oriented studies towards more analytical, predictive and technology-driven approaches. However, the persistence of fragmented collaboration patterns and loosely connected thematic clusters suggests that the field is still evolving and has not yet achieved full integration. Future progress depends on bridging these structural gaps, both in terms of collaboration and conceptual development, to enable more comprehensive and applicable delay mitigation strategies.
7. Recommendations for future research
Building on the identified thematic structure and its limitations, several directions for future research emerge. First, stronger integration across thematic clusters is needed. In particular, combining risk-based models (Cluster 3), system-level planning approaches (Cluster 5) and digital technologies (Cluster 7) would allow the development of more comprehensive delay mitigation frameworks. The current separation of these domains indicates that methodological advancements remain fragmented rather than cumulative. Second, future research should prioritise cross-regional and comparative studies. The fragmented collaboration patterns observed at the country and institutional levels suggest that knowledge production remains geographically bounded. Comparative studies across different regulatory and economic contexts would help assess the transferability of delay mitigation strategies and reduce duplication of research efforts. Third, although technological approaches (e.g. BIM, AI and simulation models) are increasingly prominent, their relatively peripheral position in the network indicates limited integration into mainstream practice. Future research should therefore move beyond methodological development and focus on implementation-oriented studies, including real-world applications and performance validation of these tools. Finally, the bibliometric structure reveals a relative underrepresentation of human and organisational dimensions, such as decision-making processes, stakeholder coordination and communication dynamics. Expanding research in these areas would complement the predominantly technical focus of the literature and contribute to more holistic delay management strategies.
8. Limitations
This study has several limitations that should be considered when interpreting the findings. First, the analysis was based on datasets obtained from the WoS and Scopus. Although these datasets are widely used, they do not fully capture all relevant publications. In particular, industry reports, regional journals and non-English studies may be underrepresented. Therefore, they may potentially bias the results towards mainstream academic discourse. Second, the two databases were analysed separately and served different purposes within the study. While the WoS was used for network-based bibliometric analysis, the Scopus provided descriptive validation and broader coverage. This methodological choice enhances robustness but also introduces differences in data structure and coverage that may affect comparability. Third, the identification and labelling of thematic clusters rely on keyword co-occurrence and TLS. Although this approach ensures structural consistency, it is inherently algorithm-driven and does not necessarily reflect clear theoretical boundaries. Overlaps between clusters and sensitivity to parameter selection indicate that cluster structures should be interpreted as analytical representations rather than definitive categorisations. Fourth, bibliometric indicators, such as publication counts, citation numbers and network centrality reflect visibility and influence but do not directly measure research quality. Highly cited works or dominant clusters may not always correspond to the most methodologically rigorous or practically applicable contributions. Finally, bibliometric analysis is primarily descriptive and relational in nature. While it reveals patterns and connections, it does not explain causal mechanisms underlying construction delays. Therefore, the findings should be complemented with in-depth qualitative or empirical studies to provide more comprehensive insights.