
The construction industry is viewed as a difficult yet vital one on a global scale because of the services sector’s nature and uncertainties in technology, design, engineering, operations, maintenance, location and other environmental variables. The building of process plants is particularly complex (Chen et al. 2022; Dhamak et al., 2025). The construction firm bears primary responsibility for project implementation and the supply of necessary materials, labour and financial resources. According to Wang et al. (2022), within 3 years, the global construction market will reach the record level of 15 trillion dollars and will continue to grow at a yearly rate of around 3% through to 2025. Given how quickly digital technology digital technology capability (DCAP) is developing, forward-thinking leadership is a potential attribute to create a purposeful and distinct vision for the decision-making processes of digital strategies to execute it (Avolio et al. 2009; Stana et al. 2020). Generally, it is a social transformation process where advanced information technology acts as a mediator to influence the behaviour, attitudes, emotions, thoughts, and behaviours of the organisation (Avolio et al. 2009; Hensellek 2020) as in a construction organisation. The broad term of ‘digital leadership’ has been used in the 21st century, as this term may also highlight contrasts between traditional leadership and leadership in the digital era since they primarily result in a changing workplace where technology interaction is crucial (Phelps 2014; Shahadat et al. 2023). Furthermore, the move to digitalisation from a legacy perspective and the increased corporate integration of information and communication technology (ICT) systems and organisational innovation in the new era emphasise the need for digital proficiency (Alaboud and Alshahrani 2023). The term ‘digitalisation’ refers to improving and modifying organisational processes by utilising ICT to link people, devices and data (Aghimien et al. 2018; Musarat et al. 2024), which is a crucial capability for leaders as a vital role in decision-making processes. Therefore, the term seems to emphasise a fundamental change in how firms approach their work and respond to digital trends in a cut-throat market (Sasmoko et al. 2019).
Although the construction industry affects the economy, society, finances and politics, it plays a crucial role in economic growth. Due to contemporary and commercial developments, the growth and contracting industry’s future atmosphere needs to shift from one of late venture positioning fundamentally. Thus, for development associations to compete in continuously changing commercial centres, a shift in emphasis from venture accomplishment to corporation achievement has to be examined. Due to variations in political economies, legal systems and cultures, these characteristics change between nations. In Malaysia, a government supported and provide a training called Construction Industry Competency Standard (CICS) purposeful train and certify competent managers through Certification of Construction Managers, Certified Construction Managers (CCM) by Construction Industry Development Board (CIDB) attempt to encourage collaboration between quality management and the business environment in an effort to meet client demands and produce a physically functional construction project, finished within the allotted time frame, and adheres to predetermined criteria for quality, cost and other factors (CIDB 2020; Farhan Roslan et al. 2021). However, notwithstanding such an attempt, the programme did not receive an encouraging response due to a lack of strong awareness among construction stakeholders. Aghimien et al. (2018) discovered that fear of increased investment costs, the absence of a local green certification, a lack of government backing or legislation, and a lack of financial incentives are some of the main challenges facing DLCAP in Malaysia. There are a number of other barriers to DLCAP in Malaysia, such as laws or legal restrictions, building codes, public awareness campaigns, the creation of regulatory systems and client demand (Ann Prince 2018; Abbu et al. 2020; Shahadat et al. 2023).
Very few studies have highlighted the organisational innovation to become digital leaders in the construction industry, causing a paucity of information on the subject (Breznik and Hisrich 2014; Čirjevskis 2019; Mihardjo et al. 2019; Abbu et al. 2020) as a result, very little information to help stakeholders and researchers understand issues related to digital resilience. This study examined crucial leadership capability (LCAP) in organisations in mediating the direct effect of digital mindset and moderating the effect of DCAP in Malaysia’s construction industry, considering the paucity of previous research and the significance of digital leadership. This is significant because, although the rest of the globe is creating cutting-edge DCAP solutions, Malaysia, in particular, is still having difficulty putting established technological principles into practice.
The form of research that was identified about the impact of leadership and organisation on digital leadership capabilities and abilities of digital mindset and digital technology practices in the construction industry is shown in Figure 1. There is empirical data to support this, as well as suggestions for solutions. To determine the underlying structure of the items, this study first identified and evaluated items from the literature that were said to be both leadership and organisation to the digital leadership capability (DLCAP). The most significant items within each category were then determined by confirmatory composite analysis within each construct.
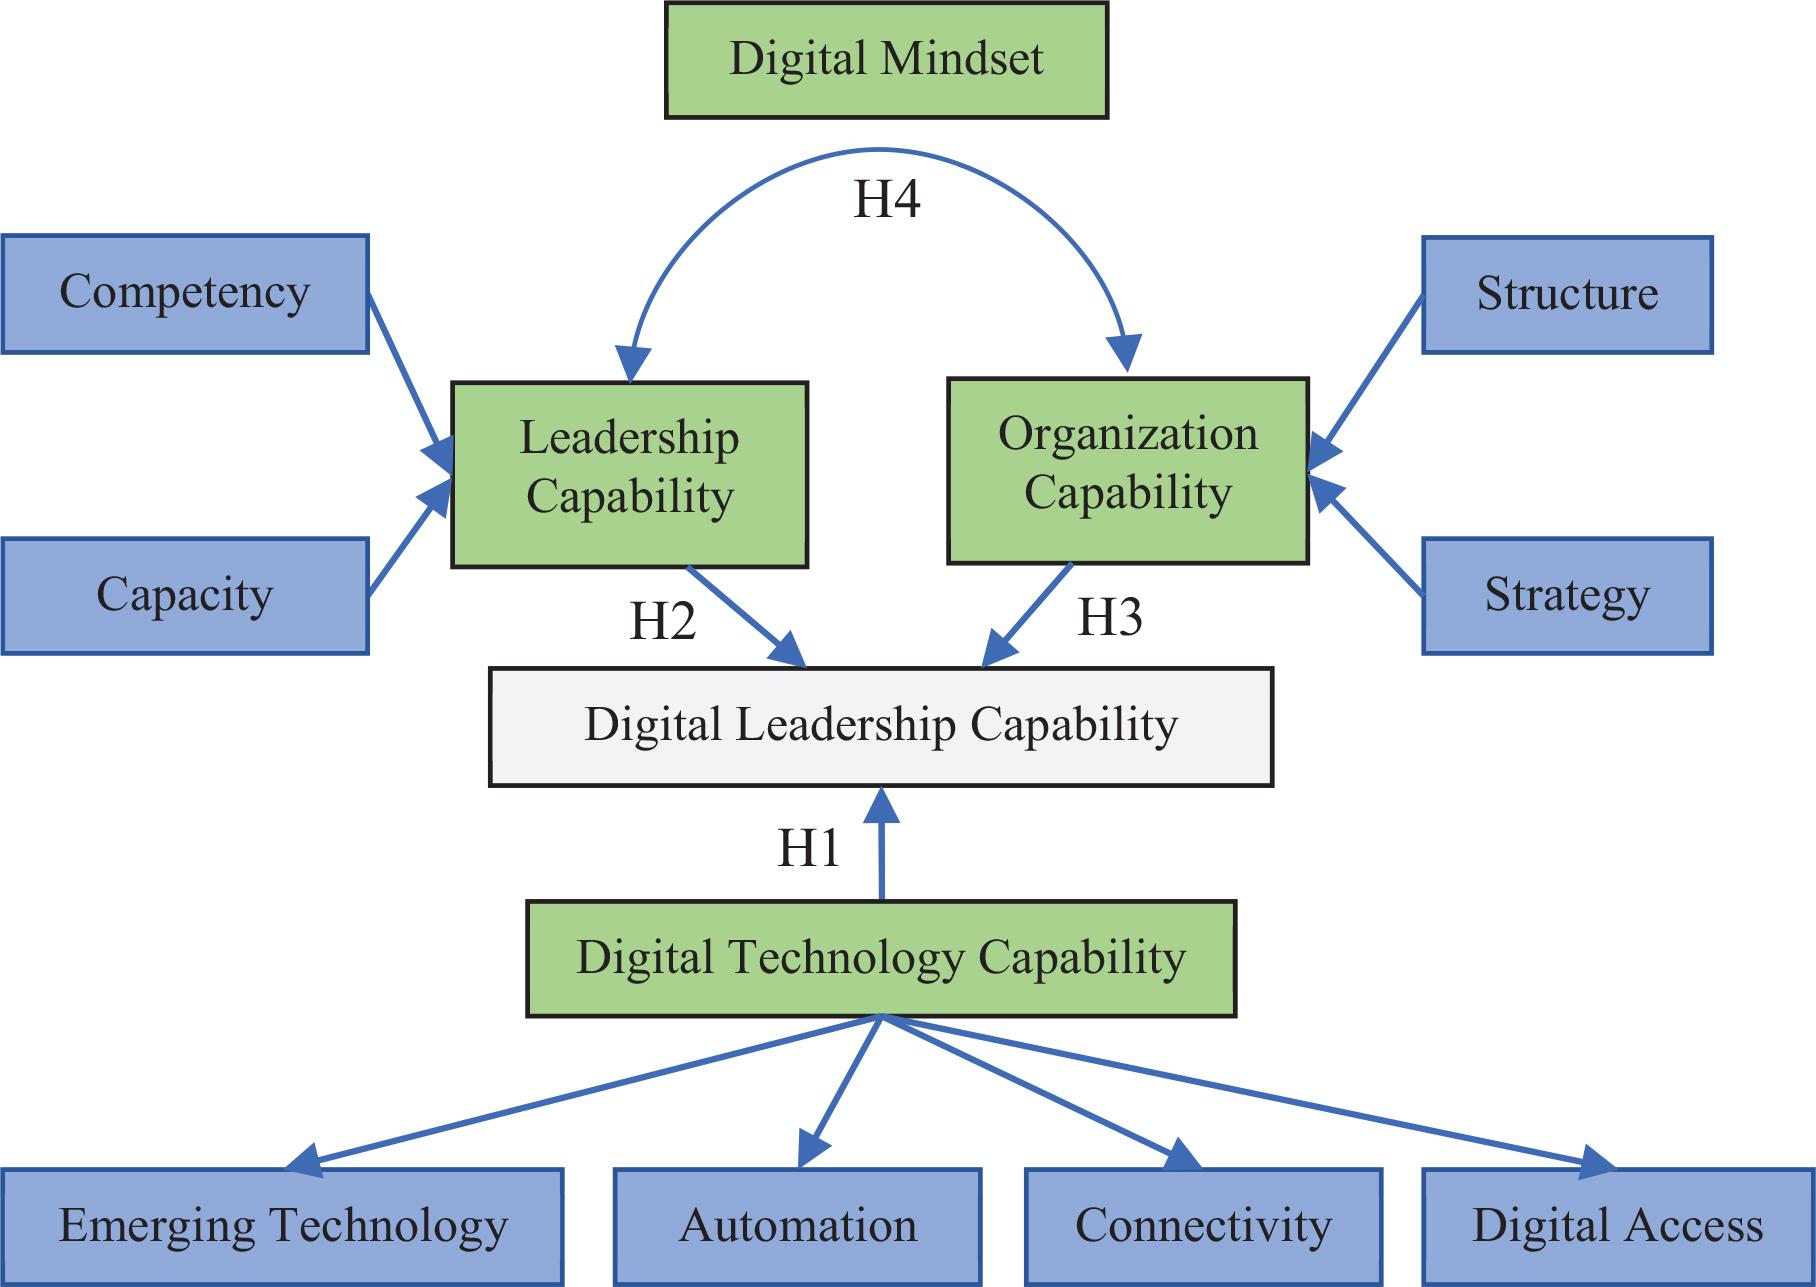
Research model.
Source: Author’s own work.
Construction digital technology practice (DCAP) has an impact on how work is designed, particularly how leaders and subordinates collaborate (Schwarzmüller et al. 2018; Cortellazzo et al. 2019). For instance, creating new opportunities like virtual teams and smart working, digitalisation also brings about new communication tools, speeds up information access, shifts power dynamics and improves efficiency and uniformity. Leaders may need to have a range of abilities to guide subordinates and assist them in benefiting from such digital developments that align with the CIDB initiative of Roadmap IR 4.0. The introduction of disruptive technology has shown significance to the construction firm management (CIDB 2020), which brings towards the digitalisation in business innovation.
According to Johari et al. (2025) DCAP practices are grouped under four key elements: emerging technology (ET), automation (AU), connectivity (CO) and digital access (DA), which related in construction-lifecycle phase. Resulting from resource-based view related to design phase (procurement, tendering), feasibility phase (logistic), construction phase (production, operation), decommissioning phase (marketing, documentation) and maintenance phase (marketing) involved, DCAP can make the construction firm business development more secure and efficient, resulting in an increase in productivity in the project even less interaction to be able to achieve the main goal in a project as collaboration through digital platforms (Weber et al. 2022).
Leaders’ competency is defined as the non-technical skillset that includes social intelligence, conflict management, interpersonal skills, agility, decision-making, being a good coach, emotional intelligence, industry expertise, change management, setting and sharing a compelling vision, courage, managing managerial, inclusiveness, organisational citizenship behaviour (Abbu et al. 2020). Digital skills involve the knowledge, but also the ability to understand information needs from DT sources and also to use digital tools and facilities to input, organise and integrate digital resources (Siddiqui et al. 2022).
Leader capacity is defined as the technical skillset, actions and thinking processes that set people apart as being a digital leader (Ismail and Hassan 2019). Which means the degree of a leader’s ability to use and understand information to decide and communicate any decision made. A leader who lacks the capacity of their mind is impaired or disturbed in some way, which means they’re unable to decide at that time. It is also the moderation of a digital mindset that includes digital natives to become digital leaders in construction organisations. The most successful digital leaders will not only have a very clear vision for the future, but also a strategy in place that helps them to nurture a digital culture internally, one that’s ready to embrace change. Thus, a coherent strategy outlining the digital agenda by managerial initiative is crucial (Schallmo and Tidd 2021).
An organisational structure is a system that outlines how certain activities are directed to achieve the firm’s vision (Alshehhi et al. 2023). These activities can include rules, roles and responsibilities. The organisational structure also determines how information flows between levels within the construction firm. As an initiative of workshops and training, the leaders’ capabilities of both leaders and employees are improved, and problems arising during the projects are assessed, with solutions proffered. These insights help organisations to make strategic management decisions that increase productivity, improve revenues and enhance growth.
Also, organisational strategy refers to an organisation’s well-defined plan and approach to achieving its overarching goals and objectives. It encompasses various aspects, such as the organisation’s mission, vision, core values and the strategic initiatives it undertakes to stay ahead in the market. In the construction industry, exploitation and application of DT in IR 4.0 are crucial, such as e-contract through big data, simulation, ICT system, cloud-based computing, virtual reality (VR), cybersecurity, collaborative robots and M2M communication include technology generating data through Internet of Thing (IoT) (Abbu et al. 2020; Srivastava et al. 2021).
Digital mindset is defined as a leadership behaviour that enables subordinates to see ICT through the construction DT that opens up a new organisational landscape increasingly dominated by data-intensive and intelligent technologies, classified into digital native and digital immigrants of leader styles. According to Jarrahi and Eshraghi (2019), the boundaries between different age groups are vague, and therefore, it is difficult to draw fine distinctions between the technological framework of knowledge leaders belonging to different age groups that facilitate the implementation of a digital construction-phase information management system (Gebretekle et al. 2021; Jahanger et al. 2022). There is a gap where implementing the use of DT in construction firms will face problems when the leaders, who have digital native or digital immigrant behaviour, are open to new digital technologies opportunities (Shirokova et al. 2020).
To determine the digital leadership variables contributing to the digital resilience of the construction industry, this study began with a comprehensive literature review. The research follows a deductive quantitative procedure (Woiceshyn and Daellenbach 2018; Szabó et al. 2023). Criteria identified in the literature served as the foundation for developing a self-completing questionnaire, with the resulting data analyzed to test the research assumptions. This systematic approach ensures the study remains objective, measurable, and logically grounded (Franke and Sarstedt 2019).
The variables of an instrument are digital technology practice, LCAP, organisational capability and digital mindset use questionnaire with a five-point Likert scale, which was motivated by its capacity to yield results that are clear and simple to understand (Jebb et al. 2021). Using a five-point Likert scale, respondents were asked to rank how much they agreed with each of the DLCAP (1 = strongly disagree, 2 = disagree, 3 = neutral, 4 = agree and 5 = strongly agree). Instruments are presented in Table 2.
Professional managers in the Malaysian construction industry, such as project and construction managers, quantity surveyors, architects and engineers (mechanical, electrical and civil), were given the questionnaire. From the websites of the CIDB, Board of Quantity Surveyors (BQSM), Board of Architects (BOA) and Board of Engineers Malaysia (BEM), we were able to identify the respondents based on their membership in their respective professional and statutory registration bodies. Research on the use of digital technologies in the construction industry has made extensive use of this methodology (Jahanger et al. 2022; Alaboud and Alshahrani 2023; Shahadat et al. 2023). Table 1 provides the demographic details of 341 respondents, where 39.88% of the workforce was employed by contractor firms, 7.04% by government departments or local authorities, and the remaining individuals were categorised as other (freelancers and academicians). The majority of the respondents (55.42%) from the middle management position, which includes construction and project managers, executive managers, project engineers, while 25.22% from upper management in the position of proprietor (Founder), construction and project directors. Most respondents had at least 3 years of experience in the construction industry (39.58%), while 9.38% had >15 years’ experience in the construction industry.
Respondents’ demographics.
| Organisation type | Frequency | Percentage (%) |
|---|---|---|
| Developer | 56 | 16.42 |
| Consultant | 72 | 21.11 |
| Contractor (SMEs/Big Firm) | 136 | 39.88 |
| Local authority | 24 | 7.04 |
| Suppliers | 14 | 4.11 |
| Others | 39 | 11.43 |
| Management position | Frequency | Percentage (%) |
| Top Management | 86 | 25.22 |
| Supervisory Management | 189 | 55.42 |
| Frontline Management | 66 | 19.35 |
| Years of experience | Frequency | Percentage (%) |
| <3 years | 135 | 39.58 |
| 3–5 years | 80 | 23.46 |
| 6–10 years | 64 | 18.76 |
| 11–15 years | 30 | 8.79 |
| >15 years | 32 | 9.38 |
Source: Author’s own work.
Two phases of data analysis were carried out through partial least squares structural equation modeling (PLS-SEM). Initially, the reflective measurement model assessment is evaluated by assessing (1) internal consistency reliability, (2) convergent validity and (3) discriminant validity. Then, structural model assessment includes (1) path coefficient, (2) coefficient of determination, (3) effect size, (4) mediation relationship analysis and (5) moderation relationship analysis.
Moreover, robustness analyses are run to support the validity of statistical conclusions. According to Sarstedt et al. (2020), recently reviewed methods to perform three of these robustness checks that can aid requirements nowadays. In this study, four assessment is suggested in this study: (1) univariate normality, (2) multivariate normality, (3) endogeneity assessment and (4) non-linearity to verify the structural model assessment robustness.
The lower order construct (LoC) are validated as part of the measurement model assessment, as shown in Table 2. Each construct was assessed for internal consistency reliability, composite reliability (CR) to have satisfactory indicator reliability when each item’s loading estimate is >0.7 is significant in the exogenous variables (Hair et al. 2020). Also, convergent validity, average variance extracted (AVE) must >0.5 or higher, interpreted that >50% of the variance in the set of indicators is explained by the underlying construct for the reflective measurement model in LoC (Hair et al. 2024; Memon et al. 2024).
Reflective measurement model: Factor loadings, CR, and AVE.
| Construct | Construct | Loadings | CR | AVE | |
|---|---|---|---|---|---|
| LCAP | Digital expertise (DE) | COM1 | 0.820 | 0.924 | 0.634 |
| COM2 | 0.830 | ||||
| COM3 | 0.822 | ||||
| COM4 | 0.815 | ||||
| CAP10 | 0.790 | ||||
| CAP11 | 0.788 | ||||
| CAP12 | 0.713 | ||||
| Skill acquisition (SA) | COM5 | 0.775 | 0.932 | 0.577 | |
| COM6 | 0.786 | ||||
| COM7 | Delete | ||||
| COM8 | 0.706 | ||||
| COM9 | 0.751 | ||||
| COM10 | 0.716 | ||||
| COM11 | Delete | ||||
| COM12 | 0.787 | ||||
| COM13 | 0.757 | ||||
| COM14 | 0.802 | ||||
| COM15 | 0.774 | ||||
| COM16 | 0.736 | ||||
| Trust and commitment (TC) | CAP1 | 0.819 | 0.908 | 0.665 | |
| CAP2 | 0.854 | ||||
| CAP3 | 0.789 | ||||
| CAP4 | 0.832 | ||||
| CAP5 | 0.782 | ||||
| CAP6 | Delete | ||||
| Data driven (DD) | CAP7 | 0.870 | 0.930 | 0.690 | |
| CAP8 | 0.853 | ||||
| CAP9 | 0.846 | ||||
| CAP13 | 0.827 | ||||
| CAP14 | 0.812 | ||||
| CAP15 | 0.772 | ||||
| CAP16 | Delete | ||||
| OCAP | Flexible organization (FO) | SRU1 | Delete | 0.918 | 0.585 |
| SRU2 | 0.760 | ||||
| SRU3 | 0.757 | ||||
| SRU4 | 0.697 | ||||
| SRU6 | 0.788 | ||||
| SRU9 | 0.775 | ||||
| SRU10 | 0.773 | ||||
| SRU13 | 0.786 | ||||
| SRU14 | Delete | ||||
| STA7 | 0.777 | ||||
| STA8 | Delete | ||||
| Agile and collaboration (AC) | STA1 | 0.705 | 0.923 | 0.573 | |
| STA2 | 0.803 | ||||
| STA3 | 0.766 | ||||
| STA4 | 0.713 | ||||
| STA5 | 0.773 | ||||
| STA6 | 0.719 | ||||
| STA9 | 0.748 | ||||
| STA10 | 0.785 | ||||
| STA11 | 0.795 | ||||
| Exploitation (EX) | STA12 | 0.788 | 0.909 | 0.625 | |
| STA13 | 0.818 | ||||
| STA14 | 0.803 | ||||
| STA15 | 0.796 | ||||
| STA16 | 0.764 | ||||
| SRU8 | 0.776 | ||||
| Policy and finance (PF) | SRU5 | 0.811 | 0.923 | 0.668 | |
| SRU7 | 0.838 | ||||
| SRU11 | 0.801 | ||||
| SRU12 | 0.822 | ||||
| SRU15 | 0.815 | ||||
| SRU16 | 0.815 | ||||
| DCAP | Emerging technology (ET) | TE1 | 0.983 | 0.881 | 0.596 |
| TE2 | 0.977 | ||||
| TE3 | 0.932 | ||||
| TE4 | 0.863 | ||||
| TE5 | 0.847 | ||||
| Automation (AU) | TA1 | 0.843 | 0.917 | 0.688 | |
| TA2 | 0.867 | ||||
| TA3 | 0.884 | ||||
| TA4 | 0.873 | ||||
| TA5 | 0.813 | ||||
| Connectivity (CO) | TC1 | 0.746 | 0.921 | 0.625 | |
| TC2 | 0.974 | ||||
| TC3 | 0.943 | ||||
| TC4 | 0.875 | ||||
| TC5 | 0.991 | ||||
| TC6 | 0.981 | ||||
| TC7 | 0.812 | ||||
| Digital access (DA) | TD1 | 0.831 | 0.912 | 0.568 | |
| TD2 | 0.980 | ||||
| TD3 | 0.858 | ||||
| TD4 | 0.933 | ||||
| TD5 | 0.861 | ||||
| TD6 | Delete | ||||
| TD7 | 0.841 | ||||
| TD8 | Delete |
Source: Author’s own work.
DCAP, digital technology capability; LCAP, leadership capability; OCAP, organisation capability.
The findings showed CR statistics ranged from 0.908 to 0.923, whereas factor loading ranged from 0.573 to 0.690. Both indicators have the required threshold for latent variables (Hair et al. 2020). Hence, the construct reliability and convergent validity are established.
The higher order construct (HoC) was tested for discriminant validity with the second LoC in the study as recommended by Franke and Sarstedt (2019). Further to the assessment of reliability and validity, the discriminant validity of emergent variables with HoC is also assessed. Table 3 depicts the assessment of discriminant validity using the Heterotrait-Monotrait (HTMT) criteria developed by Henseler et al. (2015) for DLCAP. It is observed that the HTMT value for LoC is all below the threshold value of 0.90, and that the bootstrap 95% confidence interval reveals that the upper level confidence interval is <1, indicating that discriminant validity has been established. According to Benitez et al. (2020), the final model fit was obtained after the elimination of three variables with a redundant loading factor; COM7, STA8 and TD6 that accumulated for the poor fit to the model in LoC. Therefore, redundant variables through cross-loading were deleted and presented in COM11, STA2 and TC4, respectively, as the same meaningful indicator in this study.
Discriminant validity: HTMT criterion (2015).
| AC | AU | CO | DA | DD | DE | DLCAP | DIND | ET | EX | FO | PF | SA | TC | DCAP × LCAP | DCAP × OCAP | |
|---|---|---|---|---|---|---|---|---|---|---|---|---|---|---|---|---|
| AC | ||||||||||||||||
| AU | 0.07 | |||||||||||||||
| CO | 0.06 | 0.72 | ||||||||||||||
| DA | 0.06 | 0.87 | 0.89 | |||||||||||||
| DD | 0.64 | 0.18 | 0.12 | 0.11 | ||||||||||||
| DE | 0.72 | 0.10 | 0.05 | 0.06 | 0.72 | |||||||||||
| DLCAP | 0.08 | 0.09 | 0.07 | 0.08 | 0.14 | 0.05 | ||||||||||
| DIND | 0.53 | 0.06 | 0.03 | 0.04 | 0.47 | 0.86 | 0.10 | |||||||||
| ET | 0.06 | 0.77 | 0.85 | 0.84 | 0.05 | 0.09 | 0.06 | 0.06 | ||||||||
| EX | 0.66 | 0.17 | 0.11 | 0.11 | 0.78 | 0.65 | 0.11 | 0.47 | 0.08 | |||||||
| FO | 0.61 | 0.13 | 0.07 | 0.08 | 0.84 | 0.84 | 0.08 | 0.61 | 0.07 | 0.81 | ||||||
| PF | 0.72 | 0.11 | 0.07 | 0.07 | 0.59 | 0.56 | 0.09 | 0.39 | 0.05 | 0.52 | 0.57 | |||||
| SA | 0.84 | 0.13 | 0.08 | 0.11 | 0.53 | 0.68 | 0.07 | 0.51 | 0.08 | 0.71 | 0.66 | 0.86 | ||||
| TC | 0.73 | 0.18 | 0.08 | 0.10 | 0.69 | 0.58 | 0.09 | 0.45 | 0.05 | 0.81 | 0.74 | 0.55 | 0.64 | |||
| DCAP × LCAP | 0.05 | 0.08 | 0.04 | 0.05 | 0.09 | 0.05 | 0.03 | 0.03 | 0.06 | 0.05 | 0.07 | 0.03 | 0.04 | 0.05 | ||
| DCAP × OCAP | 0.06 | 0.05 | 0.07 | 0.06 | 0.11 | 0.04 | 0.03 | 0.02 | 0.06 | 0.03 | 0.04 | 0.04 | 0.04 | 0.03 | 0.80 |
*Excluded from analysis (cross-loading <0.9).
Note: The full description for the construct is shown in Table 2.
Source: Author’s own work.
AC, Agile and collaboration; AU, Automation; CO, Connectivity; DA, digital access; DD, data driven; DE, digital expertise; DLCAP, digital leadership capability; ET, emerging technology; EX, exploitation; FO, flexible organisation; HTMT, Heterotrait-Monotrait; LCAP, leadership capability; PF, policy and finance.
All endogenous variables are established as shown in the three HoC, namely, LCAP, Organisation Capability (OCAP), and digital technology capability (DCAP). Figure 2 shows the results of the analysis, which reveal a R2 value of 0.265 for DLCAP. This shows that 95% variance in DLCAP can be attributed to LCAP, OCAP and DCAP. Based on the recommended 0.10 cutoff value (Ozili 2022), results indicated that this model obtained acceptable R2 statistics for the endogenous construct, which is substantial. In this study, the influence on DLCAP is assessed through several predictor variables. According to Hair et al. (2020), it is recommended that the f 2 effect size shall also be presented. f 2 effect size statistic specifies if the removal of an independent variable from the model can have a substantial impact on the dependent variable (Hair et al. 2020). The analysis results of the f 2 statistic show that in the context of the present day, the removal of LCCAP will significantly influence on DLCAP.
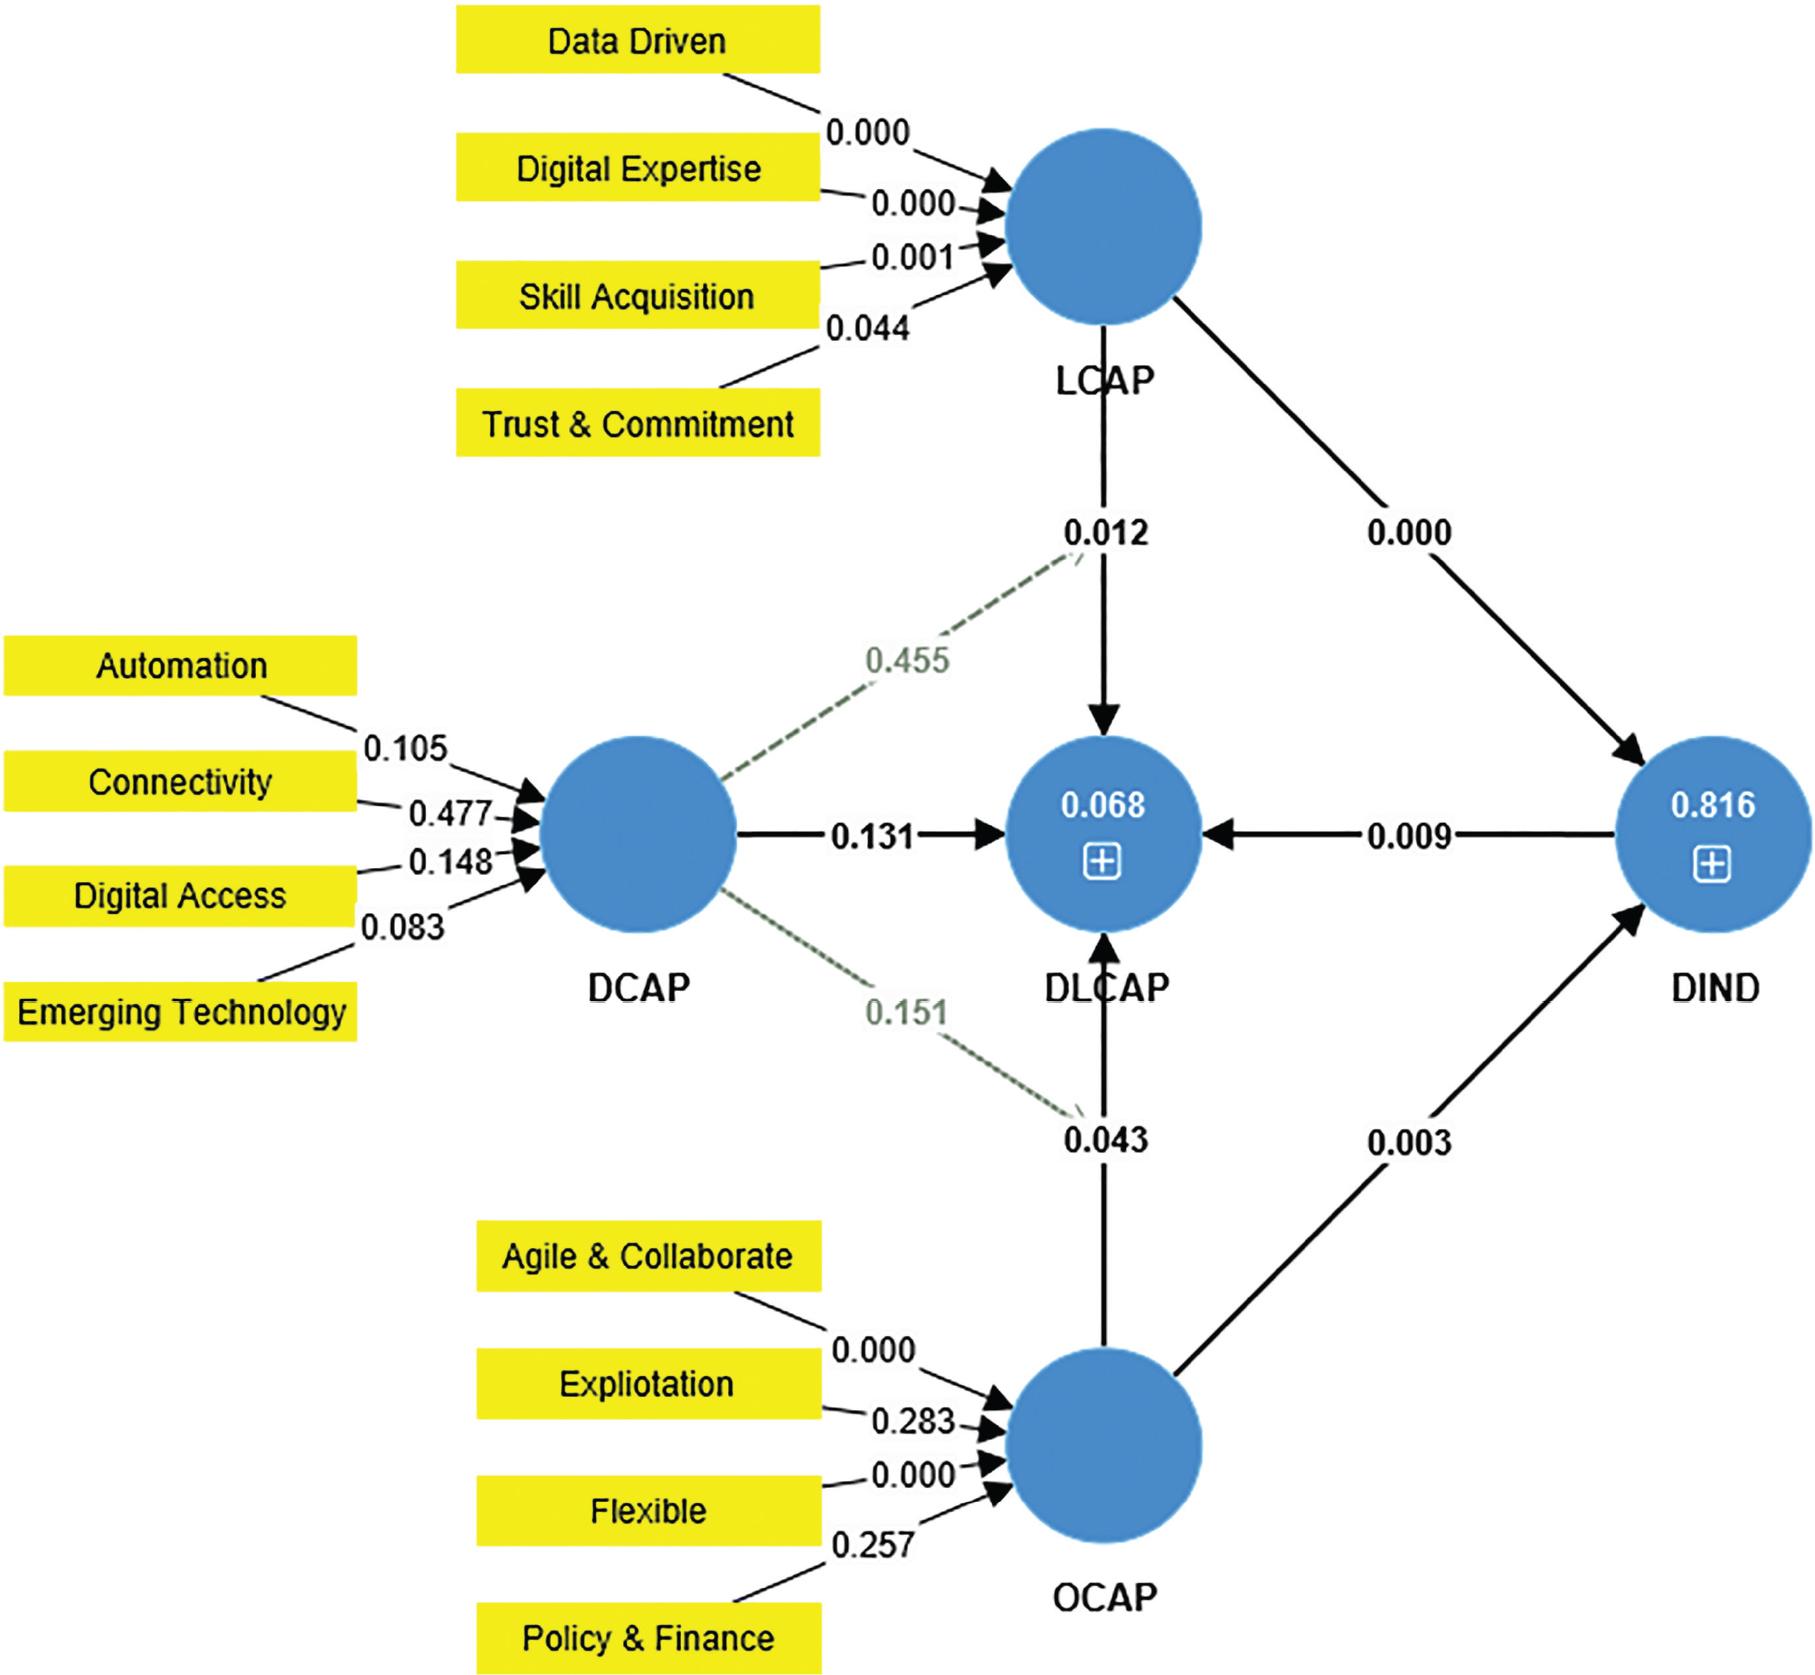
Structural model.
Source: Author's own work. DLCAP, digital leadership capabilities; LCAP, leadership capability.
The results of structural model assessment indicate that three out of the four proposed hypotheses are supported. Hypotheses that are not supported include the relationship between DIND towards OCAP and DCAP towards DLCAP. Hypotheses that demonstrate a significant relationship exert moderate to large effect sizes. The effect size, f 2 ranges from 0.314 to 2.345, indicates the large effect size (Cohen 1988). Digital leadership (β = 0.317, t = 52.270, p < 0.05) is said to have exerted the largest effect size on DLCAP as compared to other predictors. The R2 value for LCAP (0.692) 69.2%, OCAP (0.546) 54.6%, DCAP (0.816) 81.6%, DIND (0.694) 69.4% and DLCAP (0.265) 26.5% are presented as substantial criteria where > 0.26 (Cohen 1988). All exogenous variables demonstrate sufficient explanatory power on their respective endogenous variables with R2 ranging from 0.265 to 0.816 indicates that the model has sufficient explanatory power. Hence, Table 4 shows the major hypotheses through the literature review.
Results of hypothesis testing in the direct effect and indirect effect.
| Effect | Beta | SE | T value | P value | LLCI | ULCI | f2 | Results |
|---|---|---|---|---|---|---|---|---|
| DCAP -> DLCAP | –0.161 | –0.127 | 1.120 | 0.131 | –0.248 | 0.235 | 1.021 | Not supported |
| LCAP -> DLCAP | 0.317 | 0.307 | 52.270 | 0.012 | 0.090 | 0.542 | 3.017 | Supported |
| OCAP -> DLCAP | 0.129 | 0.131 | 1.715 | 0.043 | –0.254 | –0.007 | 1.003 | Supported |
| DIND -> DLCAP | –0.291 | –0.281 | 2.383 | 0.009 | –0.495 | –0.098 | 0.263 | Supported |
| LCAP -> DIND -> DLCAP | 0.278 | 0.116 | 2.387 | 0.017 | 0.058 | 0.511 | 0.278 | Complimentary mediation |
| OCAP -> DIND -> DLCAP | 0.021 | 0.012 | 1.838 | 0.066 | 0.005 | 0.057 | 0.021 | Indirect effect |
Source: Author’s own work.
DLCAP, digital leadership capability; LCAP, leadership capability; LLCI, lower level confidence interval; SE, standard error; ULCI, upper level confidence interval.
Based on the analysis results in the table above can be explained as follows.
H1: Evaluates whether DLCAP has a significant impact on the digital technology capability (DCAP) as moderates. The results revealed that DLCAP has an insignificant effect on DCAP (β = –0.161, t = 1.120, p > 0.05). Hence, H1 was not supported. H2: Evaluates whether DLCAP has a significant impact on the LCAP. The results revealed that DLCAP has a significant effect on LCAP (β = 0.317, t = 52.270, p < 0.05). Hence, H2 was supported. H3: Evaluates whether DLCAP has a significant impact on the organisation’s capability (OCAP). The results revealed that DLCAP has a significant effect on OCAP (β = 0.129, t = 1.715, p < 0.05). Hence, H3 was supported. H4: Digital Mindset (DIND) mediates the relationship between LCAP and Organisation Capability (OCAP), with DLCAP to assess the mediating role of DIND. The results revealed significant (p < 0.05) partial mediating roles of DIND (H4: β = –0.291, t = 2.383, p < 0.05). Hence, DIND partially mediates the relationship between DLCAP through LCAP and OCAP, where H4 was supported.
Vaithilingam et al. (2024) suggested the assessment of robustness checks for statistical rigour for models estimated using PLS-SEM, where four assessments for statistical rigor is suggested in this study to verify the structural model’s robustness. To assess univariate normality, skewness and kurtosis are summary statistics that measure the extent of departures from normality and can be used in both a descriptive and an inferential manner. Values of skewness and kurtosis outside the range of –1 to 1 denote significant deviation from normality. However, considering the robust performance of PLS-SEM when data are non-normal, values between –3 and +3 can generally be considered acceptable (Hair et al. 2024). Table 5 shows the univariate normality for LoC whose value range from –1.593 to 2.686, considered acceptable.
Univariate normality for LoC.
| Excess kurtosis | Skewness | |
|---|---|---|
| DIND | 1.036 | –0.656 |
| DCAP | 4.041 | –0.985 |
| LCAP | 1.939 | –0.711 |
| DLCAP | 0.815 | 0.054 |
| OCAP | 1.992 | –0.699 |
Source: Author’s own work.
DLCAP, digital leadership capability; LCAP, leadership capability; LoC, lower order construct.
To assess multivariate normality, the latent variable scores were run through Webpower websites https://webpower.psychstat.org/models/kurtosis/where Mardia’s multivariate normality test is recommended by Vaithilingam et al. (2024). The p-value shall be <0.05. Figure 3 shows that the p-value is 0, indicating a significant where it is proof that the data is non-normal. Therefore, the PLS-SEM are recommended for this study.
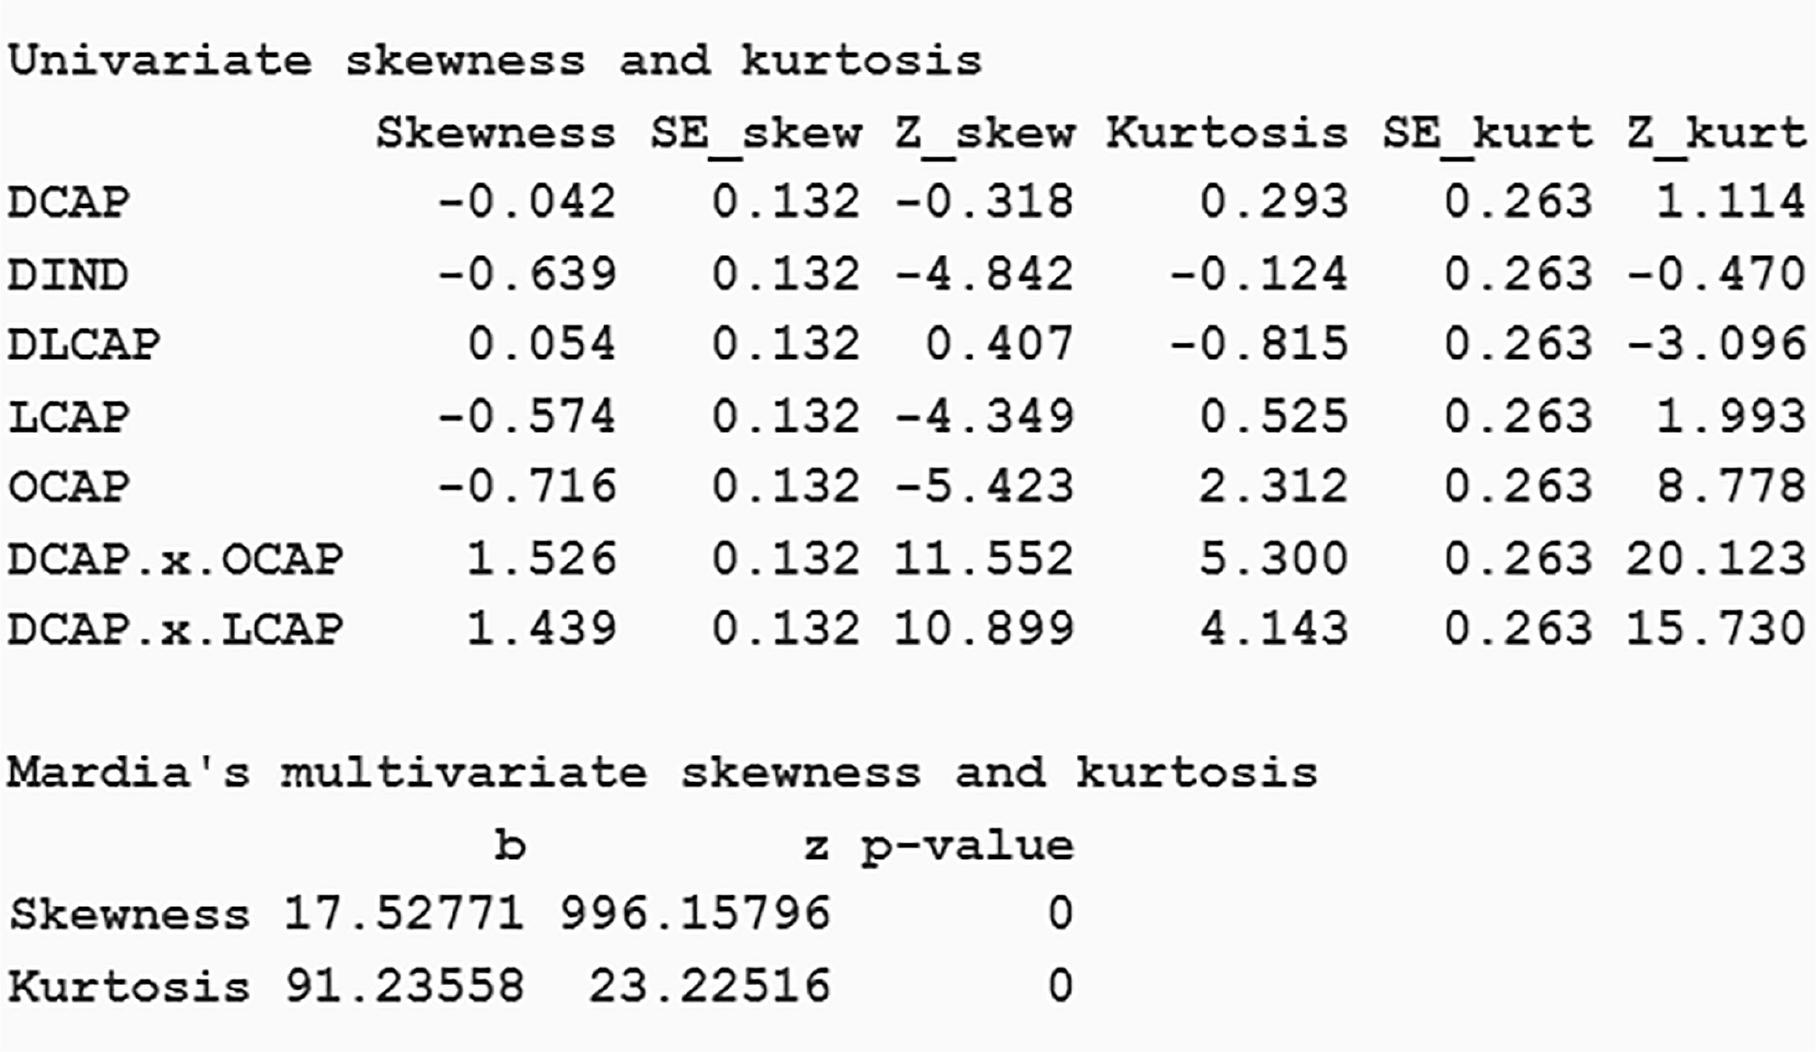
Mardia’s multivariate normality.
Source: Authors own work. DLCAP, digital leadership capability; LCAP, leadership capability.
To assess endogeneity, the Gaussion Capola function provided by SmartPLS 4.0. The result of p-value should >0.05 where indicates insignificant to assess the correlation between explanatory or predictor constructs and the error terms of dependent ones (Hair et al. 2024). The results in Table 6 shows that none of the Gaussian copulas is significant (p-value >0.05). Hence, consequently conclude that endogeneity is not present in this study, which supports the robustness of the structural model results in this regard (Huit et al. 2018).
Gaussion Capola approach for HoC.
| Beta coefficient (β) | SE | T value | P value | |
|---|---|---|---|---|
| GC (LCAP) -> DIND | –0.439 | 0.162 | 2.704 | 0.103 |
| GC (OCAP) -> DIND | 0.092 | 0.093 | 0.980 | 0.164 |
| GC (DIND) -> DLCAP | –0.265 | 0.176 | 1.504 | 0.066 |
| GC (DCAP) -> DLCAP | 0.115 | 0.748 | 0.154 | 0.439 |
Source: Author’s own work.
DLCAP, digital leadership capability; HoC, higher order construct; LCAP, leadership capability; SE, standard error.
To assess non-linearity, the quadratic effects between (1) LCAP and OCAP on DIND, and (2) DIND, DCAP on DLCAP are being tested. The results of bootstrapping with 5,000 samples and using no sign changes indicate that neither of the non-linear effects is significant, where the p-value <0.05. Table 7 shows the difference between LCAP and OCAP on DIND (p-value = 0.123 and 0.091) and DIND, DCAP on DLCAP (p-value = 0.057 and 0.100), higher than expected. Therefore, conclude that the linear effects model is robust.
Quadratic effect test by higher order polynomial fitting.
| Beta coefficient (β) | SE | T value | P value | |
|---|---|---|---|---|
| QE (LCAP) -> DIND | –0.050 | 0.025 | 1.993 | 0.123 |
| QE (OCAP) -> DIND | 0.024 | 0.018 | 1.336 | 0.091 |
| QE (DIND) -> DLCAP | –0.090 | 0.057 | 1.583 | 0.057 |
| QE (DCAP) -> DLCAP | 0.074 | 0.058 | 1.281 | 0.100 |
Source: Author’s own work.
DLCAP, digital leadership capability; LCAP, leadership capability; QE, quadratic effect; SE, standard error.
This study has come out on the framework of DLCAP for constant innovation in the Malaysian construction organisation. From the standardised loading factor of the construct, this study establishes the core components of DLCAP, which are LCAP, organisational capability, DT platform, and digital mindset as mediators because all factors are above 0.6.
The significant role of LCAP in the field of organisational innovation is progressively gaining recognition, likewise towards DLCAP. Leaders could apply their influence on subordinates to accomplish organisational digitalisation goals under the conditions of individual and organisational factors. Hensellek (2020), Muda et al. (2018) highlighted that the matter of subordinates’ adaptiveness towards digitisation is articulated and operationalised by leaders’ competency and capacity for digital orientation. Kaoucu (2020) observed that organisations’ accomplishment of digital performance is reliant upon the extent of organisational culture associated with digital expertise (DE) and skill acquisition of leadership competency. Farhan Roslan et al. (2021) also pointed out that the data-driven decision-making (DDDM) is required by firm leaders to guide strategic business decisions that align with transparency through real-time information with clients, suppliers and business partners. Klein (2020) emphasised the significance of leaders in improving subordinates’ digital orientation behaviour. The above-mentioned LCAP can serve as a significant factor towards DLCAP and in the development of digital resilience among subordinates.
Leadership’s commitment to digital transformation is among the main factors influencing the success of DLCAP, and this commitment can reflect itself through such things as a contribution to the management of digital facilities management committees, job training programs and taking data analytics positions into account in job design. Abbu et al. (2020) highlighted that positive results of digitally mature organisations were much more likely to support levels of subordinate ship reliance in the workplace, well-being, engagement and veritable digital performance. Ng (2020) pointed out that subordinates tend to dedicate themselves to digitised and sustain open communication concerning it when they have trust in their managers and supervisors. Leadership is also characterised by transparency and openness, guidance concerning worthy CIDB objectives and attention to DLCAP development and application.
The significant role of OCAP in the field of organisational innovation is progressively gaining recognition, likewise towards DLCAP. The participant of subordinates and their representative is a vital component of digital transformation since it is the potential to accomplish the key goal of the DLCAP application, an increase in working conditions for the advantage of both the employer and employee towards all respective managers in construction professionals. Subordinates which employees play an important role in ensuring the flexibility of the organisation towards digitalised orientation in managing assessment, and also facilitate employees’ responsibility for agile and mutual engagement with developers, consultants, suppliers and subcontractors in terms of real-time project information resources, as mentioned by Nurain Hassan Ibrahim (2013). The participants of subordinates and their representatives can also have an important effect on the performance of the DLCAP, as mentioned by Alshehhi et al. (2023). The participant of subordinates in exploitation-related actions supports to increases of effective implementation within the organisation and helps in the adaptability of digital technology practices amongst the subordinate in an organisation where the conduct DLCAP activities without consulting subordinates, performance indices like database servers in particular firm cause higher data recovery services to be worse when information lost caused natural disaster or single point failure meanwhile cloud storage more effective with lower cost needed as mention by Bello et al. (2021).
According to Nyqvist et al. (2025), the financial support and capital investment in the development of digital technology practice (DTP) in the organisation are crucial. Therefore, a more coherent approach is required to plan interventions in an organisation with government and third-party involvement. Leaders, as the main component has to decompress the function of planning, managing and handling the digital technology team (DTT) team and activities. The structured digital asset management digital asset management (DAM) and digital-based joint ventures shall be set as a requirement by the developer to the main contractor, third parties, such as building information modeling (BIM) application, in success and efficient construction lifecycle phase. Vijayeta (2021) highlighted that the application of BIM depends on effective planning, through which collaboration, assessment and control can be attained.
A policy statement on Digital Economy Blueprint (MyDIGITAL) and National Policy IR 4.0 (Indsutry4WRD) is a support point for the entire digital transformation, special emphasis should be paid to its contents and implementation throughout the organisation. Policy statement on IR 4.0 offers the direction of the construction organisation, ventures into convergence technology, attracts construction stakeholders, shapes future preparation and makes leader-subordinate comfortable in the transformation. According to Maruthuvellu et al. (2021), the majority of Malaysian construction leader is confident to embrace change, to develop new competencies needed to guide their organisations into the uncertain future of the digital age. The statutory regulations CIDB Act 520, Part VII, Section 33 (1) offer leadership for the managerial levels and organisation to CICS. This study is enhanced towards digital reality by adding DT expertise features work scope in the training to become standardised. The policy should be significant to the scope of the construction lifecycle digital task and accurately documented, communicated and available to all leaders and subordinates to meet any current situation of the digital era. Shahadat et al. (2023) highlighted that having a better policy serves as support for a strong digital transformation.
Overall, by putting out both leadership and organisation capability of construction IR 4.0, this study advances research on the DLCAP of construction managers in their organisation to establish digital resilience, while digital mindset and digital technology practice are essential components in the construction industry. Study utilising PLS-SEM to develop DLCAP in the Malaysian construction industry that impacts digitalisation in the build environment and how the leadership behaviour through digital mindset affects stakeholders’ intentions to adopt digital technology capability (DCAP). Furthermore, DCAP show directly insignificant effects on DLCAP where automation digital technology is still infancy and not fully utilised as in developed countries, such as Europe. Therefore, the exogenous variables and endogenous variables contained in the study are based on structural equation modelling – PLS in the context of construction form perspectives. It is hoped that accurate implementation of the framework will make digital leadership styles a thing of constant innovation in the Malaysian construction industry.
Nevertheless, there are some limitations on the outcomes. The most important ones are that the information may not be representative of the target community because it was obtained in an easy-to-access manner. Also, it is possible that some leaders and organisational capabilities were center out of the study since the items chosen to represent this study were limited to the construction management firm, which implies that the study does not signify the opinions of other stakeholders in the country. More investigation might concentrate on factor analysis of a comprehensive list of items to create more valid and trustworthy clusters of DLP’s internal and external aspects. Then, digital leadership critical success factors requirements in small-medium enterprise and multinational organisations in the context of developed nations, compared to developing nation such as the Malaysian construction industry.