
Architectural education (AE) has traditionally focused on hands-on, experiential learning, setting it apart from other disciplines. Recently, however, there has been a shift to online education system (OES), which challenges the fundamental nature of AE. OES has resulted in more passive learning, thereby hindering student progress in AE. Consequently, the effectiveness and sustainability of online architectural education (OAE) have been questioned due to these challenges.
Despite the persistence of traditional education, OES has become a permanent fixture in higher education. Therefore, it is essential to understand OAE and choose suitable methods and platforms tailored to its unique characteristics. Identifying success factors for OAE is critical for its sustainability.
Previous research in this domain has mainly concentrated on architecture students’ satisfaction with OAE, tackling transition challenges, proposing guidelines, investigating the role of virtual reality (VR) in education and identifying obstacles to OAE adoption (Alkhalil et al. 2021; Al Maani et al. 2021; Alnusairat et al. 2021; Asadpour 2021; Ceylan et al. 2021a; Dennis 2021; Elrawy and Abouelmagd 2021; Koh and Wong 2021; Komarzyńska-świeściak et al. 2021; Leon et al. 2021; Peimani and Kamalipour 2021a; Wu et al. 2021; Bakir and Alsaadani 2022; Tandon et al. 2022; Xi and Cong 2022; Güler 2023). However, these studies have overlooked critical success factors which impede the development of sustainable strategies for OAE. Assessing the appropriateness of digital platforms for OAE in architecture schools is crucial. This study aims to identify success criteria (SCs), compare digital platforms across various variables and provide recommendations to enhance OAE’s and AE’s sustainability.
The current study is unique as it evaluates the success of OAE and digital platforms in both theoretical and practical courses, prioritises SCs, compares digital platforms and examines the impact of various factors on these platforms, thereby addressing a significant research gap.
Architecture schools are rapidly transitioning to OES utilising university resources, resulting in diverse approaches among institutions. While the swift shift to OES has provided some benefits, it has also introduced challenges that must be addressed to ensure equality in education, especially in developing countries like Turkey.
The worldwide adoption of OES at various educational levels has prompted extensive research into its effects on educational methodologies. This global shift has captured the interest of researchers, resulting in numerous studies examining aspects of OAE.
Many studies in the current literature have primarily focused on the impact of the transition on OAE (Al Maani et al. 2021; Alnusairat et al. 2021; Asadpour 2021; Ceylan et al. 2021a; Mayer 2021; Scatena et al. 2021; Metinal and Gumusburun Ayalp 2022; Nubani and Lee 2022). These studies show that technological, psychological, pedagogical, economic and interactional factors significantly influence the success of OAE (Al Maani et al. 2021; Alnusairat et al. 2021; Asadpour 2021; Scatena et al. 2021; Bakir and Alsaadani 2022; Khan and Thilagam 2022; Nubani and Lee 2022; Travis 2022). The choice of the digital platform is crucial for OAE, as teaching effectiveness depends on the platform’s features (Ferng 2020; Varma and Jafri 2021; Yu et al. 2022). Therefore, selecting the appropriate digital platform is essential for optimising OAE effectiveness.
Researchers have explored numerous facets of OAE. These include course quality (Tang et al. 2021), student satisfaction (Alkhalil et al. 2021; Alnusairat et al. 2021), changes in AE due to the transition (Elrawy and Abouelmagd 2021), architectural design communication in AE (Akçay Kavakoğlu et al. 2022) and student perceptions and experiences in the context of OAE (Al Maani et al. 2021; Komarzyńska-świeściak et al. 2021; Peimani and Kamalipour 2021a).
Moreover, several scholars have examined architecture students’ assessments of online design studios (Andiyan et al. 2021; Ceylan et al. 2021a) and recommended pedagogical frameworks for online architectural studios (Khan and Thilagam 2021). Additionally, studies have highlighted key drivers, challenges and facilitators for OAE (Khan and Thilagam 2022; Tandon et al. 2022).
Endeavours to tackle challenges in OAE include developing video-based VR approaches for online design courses (Wu et al. 2021), introducing new teaching methods and curriculum enhancements (Milovanović et al. 2020), digitally adapting building information modelling and communication technologies (Leon et al. 2021), and mapping students’ strategies for digital well-being in OAE (Dennis 2021).
Although previous studies on OAE provide valuable insights, they typically focus on quantitative or qualitative analyses using specific methodologies. Quantitative analyses encompass descriptive statistics and correlation analysis (Alnusairat et al. 2021; Koh and Wong 2021; Varma and Jafri 2021; Peimani and Kamalipour 2022; Güler 2023), exploratory factor analysis (Asadpour 2021), structural equation modelling (Akçay Kavakoğlu et al. 2022; Tandon et al. 2022; Metinal and Gumusburun Ayalp 2024) and analytic hierarchy process (Tang et al. 2021). Qualitative analyses include experimental studies (Wu et al. 2021), semi-structured interviews (Megahed and Hassan 2022; Yu et al. 2022) and focus group interviews (Ibrahim et al. 2021).
While these studies provide a range of insights into OAE, they often need to pay more attention to critical questions regarding OAE’s success factors and the appropriateness of digital platforms. This research addresses these gaps by identifying SCs through a systematic literature review (SLR), analysing their association with digital platforms via variance analysis, and assessing their impact on OAE success using eta-squared analysis. Furthermore, it examines the relationship between architectural course types in OAE and the digital platforms used. This inclusive approach is designed to guide strategic planning for sustainable AE.
Similar to previous studies, this research employed an online survey. However, it differed from earlier work by basing the survey questions on an SLR, which ensured greater objectivity. Additionally, it uniquely classified the impact of OES on AE by scope and defined critical success factors for OAE. Hypothesis testing was utilised to establish confidence intervals and examine the relationships between variables. Furthermore, eta-squared analysis was used to quantify the effect size of these factors on OAE success. This comprehensive methodology notably distinguishes this research from prior studies in the relevant literature.
This study employed a mixed approach, integrating both qualitative and quantitative methods. The qualitative aspect is based on an SLR, while the quantitative part was conducted using statistical analysis. The adopted mixed method consists of four successive phases, as presented in Figure 1.
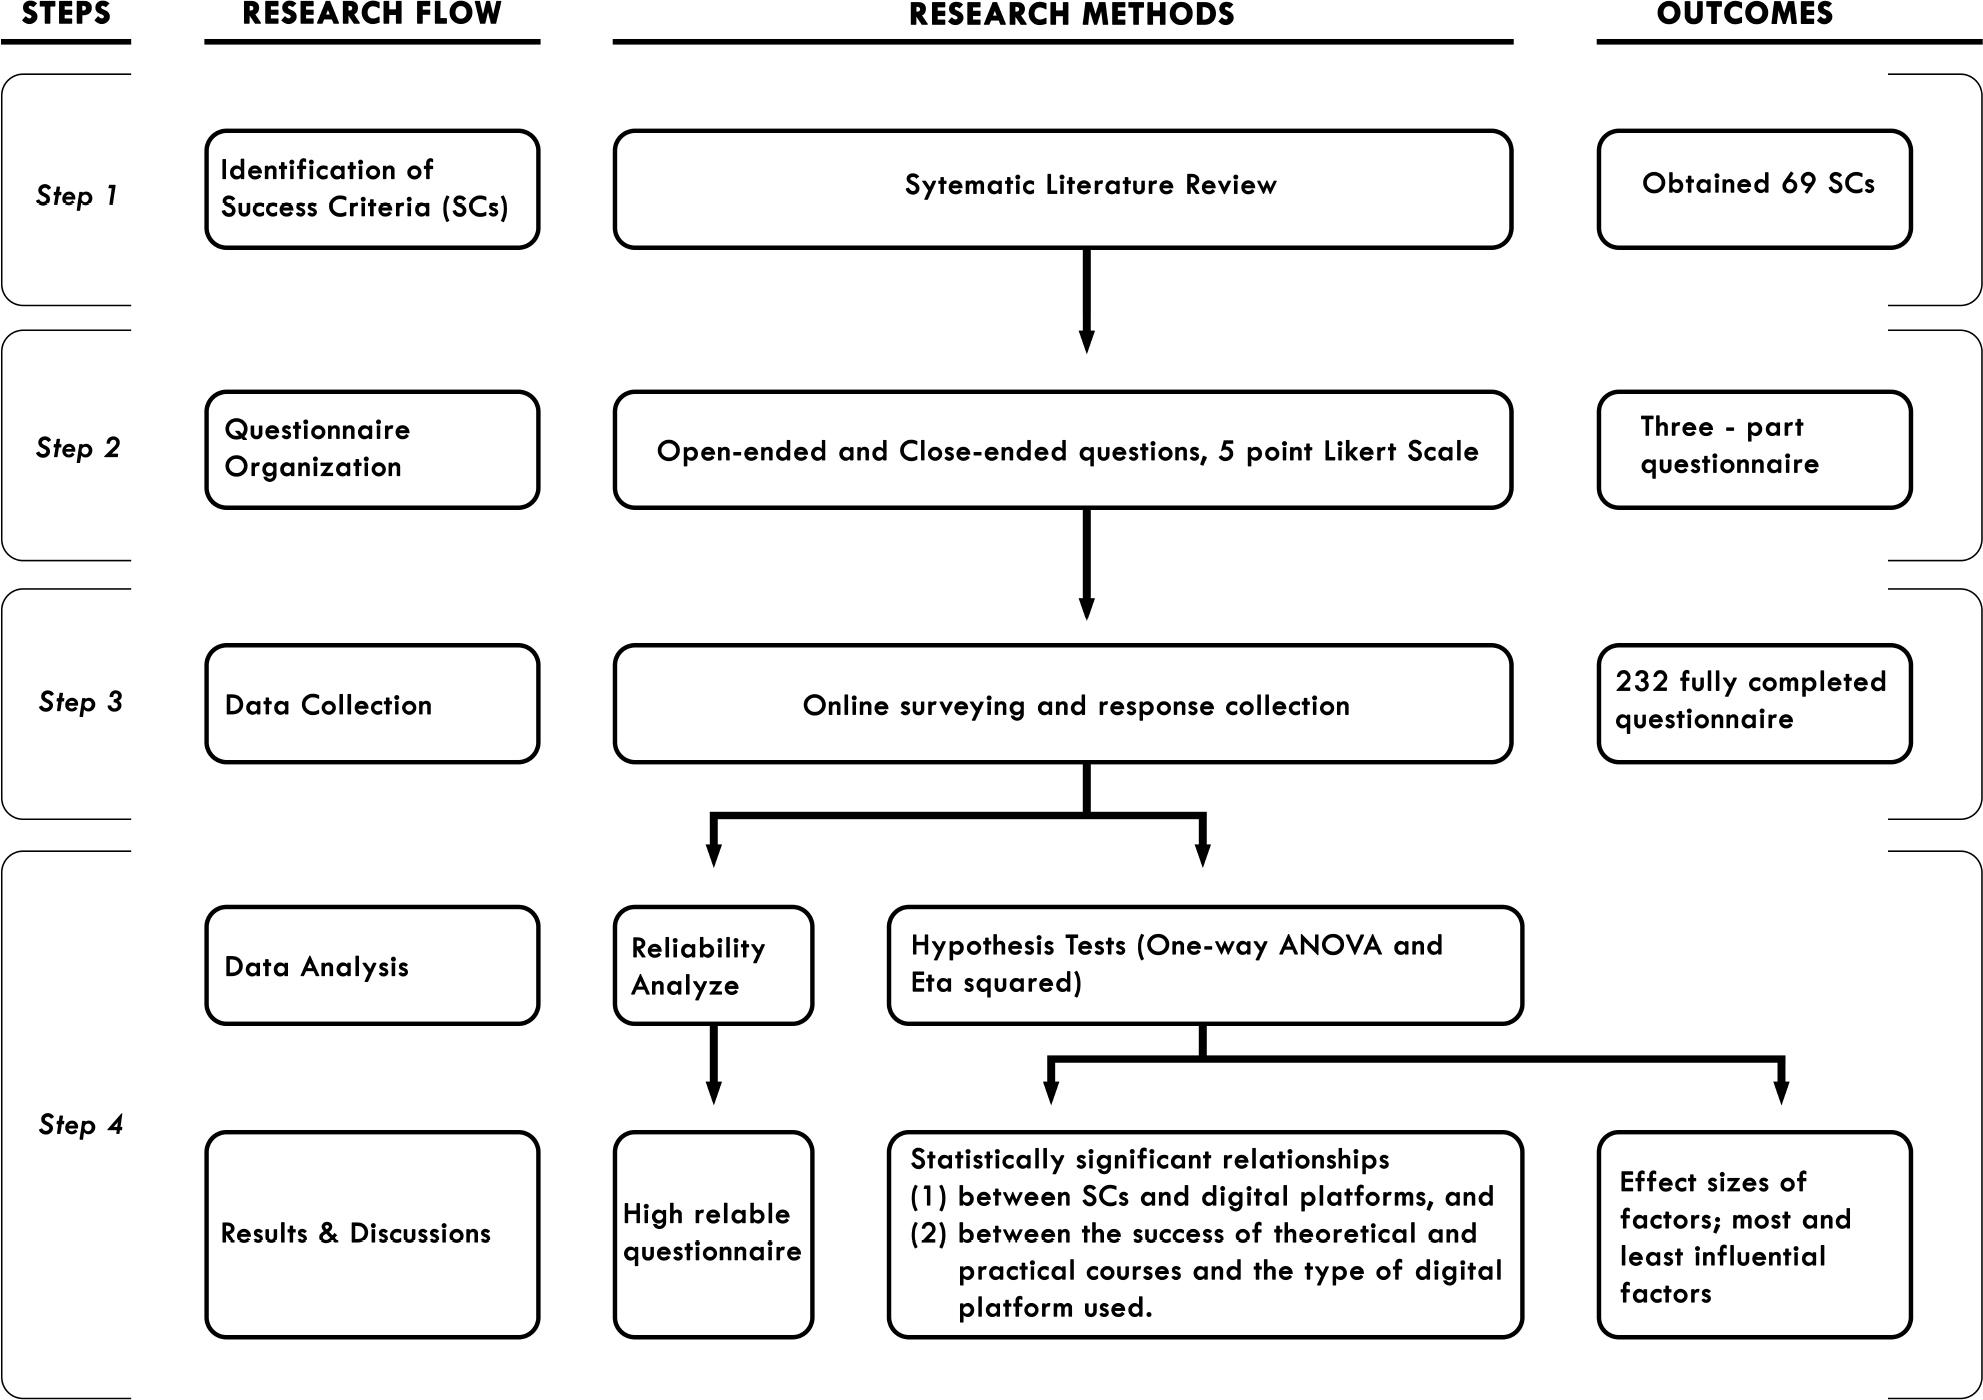
Research methodology framework. SCs, success criteria.
The initial stage of the current study focused on identifying the criteria influencing the success of OAE. These potential criteria were gathered through an SLR, a method considered objective by many scholars such as Ayat et al. (2021) and Gupta et al. (2019).
Various review methods are available for analysing existing literature. The systematic literature review is a research technique designed to evaluate relevant literature critically and gather data in this context (Liberati et al. 2009). To ensure systematic, transparent, unbiased and reproducible data collection from the literature, this study employed the SLR method advised by Macpherson and Jones (2010), Tranfield et al. (2003), and Denyer et al. (2008). SLR is an effective method for evaluating published work in the scientific field.
This study utilised a three-step approach to determine the possible criteria, which included the stages of identification, review, and inclusion.
The research question was defined in the identification phase, followed by developing a review protocol. Primary studies were identified, selected, extracted, analysed and synthesised during the review stage. The results obtained from the literature were then presented as a report in the evaluation and inclusion phase (Figure 2).
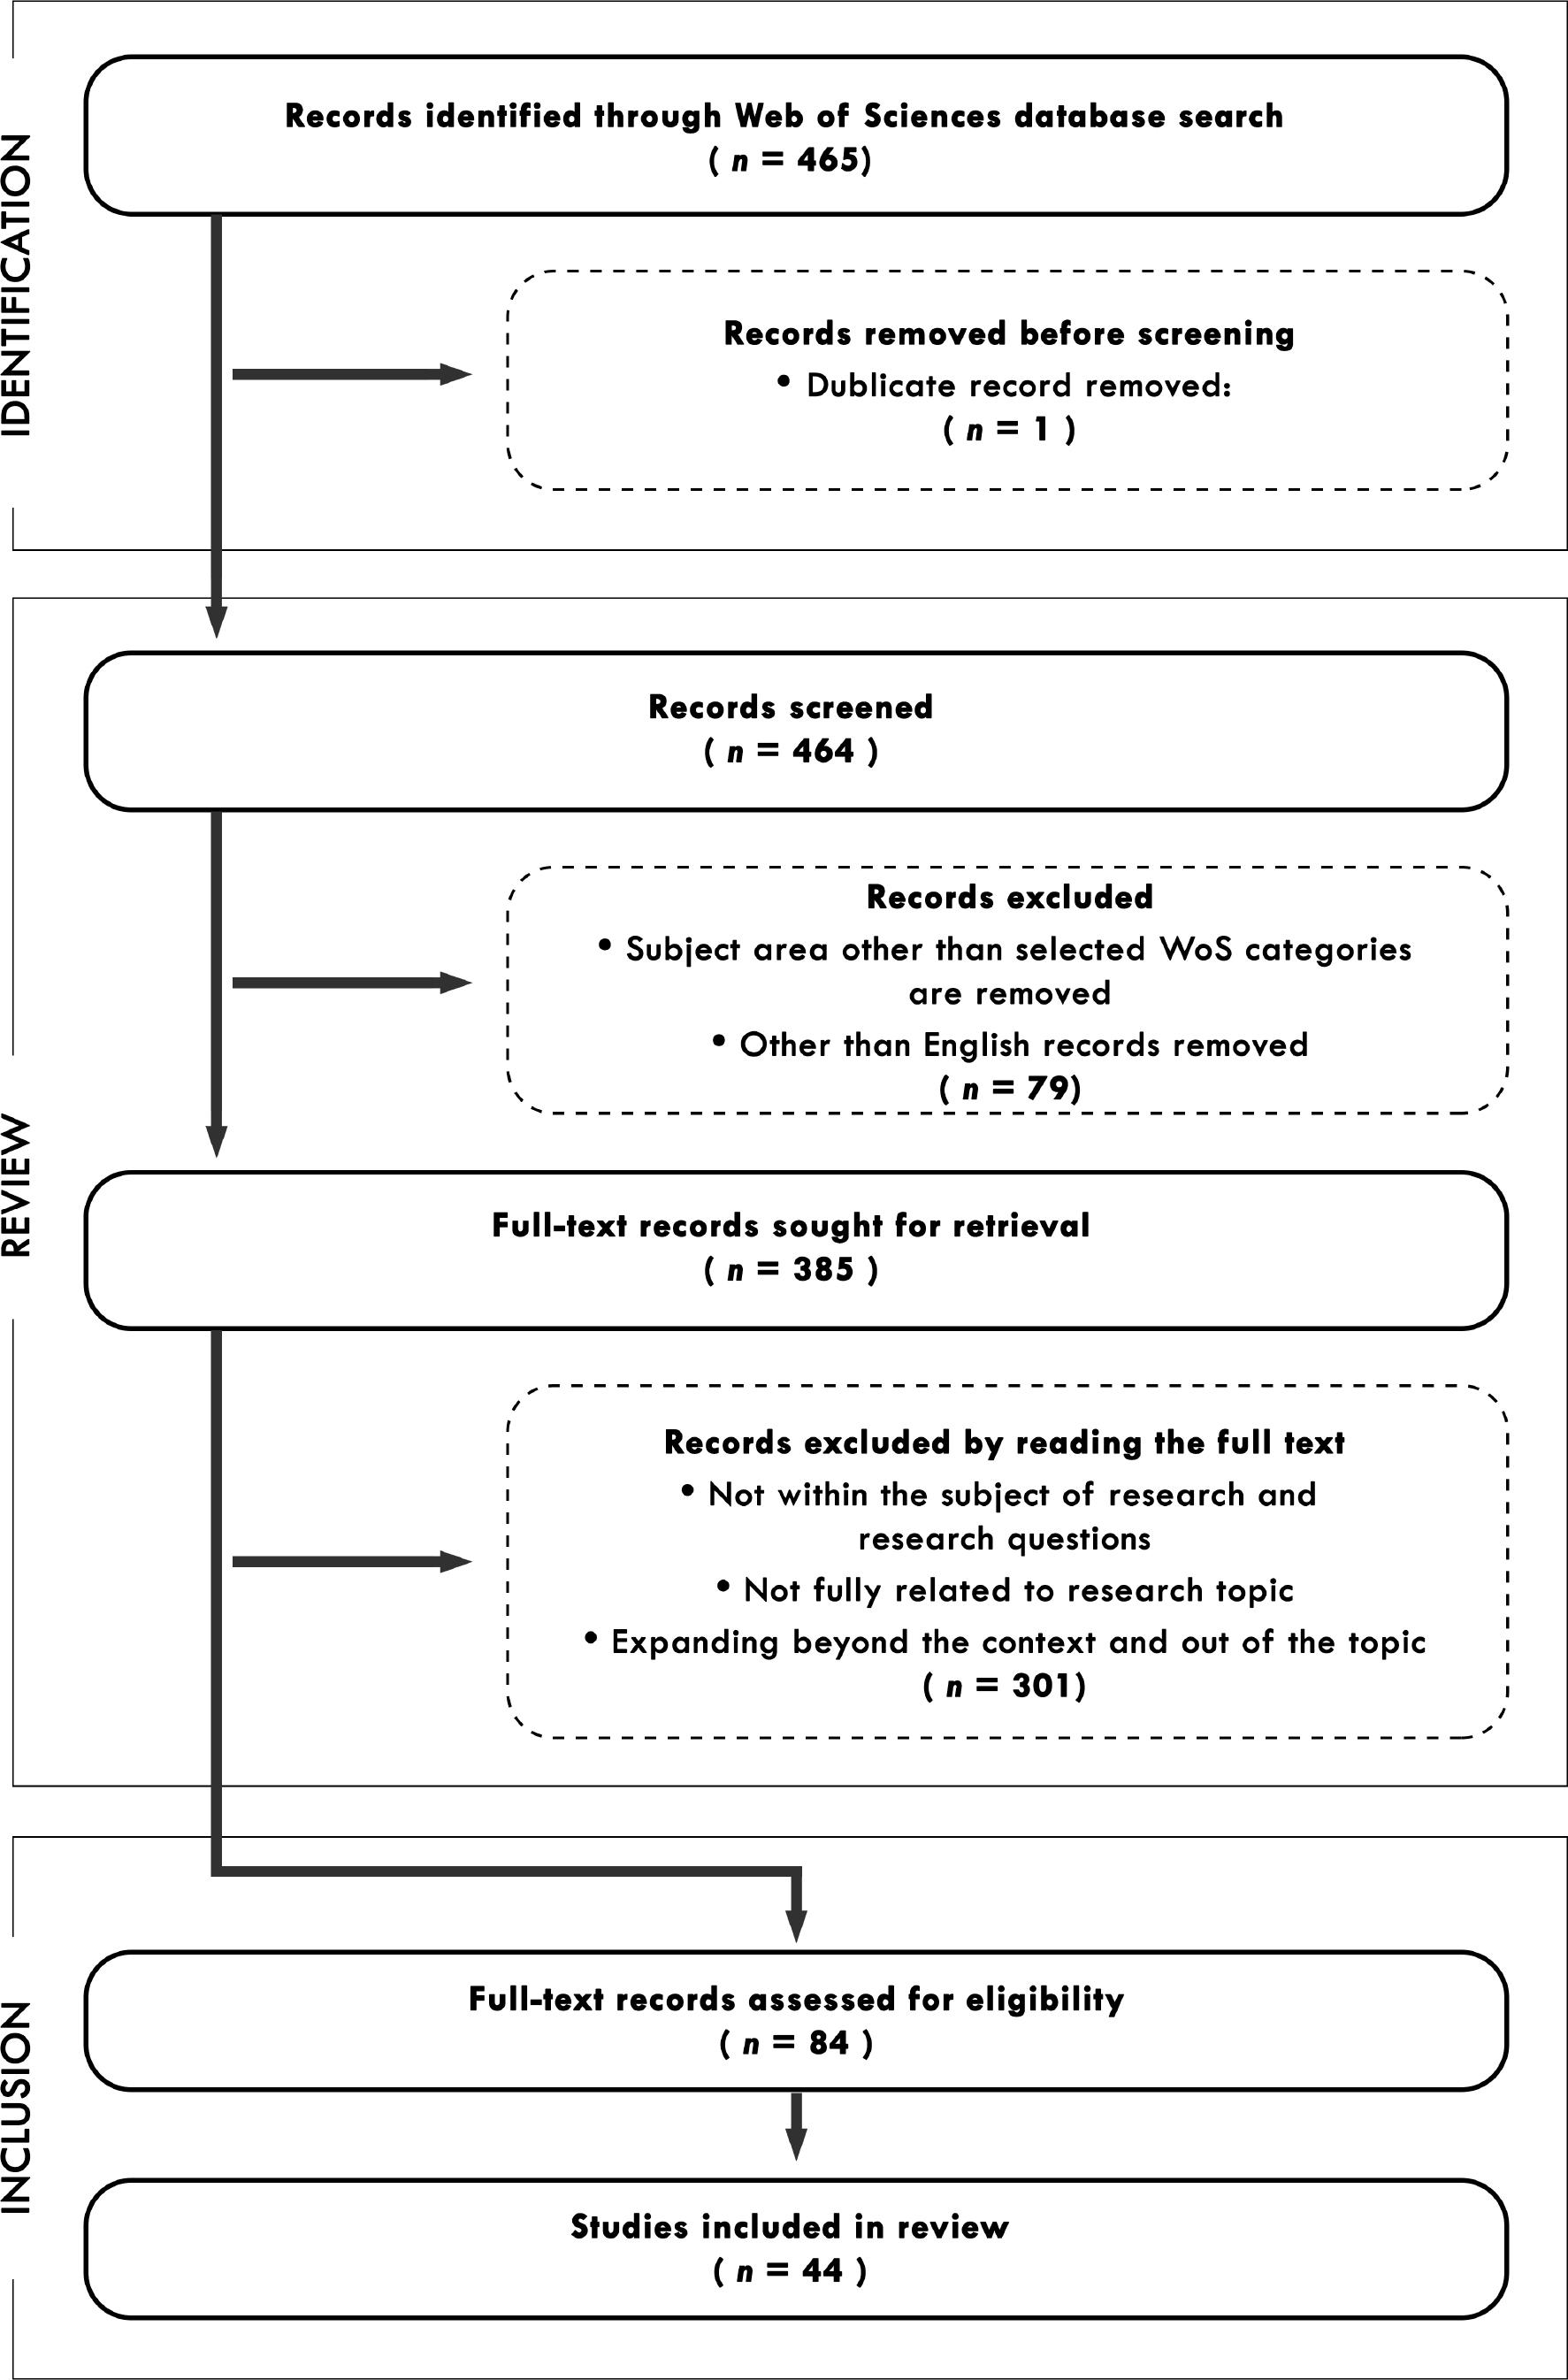
Flow diagram of the research protocol within the scope of SLR. SLR, systematic literature review.
The Web of Science (WoS) database, recognised for its extensive coverage and integrated analytics (Yu et al. 2020), was utilised to identify relevant studies. The search query applied in the WoS database was: (ALL FIELDS) ‘architectural education’ AND (‘online learning’ OR ‘distance education’ OR ‘distance learning’ OR ‘online education’), yielding 465 records. The search was restricted to English-language articles and review papers published in academic journals, deliberately excluding conference papers due to concerns about peer-review quality.
After duplicates were removed, 464 articles were evaluated. Additional filtering based on specific parameters, such as field (AE), publication language (English) and publication type, excluded 79 records. Well-defined inclusion and exclusion criteria were implemented, and all studies were reviewed in full text. This process resulted in the selection of 44 articles.
These studies served as the foundation for developing a questionnaire. A detailed analysis led to the identification of 69 SCs influencing the success of OES in AE. These SCs were classified into seven main categories: ‘technical and technological infrastructure’; ‘health and psychology’; ‘pedagogy’; ‘interaction, satisfaction and communication’; ‘educational adaptation’; ‘economic factors’; and ‘other factors’, according to their characteristics, focus, scope and nature.
In determining the factors and categorising the SCs, the areas of impact of the defined items were considered. The 69 SCs directly related to these seven factors are detailed in Table 1.
Criteria that affect the success of OAE
EA, educational adaptation; EF, economic factors; HP, health and psychology; ICS, interaction, communication and satisfaction; OAE, online architectural education; OF, other factor; P, pedagogy; SCs, success criteria; TT, technical and technological infrastructure.
A questionnaire derived from the SLR findings was administered to architecture students studying at universities in Turkey. It consisted of two sections.
The first section involved evaluating 69 SCs outlined in Table 1, categorised as follows: 11 for technical and technological infrastructure (TT), 12 for health and psychology (HP), 9 for pedagogy, 10 for interaction, communication and satisfaction (ICS), 22 for educational adaptation (EA), 3 for economic factors (EF) and 2 for other factors (OF). Participants rated the importance of these SCs using a five-point Likert-type scale, ranging from 1 (‘None’) to 5 (‘Very Highly’), based on their OAE experiences and expectations.
The second section gathered sociodemographic information from the participants, such as age, gender, education level and university type.
The current study focused on architecture students in Turkey who had taken theoretical and design courses online. The sample included students with more than one semester of online course experience. Data were collected through online questionnaires.
Turkey has 118 architecture departments within 208 universities. Researchers obtained permission from 118 universities to distribute the questionnaire to their architecture students. Data were gathered from 20 architecture departments from those that granted permission between 30 April and 28 June 2022. The questionnaire was emailed to 2,258 architecture students who had completed at least one semester entirely through OES.
A total of 232 fully completed questionnaires were received, representing a response rate of 10.27%. Response rates for web surveys tend to be lower than traditional mail surveys (Crawford et al. 2001). However, according to Iacobucci (2010), sample sizes ranging from 50 to 100 can be sufficient, and the conventional rule of requiring at least 200 samples is considered ‘conservative’ and ‘simplistic’. This study’s 232 fully completed responses are deemed adequate within this context.
Participant responses were analysed using the IBM Statistical Package for Social Sciences (SPSS) 26.0 software, incorporating various statistical tests such as normality tests, reliability analysis, one-way ANOVA and eta-squared.
Reliability analysis was conducted to evaluate the internal consistency of the questionnaire, following guidelines by Nunnally and Bernstein (2007). Cronbach’s alpha coefficient, which ranges from 0 to 1, was used to measure internal consistency, with a threshold of 0.7 considered acceptable for reliability (Cronbach 1951; Taber 2018).
Data normality was assessed to determine the appropriateness of parametric or non-parametric statistical methods. Skewness and kurtosis values were calculated to evaluate data distribution, with values within the range of –3 to +3 accepted as indicative of normal distribution.
Hypothesis tests were performed to examine potential statistically significant relationships in two areas of OAE: first, between SCs and the digital platforms used, and second, between the success of theoretical and practical courses and the type of digital platform employed. Various factors, including demographic variables, psycho-social profiles, course types, accessibility of requirements and digital platform features, influence OAE’s success. While demographic characteristics are not modifiable, selecting the appropriate digital platform for OAE is feasible. The current study aimed to identify a suitable platform for AE based on its structure and characteristics using hypothesis tests.
Given the normal distribution of data, the parametric one-way ANOVA was employed to analyse group means and determine whether statistically significant differences existed among groups. The Tukey Honestly Significant Difference (HSD) post-hoc test was applied to identify significant differences between group means.
Finally, effect size analysis quantified the proportion of variance in the dependent variable explained by the independent variable through eta-squared (η2). Effect size measures the significance and strength of observed effects, ranging from 0.00 to 1.00, with interpretations as follows: small effect (0.01–0.06), medium effect (0.06–0.14) and large effect (0.14 and above). Effect sizes calculated for individual factors in this study assessed their contribution to total variance.
In terms of the demographic characteristics of the sample group, there were 45 (19.4%) first-year architecture students, 54 (23.3%) second-year students, 50 (21.6%) third-year students and 83 (35.8%) fourth-year students. Among the participants, 148 (63.8%) were enrolled in private universities, while 84 (36.2%) attended state universities.
Regarding the digital platforms used for OAE, 155 participants (66.8%) used Zoom, 53 (22.8%) utilised Microsoft Teams, 13 (5.6%) opted for Google Meet and 11 (4.7%) participants used other platforms.
Finally, concerning the duration of education received through OES, 46 students (19.8%) completed one semester, 76 (32.8%) completed two semesters, 72 (31.0%) completed three semesters, 23 (9.9%) finished four semesters and 15 (6.5%) completed five semesters entirely through OES.
The Cronbach’s alpha coefficients, which assess the reliability of the dataset, were all above the minimum threshold of 0.7, indicating excellent internal consistency of the responses (Table 2).
Results of reliability and normality analysis
| Code of factors | Factor | Number of items | Cronbach’s alpha | Skewness | Kurtosis |
|---|---|---|---|---|---|
| TT | Technical and technological infrastructure | 11 | 0.930 | –0.580 | –0.556 |
| HP | Health and psychology | 12 | 0.959 | –0.381 | –0.916 |
| P | Pedagogy | 9 | 0.908 | –0.874 | 0.162 |
| ISC | Interaction, communication and satisfaction | 10 | 0.926 | –0.750 | –0.048 |
| EA | Educational adaptation | 22 | 0.958 | –0.606 | –0.018 |
| EF | Economic factors | 3 | 0.835 | –0.787 | –0.385 |
| OF | Other factors | 2 | 0.930 | –0.398 | –1.126 |
Additionally, verifying that the data follow a normal distribution is crucial before conducting statistical tests. Consequently, the skewness and kurtosis values for the variables were calculated, revealing that all data obtained from the questionnaires exhibited a normal distribution, as presented in Table 2.
Participants’ responses to the 69 SCs affecting the success of OAE, rated on a five-point Likert scale, were examined for total factor scores, means and standard deviations (SDs) and are presented in Table 3.
Factor scores of SCs
| Classification of SCs | The mean of the total factor score | Code of SCs | SD | |
|---|---|---|---|---|
| TT | 38.83 | T1 | 3.10 | 1.32 |
| T2 | 3.23 | 1.31 | ||
| T3 | 3.42 | 1.40 | ||
| T4 | 3.69 | 1.42 | ||
| T5 | 3.19 | 1.44 | ||
| T6 | 3.78 | 1.25 | ||
| T7 | 2.68 | 1.26 | ||
| T8 | 3.08 | 1.39 | ||
| TT | 38.83 | T9 | 3.33 | 1.40 |
| T10 | 3.09 | 1.38 | ||
| T11 | 3.25 | 1.31 | ||
| HP | 37.73 | HP1 | 3.26 | 1.40 |
| HP2 | 2.76 | 1.28 | ||
| HP3 | 3.03 | 1.41 | ||
| HP4 | 3.17 | 1.41 | ||
| HP5 | 3.10 | 1.42 | ||
| HP6 | 3.12 | 1.41 | ||
| HP7 | 3.41 | 1.39 | ||
| HP8 | 3.15 | 1.40 | ||
| HP9 | 3.16 | 1.37 | ||
| HP10 | 3.24 | 1.41 | ||
| HP11 | 3.24 | 1.35 | ||
| HP12 | 3.11 | 1.32 | ||
| P | 29.87 | P1 | 3.22 | 1.27 |
| P2 | 3.09 | 1.27 | ||
| P3 | 3.46 | 1.44 | ||
| P4 | 3.02 | 1.29 | ||
| P5 | 3.27 | 1.37 | ||
| P6 | 3.17 | 1.28 | ||
| P7 | 3.48 | 1.25 | ||
| P8 | 3.56 | 1.30 | ||
| P9 | 3.60 | 1.30 | ||
| ICS | 33.29 | ISC1 | 3.22 | 1.31 |
| ISC2 | 3.32 | 1.41 | ||
| ISC3 | 3.06 | 1.39 | ||
| ISC4 | 3.37 | 1.36 | ||
| ISC5 | 3.30 | 1.37 | ||
| ISC6 | 3.43 | 1.29 | ||
| ISC7 | 3.60 | 1.25 | ||
| ISC8 | 3.25 | 1.31 | ||
| ISC9 | 3.28 | 1.31 | ||
| ISC10 | 3.47 | 1.29 | ||
| EA | 69.32 | EA1 | 3.55 | 1.29 |
| EA2 | 2.99 | 1.37 | ||
| EA3 | 3.19 | 1.35 | ||
| EA4 | 3.08 | 1.32 | ||
| EA5 | 3.29 | 1.34 | ||
| EA6 | 3.19 | 1.40 | ||
| EA7 | 3.44 | 1.35 | ||
| EA8 | 3.25 | 1.34 | ||
| EA9 | 2.86 | 1.25 | ||
| EA10 | 3.31 | 1.26 | ||
| EA | 69.32 | EA11 | 3.24 | 1.33 |
| EA12 | 3.44 | 1.34 | ||
| EA13 | 3.03 | 1.36 | ||
| EA14 | 2.81 | 1.34 | ||
| EA15 | 2.84 | 1.36 | ||
| EA16 | 3.31 | 1.34 | ||
| EA17 | 2.97 | 1.31 | ||
| EA18 | 3.25 | 1.37 | ||
| EA19 | 3.04 | 1.28 | ||
| EA20 | 3.01 | 1.29 | ||
| EA21 | 3.06 | 1.28 | ||
| EA22 | 3.19 | 1.38 | ||
| EF | 10.60 | EF1 | 3.20 | 1.33 |
| EF2 | 3.66 | 1.40 | ||
| EF3 | 3.74 | 1.35 | ||
| OF | 6.63 | OF1 | 3.30 | 1.40 |
| OF2 | 3.34 | 1.45 |
EA, educational adaptation; EF, economic factors; HP, health and psychology; ICS, interaction, communication and satisfaction; OF, other factors; P, pedagogy; SCs: success criteria; SD, standard deviation; TT, technical and technological infrastructure;
Hypothesis tests were used to investigate whether there was a statistically significant relationship between SCs and the digital platforms used and between the success of theoretical and practical courses and the type of digital platform.
Given that the data followed a normal distribution, one-way ANOVA, a parametric hypothesis test, wasconducted, and the hypotheses outlined below were established.
H01: There is no significant relationship between the main factors influencing the successful implementation of OAE and the digital platform used.
H02: There is no significant relationship between the success of theoretical and practical courses in OAE and the type of digital platform used.
H03: The main factors affecting the successful implementation of OAE and the digital platform used have a significant relationship.
H04: There is a significant relationship between the success of theoretical and practical courses in OAE and the type of digital platform used.
One-way ANOVA was employed to test the hypothesis for the variable of the digital platform used in OAE, which involves multiple groups. Any variables with significance levels (p) of 0.05 or less were considered significant. A significance level (p) below 0.05 indicates the rejection of the null hypotheses (H01, H02) and the acceptance of the alternative hypotheses (H03, H04), signifying a statistically significant relationship between variables.
Hypothesis testing for one-way ANOVA with the factors was carried out by calculating the total scores of the SCs within each factor (Table 4).
Hypothesis test results of digital platforms and factors
| Factor | Digital platforms | Sig. | |||||||||||
|---|---|---|---|---|---|---|---|---|---|---|---|---|---|
| Zoom | Google Meet | Microsoft Teams | Other | ||||||||||
| n | SD | n | SD | n | SD | n | SD | ||||||
| TT | 33.91 | 155 | 11.33 | 40.84 | 13 | 9.58 | 42.28 | 53 | 7.87 | 25.81 | 11 | 13.82 | 0.000 |
| HP | 35.21 | 155 | 14.06 | 45.38 | 13 | 11.18 | 45.23 | 53 | 9.17 | 28.27 | 11 | 13.69 | 0.000 |
| P | 29.24 | 155 | 9.29 | 31.08 | 13 | 8.18 | 33.30 | 53 | 5.95 | 20.82 | 11 | 9.55 | 0.000 |
| ICS | 32.22 | 155 | 10.42 | 34.77 | 13 | 11.30 | 38.19 | 53 | 6.94 | 23.18 | 11 | 11.28 | 0.000 |
| EA | 67.86 | 155 | 22.37 | 74.54 | 13 | 18.94 | 76.51 | 53 | 12.93 | 49.18 | 11 | 25.96 | 0.000 |
| EF | 10.28 | 155 | 3.66 | 11.77 | 13 | 3.44 | 11.75 | 53 | 2.41 | 8.27 | 11 | 4.71 | 0.004 |
| OF | 6.25 | 155 | 2.75 | 7.15 | 13 | 2.97 | 7.92 | 53 | 2.16 | 5.27 | 11 | 3.23 | 0.000 |
Note(s): p ≤ 0.05.
EA, educational adaptation; EF, economic factors; HP, health and psychology; ICS, interaction, communication, and satisfaction; n, population; OF, other factors; P, pedagogy; SD, standard deviation; TT, technical and technological infrastructure;
Based on the one-way ANOVA results in Table 4, the significance values for TT (Sig = 0.000), HP (Sig = 0.000), P (Sig = 0.000), ISC (Sig = 0.000), EA (Sig = 0.000), EF (Sig = 0.004) and OF (Sig = 0.000) are all <0.05. Therefore, there is insufficient evidence to accept the H01 hypothesis. This indicates a statistically significant relationship between all the factors influencing the success of OAE and the digital platforms used by the participants.
Additionally, Table 5 presents the multiple comparisons (post hoc)-Tukey (HSD) test results based on the group means of the factors with identified relationships.
Multiple comparison test (Tukey HSD)
| Dependent variable | I | J | I–J | SD | Sig. |
|---|---|---|---|---|---|
| TT | Zoom | Google Meet | –6.93 | 3.08 | 0.114 |
| Microsoft Teams | –8.36* | 1.69 | 0.000* | ||
| Other | 8.09 | 3.33 | 0.074 | ||
| Google Meet | Zoom | 6.93 | 3.08 | 0.114 | |
| Microsoft Teams | –1.43 | 3.30 | 0.972 | ||
| Other | 15.02* | 4.37 | 0.004* | ||
| Microsoft Teams | Zoom | 8.36* | 1.69 | 0.000* | |
| Google Meet | 1.43 | 3.30 | 0.972 | ||
| Other | 16.46* | 3.53 | 0.000* | ||
| Other | Zoom | –8.09 | 3.33 | 0.074 | |
| Google Meet | –15.02* | 4.37 | 0.004* | ||
| Microsoft Teams | –16.46* | 3.53 | 0.000* | ||
| HP | Zoom | Google Meet | –10.17* | 3.73 | 0.035* |
| Microsoft Teams | –10.01* | 2.05 | 0.000* | ||
| Other | 6.93 | 4.03 | 0.317 | ||
| Google Meet | Zoom | 10.17* | 3.73 | 0.035* | |
| Microsoft Teams | 0.158 | 4.00 | 1.000 | ||
| Other | 17.11* | 5.30 | 0.008* | ||
| Microsoft Teams | Zoom | 10.01* | 2.05 | 0.000* | |
| Google Meet | –0.15 | 4.00 | 1.000 | ||
| Other | 16.95* | 4.28 | 0.001* | ||
| Other | Zoom | –6.93 | 4.03 | 0.317 | |
| Google Meet | –17.11* | 5.30 | 0.008* | ||
| Microsoft Teams | –16.95* | 4.28 | 0.001* | ||
| P | Zoom | Google Meet | –1.83 | 2.48 | 0.881 |
| Microsoft Teams | –4.06* | 1.37 | 0.017* | ||
| Other | 8.42* | 2.68 | 0.010* | ||
| Google Meet | Zoom | 1.83 | 2.48 | 0.881 | |
| Microsoft Teams | –2.22 | 2.66 | 0.837 | ||
| Other | 10.25* | 3.52 | 0.020* | ||
| Microsoft Teams | Zoom | 4.06* | 1.37 | 0.017* | |
| Google Meet | 2.22 | 2.66 | 0.837 | ||
| Other | 12.48* | 2.85 | 0.000* | ||
| Other | Zoom | –8.42* | 2.68 | 0.010* | |
| Google Meet | –10.25* | 3.52 | 0.020* | ||
| Microsoft Teams | –12.48* | 2.85 | 0.000* | ||
| ICS | Zoom | Google Meet | –2.54 | 2.84 | 0.806 |
| Microsoft Teams | –5.96* | 1.56 | 0.001* | ||
| Other | 9.03* | 3.07 | 0.018* | ||
| Google Meet | Zoom | 2.54 | 2.84 | 0.806 | |
| Microsoft Teams | –3.41 | 3.04 | 0.675 | ||
| Other | 11.58* | 4.03 | 0.023* | ||
| Microsoft Teams | Zoom | 5.96* | 1.56 | 0.001* | |
| Google Meet | 3.41 | 3.04 | 0.675 | ||
| Other | 15.00* | 3.26 | 0.000* | ||
| Other | Zoom | –9.03* | 3.07 | 0.018* | |
| Google Meet | –11.58* | 4.03 | 0.023* | ||
| Microsoft Teams | –15.00* | 3.26 | 0.000* | ||
| EA | Zoom | Google Meet | –6.67 | 5.95 | 0.676 |
| Microsoft Teams | –8.64* | 3.28 | 0.044* | ||
| Other | 18.68* | 6.43 | 0.021* | ||
| Google Meet | Zoom | 6.67 | 5.95 | 0.676 | |
| Microsoft Teams | –1.97 | 6.38 | 0.990 | ||
| Other | 25.35* | 8.44 | 0.016* | ||
| Microsoft Teams | Zoom | 8.64* | 3.28 | 0.044* | |
| Google Meet | 1.97 | 6.38 | 0.990 | ||
| Other | 27.32* | 6.83 | 0.000* | ||
| Other | Zoom | –18.68* | 6.43 | 0.021* | |
| Google Meet | –25.35* | 8.44 | 0.016* | ||
| Microsoft Teams | –27.32* | 6.83 | 0.000* | ||
| EF | Zoom | Google Meet | –1.49 | 1.00 | 0.443 |
| Microsoft Teams | –1.47* | 0.55 | 0.039* | ||
| Other | 2.00 | 1.08 | 0.250 | ||
| Google Meet | Zoom | 1.49 | 1.00 | 0.443 | |
| Microsoft Teams | 0.01 | 1.07 | 1.000 | ||
| Other | 3.49 | 1.42 | 0.068 | ||
| Microsoft Teams | Zoom | 1.47* | 0.55 | 0.039* | |
| Google Meet | –0.01 | 1.07 | 1.000 | ||
| Other | 3.48* | 1.15 | 0.014* | ||
| Other | Zoom | –2.00 | 1.08 | 0.250 | |
| Google Meet | –3.49 | 1.42 | 0.068 | ||
| Microsoft Teams | –3.48* | 1.15 | 0.014* | ||
| OF | Zoom | Google Meet | –0.90 | 0.77 | 0.640 |
| Microsoft Teams | –1.67* | 0.42 | 0.001* | ||
| Other | 0.97 | 0.83 | 0.647 | ||
| Google Meet | Zoom | 0.90 | 0.77 | 0.640 | |
| Microsoft Teams | –0.77 | 0.83 | 0.787 | ||
| Other | 1.88 | 1.09 | 0.315 | ||
| OF | Microsoft Teams | Zoom | 1.67* | 0.42 | 0.001* |
| Google Meet | 0.77 | 0.83 | 0.787 | ||
| Other | 2.65* | 0.88 | 0.016* | ||
| Other | Zoom | –0.97 | 0.83 | 0.647 | |
| Google Meet | –1.88 | 1.09 | 0.315 | ||
| Microsoft Teams | –2.65* | 0.88 | 0.016* |
Note(s): p = 0.05.
The asterisk indicates that the difference between the group means is statistically significant.
EA, educational adaptation; EF, economic factors; HP, health and psychology; ICS, interaction, communication, and satisfaction; OF, other factor; P, pedagogy; SD, standard deviation; TT, technical and technological infrastructure.
Post-hoc test results revealed that architecture students using Microsoft Teams for OAE encountered more technology and technical infrastructure problems than those using Zoom and other applications. Analogously, architecture students who used Google Meet faced more issues than users of other platforms, except Zoom and Microsoft Teams.
Additionally, architecture students using Google Meet and Microsoft Teams reported more significant health and psychological problems than those using Zoom and other platforms.
Furthermore, architecture students using Zoom, Google Meet and Microsoft Teams experienced more difficulties related to pedagogy, EA, interaction, satisfaction and communication than those using other applications. Microsoft Teams users faced more of these challenges than Zoom users.
Finally, architecture students using Microsoft Teams for OAE encountered more economic and other related issues than those using Zoom and other applications.
Whether the type of digital platform used in OAE affects the success of theoretical and practical courses was examined using one-way ANOVA (Table 6).
Hypothesis test results of course types and digital platforms
| Course types | Digital platforms | Sig. | |||||||||||
|---|---|---|---|---|---|---|---|---|---|---|---|---|---|
| Zoom | Google Meet | Microsoft Teams | Other | ||||||||||
| n | SD | n | SD | n | SD | n | SD | ||||||
| Theoretical courses | 3.81 | 155 | 0.84 | 3.62 | 13 | 0.76 | 3.49 | 53 | 1.06 | 3.09 | 11 | 1.04 | 0.068 |
| Practical courses | 3.55 | 155 | 1.05 | 3.15 | 13 | 0.98 | 2.83 | 53 | 1.13 | 2.82 | 11 | 1.32 | 0.000 |
Note(s): p ≤ 0.05.
n, Population; SD, standard deviation;
Based on the one-way ANOVA results in Table 6, the H03 hypothesis is not accepted since the significance value for practical courses (Sig = 0.000) is <0.05.
In this context, it was determined that the success of practical courses in OAE is affected by the type of digital platform used, while that of theoretical courses is not. In other words, there is a statistically significant relationship between course type and the digital platforms used by the participants.
Table 7 shows the multiple comparisons (post hoc) results based on the group means of the variables where a relationship was identified.
Multiple comparison test (Tukey HSD)
| Dependent variable | I | J | I–J | SE | Sig. |
|---|---|---|---|---|---|
| Theoretical courses | Zoom | Google Meet | 0.19 | 0.26 | 0.874 |
| Microsoft Teams | 0.32 | 0.14 | 0.116 | ||
| Other | 0.72 | 0.28 | 0.054 | ||
| Google Meet | Zoom | –0.19 | 0.26 | 0.874 | |
| Microsoft Teams | 0.12 | 0.28 | 0.970 | ||
| Other | 0.52 | 0.37 | 0.492 | ||
| Microsoft Teams | Zoom | –0.32 | 0.14 | 0.116 | |
| Google Meet | –0.12 | 0.28 | 0.970 | ||
| Other | 0.40 | 0.30 | 0.543 | ||
| Other | Zoom | –0.72 | 0.28 | 0.054 | |
| Google Meet | –0.52 | 0.37 | 0.492 | ||
| Microsoft Teams | –0.40 | 0.30 | 0.543 | ||
| Practical courses | Zoom | Google Meet | 0.39 | 0.31 | 0.588 |
| Microsoft Teams | 0.71* | 0.17 | 0.000* | ||
| Other | 0.73 | 0.33 | 0.137 | ||
| Google Meet | Zoom | –0.39 | 0.31 | 0.588 | |
| Microsoft Teams | 0.32 | 0.33 | 0.769 | ||
| Other | 0.33 | 0.44 | 0.874 | ||
| Microsoft Teams | Zoom | –0.71* | 0.17 | 0.000* | |
| Google Meet | 0.32 | 0.33 | 0.769 | ||
| Other | 0.01 | 0.35 | 1.000 | ||
| Other | Zoom | –0.73 | 0.33 | 0.137 | |
| Google Meet | –0.33 | 0.44 | 0.874 | ||
| Microsoft Teams | –0.01 | 0.35 | 1.000 |
Note(s): p ≤ 0.05.
The asterisk indicates that the difference between the group means is statistically significant.
According to post-hoc test results (Table 7), Zoom was more successful than Microsoft Teams for practical courses in OAE. This preference was reflected in architecture students’ perceptions, as they expressed a stronger preference for using Zoom over Microsoft Teams in applied courses in OAE.
An eta-squared (η2) analysis was performed to assess the impact levels of the factors influencing the success of OAE. The results indicated that the TT factor accounted for 14% of the total variance, the HP factor for 13%, the P factor for 8.7%, the ISC factor for 10.6%, the EA factor for 7.5%, the EF factor for 5.7% and the OF factor for 7.7% of the total variance (Table 8).
Effect sizes of factors
| Code of factor | Factor | Number of items | η2 | % |
|---|---|---|---|---|
| TT | Technical and technological infrastructure | 11 | 0.140 | 14 |
| HP | Health and psychology | 12 | 0.130 | 13 |
| P | Pedagogy | 9 | 0.087 | 8.7 |
| ICS | Interaction, communication and satisfaction | 10 | 0.106 | 10.6 |
| EA | Educational adaptation | 22 | 0.075 | 7.5 |
| EF | Economic factors | 3 | 0.057 | 5.7 |
| OF | Other factors | 2 | 0.077 | 7.7 |
Note(s): p ≤ 0.05.
This study employed quantitative statistical analyses to pinpoint the success factors of OAE. The results offer a comprehensive overview, highlighting the importance of these factors. Accordingly, understanding the relationship between these success factors and the digital platforms used is crucial. Moreover, it is essential to explore the correlation between different types of courses and digital applications to optimise sustainable OAE strategies.
The initial hypothesis testing revealed that architecture students using Google Meet, Microsoft Teams and other applications experienced more difficulties with the applications; privacy and security concerns; psychological and social challenges; pedagogical and technical shortcomings; and issues with interactive, independent and collaborative learning compared with those using Zoom.
Peimani and Kamalipour (2021b) observed that Zoom offers superior usability and higher user satisfaction than other platforms. Supporting this, Alnusairat et al. (2021) and Tandon et al. (2022) concluded that Zoom is more user-friendly than other applications. Ferng (2020) emphasised Zoom’s adaptability, particularly in higher education settings.
Zoom’s widespread use in OES globally is attributed to its ability to cater to specific needs (Zoom 2023a). Its open-source nature facilitates continuous improvement and frequent updates, which are made possible through global developer collaboration.
Peimani and Kamalipour (2021a, 2021b) noted that Zoom provides more digital opportunities than many other online education platforms, distinguishing itself with unique user benefits during sessions.
This study observed that Zoom outperformed other platforms across all identified factors. Consequently, other digital platforms for education need to catch up in critical areas essential for the success of OAE, such as application interfaces, source codes, licensing options and software features. These shortcomings underscore the importance of selecting a robust digital platform like Zoom, which provides sustainable functionality, ensuring the effective delivery and success of OAE.
According to the results obtained in subsequent hypothesis testing, architecture students found Zoom more successful than Microsoft Teams for practical courses in OAE.
The traditional concept of AE revolves around delivering education to prospective students through various courses (Ghonim and Eweda 2018). Practical courses (e.g., technology-based courses, artistic courses, architectural design studios) have distinct requirements and methodologies (Ceylan et al. 2021a). Meeting the specific requirements of practical courses becomes crucial when transitioning to OES. In this context, Zoom is more successful than Microsoft Teams in facilitating the transition of practical courses and satisfying architecture students in Turkey.
Zoom’s efficiency in OAE’s practical courses in Turkey can be attributed to several key factors. Its low bandwidth requirements ensure accessibility for students across diverse regions. Practical courses in AE require significant curriculum hours and active participation (Bakir and Alsaadani 2022). These classes are lengthy and must continue without interruption. Zoom’s efficient use of bandwidth and its ability to function smoothly even on lower internet speeds (Zoom 2023b) make it accessible across Turkey, where the internet infrastructure varies significantly (Ceylan et al. 2021b). This ensures that architecture students from diverse regions can participate without significant technical hindrances (Chukwunonso and Nosike 2024).
The core component of AE’s practical courses is the architectural design studio, where students work on designs and projects in a collaborative environment (Megahed and Hassan 2022; Metinal and Gumusburun Ayalp 2024). Design studios heavily rely on critique sessions where students present their work and receive feedback (Hettithanthri and Hansen 2022). Zoom’s high-quality video and audio capabilities, screen sharing, breakout rooms and annotation features enable effective virtual critiques (Tuç 2023). These features facilitate collaboration, mirroring the interactive nature of a physical studio.
Although tactile experiences such as model making and site visits pose unique challenges in an online format, Zoom can be used in conjunction with supplementary technologies like VR and augmented reality (AR) (Tan et al. 2022). These technologies can be used alongside Zoom to create more immersive learning experiences. For instance, virtual site visits can be conducted using 360- degree videos and VR, which can be shared and discussed in real time on Zoom, providing an alternative to physical site visits.
Zoom’s cost-effective options make it an appealing choice for OAE courses in developing countries like Turkey, which face budgetary constraints (Karademir et al. 2020). This is particularly significant in contexts where financial limitations prevail. The widespread integration of Zoom within OAE, especially in Turkey with intensive practical courses such as architectural design studios, has standardised its use, reducing ambiguity and ensuring a unified learning experience across various architectural courses and educational levels.
In recent years, Zoom has been one of the fastest digital platforms to adapt to Turkey’s scale (Sünger 2021). With its versatile features, it can be effectively used across all disciplines. It quickly became widespread and adapted easily, maintaining its presence efficiently. Moreover, its ability to integrate with national education platforms widely used in Turkey made Zoom a preferred choice (Ricky 2023; Zoom 2023c).
The results from this study indicate that Zoom satisfies architecture students with its performance in OAE’s practical courses. Zoom’s combination of accessibility, comprehensive features, cost-effectiveness and support for interactive and practical learning makes it the best digital platform for OAE’s practical courses in Turkey. Its ability to facilitate detailed critiques, group work and immersive online experiences addresses the specific needs of AE, ensuring that students continue to receive a high-quality education despite the challenges posed by OES.
The results indicated that SCs related to technology and technical infrastructure significantly impact the success of OAE (η2 = 0.140). At the same time, SCs about HP (η2 = 0.130); interaction, satisfaction and communication (η2 = 0.087); pedagogy (η2 = 0.106); EA (η2 = 0.075) and OF (η2 = 0.077) exert a moderate influence. SCs associated with EF (η2 = 0.057) demonstrated a minimal effect.
The critical role of technology in OAE is evident, as its success is closely linked to the technological resources and capabilities available. This is underscored by the ranking of SCs by importance, where technology-related factors emerge as the most and least critical.
As mentioned earlier, EF are significant in developing countries like Turkey. However, the current study found that EF negatively impacted OAE success.
This finding contrasts with previous studies (Brzezicki 2020; Schwarz et al. 2020; Al Maani et al. 2021; Asadpour 2021; Ibrahim et al. 2021; Mayer 2021; Scatena et al. 2021; Varma and Jafri 2021), where EF were deemed significant.
This conclusion can be attributed to government support, social solidarity and adapting to new educational requirements. Strong measures by authorities to support less privileged groups, especially financially disadvantaged students in architectural higher education, played a crucial role in mitigating the impact of EF on OAE.
Additionally, the diversification and widespread adoption of hardware and software for OAE have reduced costs over time. As user numbers grew, new software development led to lower fees, further diminishing the influence of EF on OAE.
The rapid shift to OES worldwide has introduced new requirements and responsibilities. Among these is the necessity of selecting the most suitable method and digital platform to effectively convey knowledge to students at various educational levels and across different disciplines. However, the quick transition without adequate preparation has led to international variations in education delivery standards (Milovanović et al. 2020; Schwarz et al. 2020; Ibrahim et al. 2021). Hence, for the future of AE, developing a common approach or an optimal model to ensure consistency under all conditions is crucial.
Identifying the SCs and selecting the appropriate digital platform is pivotal for the success and sustainability of OAE. This study employed a multistage framework to identify OAE success factors. Initially, 69 SCs influencing OAE success were identified and quantified through a SLR. These SCs were categorised based on their scope and impact, and their sub-dimensions were identified. The study then examined the relationship between these factors and digital platforms and the success of theoretical and practical courses according to the type of digital platform used. Finally, the effect sizes of these factors were calculated, and their impact levels were determined using one-way ANOVA and eta-squared analysis.
The current study concluded that Zoom is the most suitable digital platform for OAE due to the educational technologies and opportunities it offers. Although improvements are needed in student-centred, customisable learning and potential development, Zoom was the best-performing platform among those currently used in OAE. This conclusion is based on its effective performance in the most significant criteria for OAE success, such as ‘flexibility to run the applications on a variety of devices’, ‘opportunity to access recorded lectures and juries at any time’, and ‘the absolute need for accessibility to hardware such as tablets and computers’. For sustainable OAE success, digital platforms with similar software bases and development potential should be preferred. The educational and professional discipline needs should be considered when selecting a digital platform.
Despite significant efforts, this study has several limitations that future research should address. The study was regionally confined to architecture students in Turkey, limiting the generalisability of the findings. Future studies should include other countries to enhance the applicability of the results. Additionally, the research only considered the evaluations of architecture students, excluding the perspectives of instructors, tutors and decision-makers. Future research should explore these stakeholders’ evaluations for cumulative improvement. Furthermore, while this study focused on digital platforms as a crucial variable affecting educational success, other variables such as age, gender and student grade levels should also be considered in future OAE research.
The unique experiences gained from this study provide valuable insights for the future. Properly analysing these experiences and developing solutions can help avoid similar problems in the future.